Unified Modeling and Analyzing of Personal Data and Behaviors for
Individualized Information Utilization
ZZZHOU, Xiaokang
Abstract
With the rapid development of emerging computing paradigms, such as Ubiquitous Computing, Cloud Computing, Social Computing, and Mobile Computing, we have been continuously experiencing a fast change from all walks of our work, life, learning and entertainment. The high accessibility of SNS (Social Networking Service), coupled with the increasingly widespread adoption of wireless mobile computing devices, enables more and more populations to continuously generate larger amount of data from different environments, which represents more . It is said that a new era of big data has arrived. Among those big data, the so-called personal data, not only referring to the collection of data that is generated from an individual, but also any data that is related to an individual, has become a crucial source of innovation and value. It is indubitable that the valuable information hidden in personal big data can benefit individuals in various aspects.
Generally, information utilization is regarding various applications involving people and information together, including information seeking and recommendation for an individual, and information sharing and knowledge creation within a group. To take advantage of the considerable size of personal data for individualized information utilization, it is of crucial importance to build a well-structured user
model, further make sense of individuals intentions or needs, analyze various information behaviors and social activities, and better understand the user contexts.
However, in many cases, the large scales of personal big data, dynamically generated from a variety of systems and different devices, is always with different data structures or no structure, and coupled with lots of useless noise data. It makes it difficult to find piece of relevant information that fits users time-varying needs.
Research works have tried to find a flexible and efficient solution
from satisfaction due to the more complexity and heterogeneity of the personal big data.
In this study, to facilitate individualized information utilization and sharing not only for the individuals, but also for the groups or communities, we concentrate on the computational approaches to unified modeling and analyzing of the personal data and behaviors. The chaotic data will be systematically organized and managed to form the associative information, including time-varying individual intentions and additional information for the descriptions of data relations. The individual
behaviors and social activities will be analyzed to extract the behavioral features and calculate the similarities among them. Furthermore, the related individuals will be connected in a dynamically socialized networking according to the calculation of their dynamical and potential correlations. Their multi-dimensional profiling will be built,
and the social communities will be discovered based on the outcomes from the analysis of personal data. Finally, both the behavior patterns and user correlations will be considered together to develop an integrated recommendation mechanism to provide the users with individualized support.
Firstly, a unified framework of data integration and organization called Organic Streams, is proposed to analyze and organize the personal big data. The new concept
of organic stream, which is designed as a flexibly extensible data carrier, is introduced and defined to provide a simple but efficient means to formulate, organize, and represent the personal big data with inherent and potential relations. It can also be regarded as a logic metaphor to meaningfully analyze and process the raw stream data into an associatively organized form based on the individual needs. A heuristic mechanism is developed and applied to capture time-varying interests or needs, and aggregate and integrate the relevant data together to obtain the associative information.
A behavioral analysis approach is proposed to detect and calculate the social influence hidden in the individual behaviors, and model and analyze the sequential behaviors in the task-oriented processes with formal descriptions. The action patterns a
and the behavioral similarities among a group of users are then calculated and
described based on the action patterns. The perceived social influence can be utilized to analyze and describe users social relationships, and the extracted action patterns as well as their similarities can help improve the quality of user contexts and assist the recommendations in the task-oriented processes.
Based on these basic models and methods, the DSUN (Dynamically Socialized User Networking) model, as a viable alternative way to obtain larger information sources and connect more and more people together, is constructed to describe and represent users implicit and explicit social relationships, namely the characteristics -based relationships and influence-based relationships, using the valuable outcomes of analyzing personal data and individual behaviors. A set of measures are introduced and defined to measure and describe the detail of user correlations, which can dynamically calculate and build a connection between two related people in a specific time period, according to their static and dynamical feature based similarity and interactional behavior based social influence. A series of attributes are defined and analyzed to build the multi-dimensional user profiling, which can facilitate the search of information sources by finding favorable users in both global (e.g., hub user and promotion user) and personalized (e.g., contribution user and reference user) way.
Three algorithms are developed to discover the multi-types of social communities considering both the dynamical user correlations (e.g., strong correlation-based tie
and weak correlation-based tie) and profiling (e.g., user profiling-based tie), which can recommend users to join different communities in accordance with their different intentions, so as to promote the information sharing and collaborative work.
Moreover, as an application of the proposed approaches, an integrated recommendation method is proposed to provide users with the individualized learning guidance and support. A hierarchical model is presented to describe the relations among learning actions, activities, sub-tasks and tasks within a user community for the task-oriented learning process. The LA-Pattern (Learning Action Pattern) is defined to
extracted from sequences of learning actions, and theGoal-driven Learning Group is proposed to analyze and describe the similarities of learning behaviors among a group of users. Based on these, an integrated mechanism is developed for the goal-driven learning recommendation in accordance with the analysis of behavior patterns and user correlations, which can provide the target user with the most suitable learning action as the appropriate next learning step to complete a specific learning goal.
To demonstrate the feasibility and effectiveness of our methods, two experimental studies are conducted respectively. The experimental results with the analyses conducted using the Twitter data demonstrate the high usability and practicability of our proposedDSUNmodel which can assist personalized information
utilization and sharing in both favorable user finding and social community discovering. The empirical analysis results conducted in a community-based learning system illustrated that the calculated LA-Patterns and Goal-driven Learning Groups can correctly describe the users learning behaviors and their similarities as well, which can be applied to frequency-based learning pattern recognition and categorization according to different learning goals. And the evaluation results showed the usefulness of our proposed recommendation method that can effectively guide users to pursue their learning purposes and facilitate the task-oriented learning process.
This study is expected to benefit both individuals and communities, not only in the systematical processing of personal big data which can capture the time-varying individual needs and generate associative information from the chaotic data to facilitate the personalized information seeking and social knowledge creation, but also in the dynamical constructing of social relationships which can help build a well-structured user model and involve increasing people into a well-connected social networking to promote the information sharing and recommending. The unified modeling and analyzing approach presented in this study can facilitate the individualized information utilization from chaotic data to associative information, and further to connected people.
TABLE OF CONTENT
Chapter 1 Introduction ...1
1.1 Background ...1
1.2 Purpose of this Study...4
1.3 Contributions of this Study ...6
1.4 Organization of the Thesis ...7
Chapter 2 Related Work ...10
2.1 Social Media Application and Life Log Analysis ...10
2.2 User Relationship Analysis ...13
2.2.1 User Correlation Analysis ...13
2.2.2 Social Influence Analysis ...14
2.2.3 Social Community Discovery ...15
2.3 Information Behavior Modeling and Pattern Analysis...16
2.4 Summary ...18
Chapter 3 Analysis of Personal Data and Behaviors: Definition and Model ...20
3.1 Organizing of Personal Stream Data ...20
3.1.1 Metaphors for Organizing Process ...20
3.1.2 Organic Streams ...22
3.1.3 A Scenario for Enrichment of User Search Experience ...31
3.2 Analysis of Individual Behaviors...34
3.2.1 Detecting Influence from Individual Behaviors...34
3.2.2 Analyzing Sequential Action Behaviors ...36
3.3 Summary ...39
Chapter 4 Dynamically Socialized User Networking...42
4.1 Constructing of DSUN Model...42
4.1.1 The Basic Model ...42
4.1.2 User Relationship Description ...44
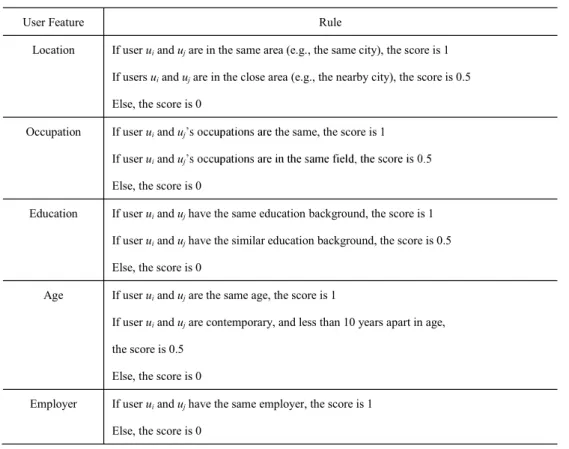
4.1.3 User Characteristics Similarity Analysis...46
4.1.4 User Influence Behavior Analysis...50
4.2 User Correlation and Profiling Analysis ...52
4.2.1 Measures for User Correlations...53
4.2.2 Attributes for User Profiling ...56
4.3 Mechanisms for Social Community Discovery ...62
4.4 Experiments on DSUN Model ...66
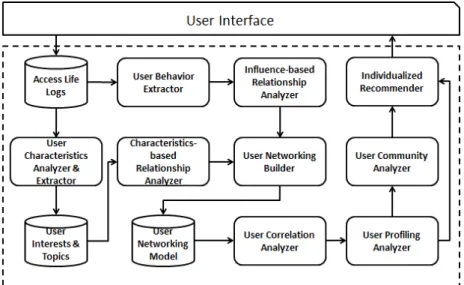
4.4.1 System Architecture of User and Community Recommendation ...66
4.4.2 Data Set for DSUN Model Experiments ...68
4.4.3 Experimental Results of User Profiling ...70
4.4.4 Experimental Results of Social Community Discovery...75
4.4.5 Discussions...81
4.5 Summary ...84
Chapter 5 Task-Oriented Recommendation for Learning Support ...86
5.1 Definitions and Hierarchical Model ...86
5.2 Similarity of Learning Action Behaviors ...89
5.2.1 Generating of Learning Action Patterns...89
5.2.2 Generating of Goal-Driven Learning Group...91
5.3 User Correlation Analysis in Learning Processes ...94
5.4 Recommendation in Task-Oriented Processes ...97
5.4.1 Detection of Goal-Driven Learning Action Patterns...97
5.4.2 Goal-driven Learning Recommendation Mechanism ...99
5.5 Experiments on Learning Recommendation ...102
5.5.1 System Architecture of Task-Oriented Recommendation ...103
5.5.2 Data Set for Learning Action Experiments ...104
5.5.3 LA-Pattern Analysis Results ...106
5.5.4 Evaluation...113
5.6 Summary ...119
Chapter 6 Conclusions ...121
6.1 Summary of this Study...121
6.2 The Limitations ...127
6.3 Future Works ...128
Acknowledgements...129
Bibliography ...130
LIST OF FIGURES
Figure 1-1 Facilitation from Associative Data to Connected People...5
Figure 3-1 Graph Model for Stream Data...21
Figure 3-2 Image of Organization Process of Stream Data ...25
Figure 3-3 Illustration of Dynamical Division of Time Slices ...27
Figure 3-4 Generation of Associative Ripples ...29
Figure 3-5 Algorithm for Generating Associative Ripples ...31
Figure 3-6 The Scenario of Enhanced Information Seeking...32
Figure 4-1 Conceptual Image of Building Dynamical Similarity-Based Relationships...49
Figure 4-2 Illustration of Influence-Based Relationship ...50
Figure 4-3 Algorithm for Generation of Strong Correlation-Based Tie ...63
Figure 4-4 Algorithm for Generation of Weak Correlation-Based Tie ...64
Figure 4-5 Algorithm for Generation of User Profiling-Based Tie...65
Figure 4-6 Architecture of User Correlation/Profiling-Based Recommendation System...68
Figure 4-7 ...73
Figure 4-8 Images of Different Types of User Communities ...76 Figure 4-9 Changing in Size of Communities According to Different Thresholds
...78
Figure 4-10 Changing in Size of User Profiling-Based Ties for Different Hub Users ...80
Figure 4-11 Image of Information Dissemination in User Profiling-Based Tie ..81
Figure 5-1 Model of Task-Oriented Learning Process...88
Figure 5-2 Algorithm for LA-Pattern Generation...91
Figure 5-3 Algorithm for Goal-driven Learning Group Generation...92
Figure 5-4 Algorithm for Goal-Driven Learning Action Pattern Detection ...98
Figure 5-5 Conceptual Process of Learning Action Recommendation...99
Figure 5-6 Algorithm for Learning Action Recommendation ...102
Figure 5-7 Architecture of Task-Oriented Recommendation System ...103
Figure 5-8 Statistics for Goal-driven Learning Groups ...108
Figure 5-9 Statistics and Analysis for LA-Patterns in Each Group ...110
Figure 5-10 Evaluation Results in Comparison ...115
Figure 5-11 Usefulness Evaluation for Recommendation Results ...117
Figure 5-12 Assessment Results Based on Table 5-2 ...118
LIST OF TABLES
Table 3-1 Descriptions of Information Behaviors ...35
Table 4-1 Description for Static Features and Rules for Scoring ...46
Table 4-2 Results of Top 10 Users for Basic Attributes...70
Table 4-3 Results of Top 10 Hub and Promotion Users ...71
Table 4-4 Results of Top 5 Contribution Users and Reference Users for a Specific User...74
Table 4-5 Statistics for Numbers of Communities According to Different Thresholds...77
Table 4-6 Statistics for Hub Users in User Profiling-Based Ties...79
Table 5-1 Learning Actions and Their Notations...105
Table 5-2 Values for Assessment of Recommended Actions ...118
Chapter 1 Introduction
In this chapter, we introduce the background of this study. The motivation and purpose of this study are discussed. We then present the major contributions of this thesis. The organization of this thesis is addressed in the end.
1.1 Background
With the continuous development of social media (such as Twitter, Facebook), more and more populations have been involved into this social networking revolution, which leads to a tremendous increase of data scale, ranging from the daily text data to multimedia data that describes life. For instance, Twitter has registered more than six hundred million active users by January, 2014, who generate average 58 million tweets per day. Every month, Facebook deals with 570 billion page views, stores three billion new photos, and manages 25 billion pieces of contents [1]. It is said that the age of big data, which is permeating into all aspects of our life, work, and learning, has arrived. Big data, which includes data sets with sizes beyond the ability of current technology, method and theory to capture, manage, and
process the data [2], are high-volume, high-velocity,
and/or high-variety information assets that require new forms of processing to enable
enhanced decision making, insight discovery and process [3].
Especially, the so-called personal big data (e.g., life logs), which includes a variety of data, such as text, location, sound, images and videos, and is dynamically produced from multiple sources with different data structures or even no data structure, has become an important source of value and innovation. However, it is difficult for an individual (end-user) to utilize the useful and valuable information, such as user experience and social knowledge hidden in these records, by simply processing the large amount of raw data. Therefore, it has become a big challenge to process such massive amounts of personal data, which has attracted a lot of attentions ranging from academia, industry to government as well.
Information utilization, including information seeking and recommendation for an individual, and information sharing and knowledge creation within a group, has always been identified as an important concept during decades of development of information technology, ranging from research institutions to government organizations. Although there are a variety of definitions and applications for it, the key point is all about the individuals and information coming together [4]. Recently, the rapid development of emerging computing paradigms, such as Ubiquitous Computing, Social Computing, and Mobile Computing, enable more and more people to continuously sharing their personal contents including feelings, experience, and
knowledge from their local environments. These cooperative and pervasive data collected at the personal, urban, and global scale, which represents more information
in terms of daily routines [5], contains big
potential value for an individual, business, domestic and national economy development as well. That is, the insights from the personal data coupled with individuals information behaviors and social activities, can be viewed as a kind of valuable outcome to benefit the personalized information utilization.
Therefore, to facilitate individualized information utilization and sharing for both individuals and communities, we concentrate on the computational approaches to unified modeling and analyzing of the personal data and behaviors. On one hand, it is essential to find an effective way to model and organize the personal data, to capture users time-varying intentions and needs timely, and mine the complex association among data efficiently. On the other hand, it is necessary to analyze the individuals information behaviors and social activities from both of the networked digital space and physical human society, to be aware of the insight from the individual behaviors, and better understand the user context from a series of actions. Meanwhile, since the complex relations among big data always associate with the corresponding relationships among people, as well as their groups, the refinement of our social relationships is also requisite, not only to enlarge our professional sphere to promote
the information sharing and social knowledge creation, but also to extend our social circle to seek for more timely and accurate information related to our needs in different situations.
1.2 Purpose of this Study
As discussed above, the information dynamically generated from a variety of systems and different devices has spread more widely and quickly, and individuals are connected much closer than ever before, which leads to an explosive increase of data scale. Thus, it has become an increasing important issue to effectively analyze and organize the so-called personal big data, in order to find a way to better utilize the valuable information to provide individuals with the personalized service and support.
In details, to take advantage of the considerable size of personal data for individualized information utilization, a well- structured user model for an individual, and a user networking model for a group of individuals are requisite. The data
analytics is also necessary to , analyze
the various information behaviors and social activities, and better understand the user contexts. However, the large scales of personal big data with different data structures or no structure is always along with lots of useless noise data, which makes more difficult to utilize piece of relevant information to satisfy individual -varying requirements.
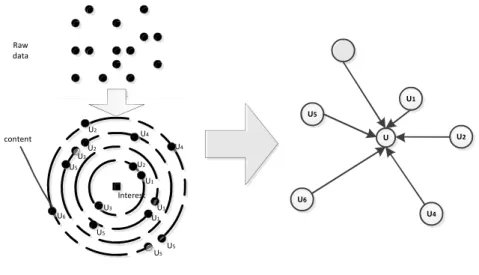
Figure 1-1 Facilitation from Associative Data to Connected People
Therefore, in this study, we delve into modeling and analyzing the personal data coupled with the individual behaviors. As shown in Fig. 1-1, firstly, the personal big data will be systematically managed and organized, which aims to meaningfully process the raw data into an associatively and methodically organized form. And users information behaviors and social activities will be modeled to extract the behavioral features and analyze the similarities among them. Secondly, users dynamical profiling will be built and the potential correlations will be discovered in accordance with the outcomes from the analysis of personal data and individual behaviors, which aims to better exert the capabilities of individual users and utilize the collective intelligence from social communities. Thirdly, both the behavior similarities and the social relationships will be integrated into a personalized recommendation mechanism,
which can be applied to assist the collaborative works in the task-oriented processes.
Accordingly, all these aim to continuously provide an effective way for the individualized information utilization from chaotic data to associative information, and further to connected people.
1.3 Contributions of this Study
In this study, we focus on four major contributions on:
1) A unified modeling for associative organization of personal big data
A new concept of organic stream, which is designed as a flexibly extensible data carrier, is introduced and defined to provide a simple but efficient means to formulate, organize, and represent the personal big data. A heuristic mechanism is developed to capture individual time-varying interests or needs, and aggregate and integrate the relevant data together to obtain the associative information.
2) An behavioral analysis method for detecting of social influence and action patterns
A behavioral analysis method is proposed to detect and calculate the social influence within the individual behaviors. A mechanism is developed to automatically analyze and extract individuals action patterns from a series of information behaviors.
And the behavioral similarities among a group of individuals are calculated and described based on the action patterns.
3) A user networking model for multi-dimensional user profiling and dynamical community discovery
A DSUN (Dynamically Socialized User Networking) model is proposed to describe users implicit and explicit social relationships based on the outcomes of the analysis of personal data and individual behaviors. A series of measures are defined to describe and measure the dynamical user correlations, and a set of attributes are analyzed to build the multi-dimensional user profiling, which are utilized to discover the multi-types of social communities for the facilitation of information utilization and sharing.
4) An integrated mechanism for progressive recommendation in the task-oriented learning processes
An integrated mechanism is developed to utilize the combination of user behavior patterns and user correlations in a progressive recommendation, which can provide users with the most suitable learning actions as their learning guide and support for the better utilization of personal learning experience in the task-oriented processes.
1.4 Organization of the Thesis
This thesis is organized in six chapters. In Chapter 1, we introduce the background of this study, discuss the motivation and purpose, and point out the major contributions
of this study.
In Chapter 2, we address and discuss the main issues related to this study, including issues of studies on social media application and life log analysis, analyses for user relationships and communities, and user behaviors modeling and pattern recognition.
In Chapter 3, the basic concepts and models to analyze the personal data and individual behaviors are introduced. A heuristic mechanism is developed to organize the associative information from the raw data [6], and a behavioral analysis method is proposed to analyze and model the individual behaviors [7].
In Chapter 4, the details of the constructing of the DSUN model [8], as well as the definitions and calculations of user correlation and profiling, are introduced. A series of algorithms and mechanisms are proposed and developed to build the user profiling [9] and discover the social community respectively. The experimental results are analyzed and discussed finally.
In Chapter 5, an integrated mechanism is developed to support the collaborative learning in the task-oriented processes, in which both user behavior patterns and user correlations are utilized to provide the individualized recommendation of learning actions [7]. The experiment and evaluation results are discussed finally.
Finally, in Chapter 6, we give a brief summary of the thesis, and conclude the
features of this study. The expected challenging issues and the future working directions are also presented.
Chapter 2 Related Work
Three main issues related to this study are walked through in this chapter. That is, issues of studies on social media application and life log analysis, analyses for user communities and relationships, and user behavior modeling and pattern recognition are addressed respectively.
2.1 Social Media Application and Life Log Analysis
There are many applications utilizing the analysis results of the data across social media [10-19], ranging from the public/individual interest detecting, to the topic-based activity/event predicting. By examining the twitter data to track rapidly-evolving public sentiment and activity, Signorini et al. showed that Twitter can be used as a measure of public interest or concern about health-related events [10].
Analysis of twitter communications in [11] revealed the experimental evidence that Twitter can be used as an educational tool to help engage the students, and mobilize the faculty into a more active and participatory role. A study addressed in [12]
examined the impact of posting social, scholarly, or a combination of social and scholarly information to Twitter on the perceived credibility of the instructor, which may have implications for both teaching and learning. Black et al. [13] presented a
methodological approach and a technology architecture, which examined Twitter as a transport protocol in different socio-technical contexts, in order to capture, transfer, and analyze the twitter interactions. Byun et al. [14] developed a java-based data gathering tool with the design specifications to continuously and automatically collect social data from Twitter and filter noisy data, which can benefit the analysis of twitter messages, and further assist the detections of hot issues and topics and the discoveries of groups or communities. Wang et al. [15] proposed a hashtag-based sentiment classification method for the Topic Sentiment Analysis in Twitter, in which a graph model was introduced to deal with the hashtag-level information with three inference algorithms (loopy belief propagation, relaxation labeling and iterative classification algorithms) for classification. Kendall et al. [16] conducted a content-based analysis on twitter posts which focused on health-related fitness activities, in order to support the tool and application design with social media platform. Cogan et al. [17] proposed a method to reconstruct the complete conversations around the initial tweets, in order to analyze how users communicate on the initial post over time. Vosecky et al. [18]
developed an interactive system, called Limosa, to model the comprehensive geographic characteristics of the topics discussed in Twitter, and visualize users geographic interests. Pervin et al. [19] proposed a method as well as the implementation to detect the trending topics with a contextual meaning from the
real-time text stream in twitter posts.
Especially, as one kind of personal big data, life logs have attracted increasing attentions in recent years [20-25]. The analysis results of life logs can be utilized to provide people with more adaptive and personalized services. Yamagiwa et al. [20]
proposed a system to achieve an ecological lifestyle at home, in which sensors measure the social life log by the temperature, humidity, intensity of illumination related to human action and living environment closely. Hori et al. [21] developed a context-based video retrieval system which utilized various sensor data to provide video browsing and retrieval functions for life log applications. Hwang et al. [22]
developed a machine learning method for life log management, in which a probabilistic network model was employed to summarize and manage the human experiences by analyzing various kinds of log data. Kang et al. [23] defined metadata to save and search life log media, in order to deal with those problems such as high-capacity memory space and long search time cost. Shimojo et al. [24] have re-engineered the life log common data model (LLCDM) and life log mashup API (LLAPI) with the relational database MySQL and the Web services, which can help access the standardized data, in order to support the integration of heterogeneous life log services. Nakamura et al. [25] proposed a method to infer user temporal preference according to their interests by analyzing the web browsing logs.
2.2 User Relationship Analysis
Three important aspects, including user correlation analysis, social influence analysis, and social community discovery, are introduced to address the issues of analysis of user relationships.
2.2.1 User Correlation Analysis
Researchers recently focused more on the aspect of user correlation analysis [26-33], which can benefit not only the social graph constructing, but also the user grouping process. Based on the analysis of the correlation between social and topical features in online social networks such as Flickr, Last.fm, and aNobii, Aiello et al. [26] built a user similarity network to perform the prediction of friendships. Yu et al. [27]
proposed a method to provide suggestions of suitable social groups based on a user's personal photo collection, which considers both similarities of the groups and relationships among images in a user's collection. In order to find the strong relationships automatically in social networks, Aiello et al. [28] analyzed the social network in a social bookmarking system named Nobii, in order to investigate the interplay of profile similarity and link creation according to interest-based factors.
Xiang et al. [29] developed a latent variable model to infer the relationship strength, in which both profile similarity and interaction activity are taken into account to improve the strength estimation. Leroy et al. [30] proposed a so-called cold start link
prediction method which could detect potential social graph by using group membership information obtained from Flickr. Wilson et al. [31] proposed the interaction graphs to quantify user interactions in the Facebook social network, in order to find out whether social links are valid indicators of real user interaction. Tang et al. [32] explored different group-profiling strategies using information extracted from the real-world social media sites for group construction, in order to better assist network analysis and navigation. Zheng et al. [33] proposed a framework for the personalized friend and location recommendation, which measure the similarity relationship between users in terms of their location histories and recommend a group of friends in a geographical information system community.
2.2.2 Social Influence Analysis
Issues regarding to the measuring of social influence have been hotly discussed recently [34-40]. Romero et al. [34] proposed and developed an algorithm that determines the
through social media. Tang et al. [35] proposed the TAP (Topical Affinity Propagation) to model and identify the topic-level social influence across a large social network. Sang et al. [36] proposed a multimodal probabilistic model, which considered both the users' textual annotation and uploaded visual images, in order to
extract the -sensitive influence strengths.
Achananuparp et al. [37] examined user behaviors, especially the retweeting activities among the Twitter users to model the behaviors relevant to information propagation, which was further used in the event detecting process in the Twitter environment.
Tang et al. [38] proposed a framework to analyze the user influence within the online healthcare community, in which the
and response immediacy were considered together to identify the influential users.
Ronald et al. [39] proposed an agent-based model to describe the influence from social activities between a pair of users, which has been experimented with four input networks, in order to demonstrate the relevance of the social network structure.
Gomez-Rodriguez et al. [40] proposed and demonstrated a scalable method to infer diffusion and influence through networks by tracing information cascades in the asset of blogs and news articles.
2.2.3 Social Community Discovery
User relationship modeling and analysis for the discovery of communities, have also drawn a large body of researches [41-46]. Lin et al. [41] proposed the MetaFac framework which utilized various social contexts and interactions for community structure extraction, to support the community discovery process. Leskovec and Horvitz [42] constructed a communication graph to examine characteristics and patterns based on the collective dynamics of 240 million users rather than the
individual actions or characteristics. Yin et al. [43] built a model for the latent community topic analysis, in which community discoveries were incorporated into the topic analysis in the text-associated graphs, in order to guarantee the topical coherence in the communities. Goolsby [44] introduced the so-called ad-hoc crisis community that used the social media as a crisis platform to generate community crisis maps. Zhang et al. [45] presented a unified framework which combined the author-topic model with the user friendship network analysis for the user community discovery in online social networks. Paliouras [46] focused on discovering user communities and their roles from the logs of users' activities across the social networking, which can be used to model the users' interests and personalize Web applications.
2.3 Information Behavior Modeling and Pattern Analysis
The user behavior modeling, as well as the behavior pattern analysis, has been developed by more and more researchers for its widespread availability during these years [47-55]. Razmerita [47] proposed a generic ontology-based user modeling framework (OntobUMf) to model the user behaviors, and used it for the user classification, in order to enhance the personal knowledge management. Stolfo et al.
[48] used the EMT (Email Mining Toolkit) empowered with behavior-modeling techniques to compute behavior profiles of user email accounts, which can help detect
the viral propagation problem. Chen et al. [49] proposed a data mining method to extract the user movement behavior patterns, in order to predict and recommend suitable services for users in a mobile service environment. Considering both user behaviors and collaborative filtering, Liu et al. [50] proposed a semantic relatedness measure between words to retrieve related words and detect new word tasks, which can help enrich user experience and discover hidden information. Lee et al. [51]
developed a non-supervised learning framework to discover the behavior patterns, in which a new cluster validity index was proposed for agglomerative iterative Bayesian fuzzy clustering, and the fuzzy-state Q-learning was proposed to learn the sequential actions. Yun et al. [52] proposed a model to mine mobile sequential patterns, in which both user moving patterns and purchase patterns were taken into account, and they further devised three algorithms (TJLS, TJPT, and TJPF) to determine the frequent sequential patterns in the mobile commerce environment. Muñoz-Organero et al. [53]
utilized the behavior patterns to predict student motivation, which can further be used to predict the successful completion of an e-learning course, based on the analysis of relationships between the motivation and performance of 180 students who took an e-learning course deployed on a Moodle e-learning platform. Plantevit et al. [54]
presented a method to mine sequential patterns from multidimensional and multilevel databases, which took account of different dimensions and levels of granularity, in
order to discover the regular specific patterns. Zhao et al. [55] proposed an access-pattern-driven distributed caching middleware named APRICOD, which gave more consideration on user interactions for media streaming applications.
2.4 Summary
Research works pointed out the trends of utilization of the personal data not only in the design of systems and models, but also in practical recommendation and prediction services, which can provide us with more information and knowledge in various aspects using the data mining and analyzing methods. The analysis of user relationships and discovery of communities can promote the collaborative works. And the modeling of user behaviors, as well as the calculation of influence from the social activities, can also help enhance the information seeking and sharing process. In this study, we concentrate on the unified modeling of personal data, and analyzing of individual behaviors. Comparing with the traditional methods, we focus more on capturing individuals time-varying intentions, and further integrate and organize the associative information in accordance with the extracted intentions. We also highlight the modeling of sequential information behaviors to improve the behavioral contexts of individuals in the task-oriented processes. Differing from other user graph model, a newly developed user networking model based on the calculations of the similarity of user characteristics and the influence from interactional behavior, is built, which can
result in the multi-dimensional user profiling and multi-types of social communities for individualized information utilization. Furthermore, an integrated mechanism is developed to utilize the both behavior patterns and user correlations for the progressive recommendations, which can provide users with personalized learning guidance and support.
Chapter 3 Analysis of Personal Data and Behaviors:
Definition and Model
The personal big data, including the large scales of user-generated data and a variety of individual behaviors, contains enormous amount of potential worth and value not only for the enrichment of people s social activities, but also for the enhancement of collaborative works from all walks of life. In this chapter, the basic concepts, and models are introduced to discover the valuable outcomes from the so-called personal stream data, and individuals information behaviors as well.
3.1 Organizing of Personal Stream Data
The tremendous amount of diverse data, which is dynamically generated by individuals, and continuously spread across the social networking, can be viewed as the personal stream data. It should be organized systematically to obtain the meaningful information.
3.1.1 Metaphors for Organizing Process
Toward this purpose, we introduce the metaphors for the organization of this kind of data streams as follows.
Drop: Drop is a minimum unit of data streams, such as a message posted to
Twitter, or a status change in Facebook by a user.
Stream: Stream is a collection of drops following the timeline, which contains
the messages, activities and actions of a user.
River: River is a confluence of the streams from a series of different users which
are constituted through following or subscribing their followers/friends. Note that the confluence scale
Ocean: Ocean is a combination of all the streams.
As mentioned above, the content posted from each user can be seen as a drop, and the drops converging together from one specific user can form a stream. Then the streams generated from this user and his/her friends can aggregate together to form the river. Finally, all the streams from all the users come together to form the ocean.
The conceptual graph model is shown in in Fig. 3-1.
Figure 3-1 Graph Model for Stream Data [6]
Ripple
Stream
User 1
River
User2 User1
User9 User 2
User 9
Drop
Ripple
Ocean
confluence
Based on these, the following definitions are proposed and defined for the
personal data organization or needs.
Heuristic Stone
interests or needs which may be changed dynamically in different time periods.
Associative Ripple: Associative ripple is a meaningfully associated collection of
the stream data
interests in the river level.
Associative Drop: Associative drop is the stream data selected into an associative
ripple, which is related to one specific heuristic stone and can further composes the organic stream.
3.1.2 Organic Streams
3.1.2.1 Concept and Definition
The organic stream, which is designed as a flexibly extensible data carrier, is introduced and defined to provide a simple but efficient means to formulate, organize, and represent the personal big data. As an abstract data type, organic streams can be regarded as a logic metaphor, which aims to meaningfully process the raw stream data into an associatively and methodically organized form, but no concrete implementation for physical data structure and storage is defined. The details are addressed as follows.
Organic Stream: Organic stream is a dynamically extensible carrier of organized
personal data that may contain potential and valuable information and knowledge.
The formal description of organic stream can be expressed in Eq. (3.1).
(3.1) where,
Hs ={Hs[u1, t1], Hs[u2, t2],..., Hs[um, tn]}: A non-empty set of heuristic stones in accordance with different users intentions (e.g., users current interests or needs), in which eachHs[ui, tj] indicates a extracted heuristic stone of a specific user uiduring a selected time periodtj.
Ad= {Ad1, Ad2, , Adn}:A collection of associative drops which can refer or link to each other based on the inherent or potential logicality in a methodical and associative way.
R: The multi-types of relations among heuristic stones and associative drops in
the organic stream.
Furthermore, the relation R in the organic stream can be categorized into three major types: relation between each heuristic stone; relation between each associative drop; and relation between heuristic stone and associative drop.
Relation between Heuristic Stone and Associative Drop: This type of relation identifies the relationships between one heuristic stone and a series of associative drop,
which can be represented as Heuristic Stone × Associative Drop. It is the basic relation in the organization of organic stream, which means different granularities of heuristic stones may lead to different scales of related drops connecting together in the organic stream.
Relation between Heuristic Stone and Heuristic Stone: This type of relation
identifies the relationships among the heuristic stones in the organic stream, which can be represented as Heuristic Stone × Heuristic Stone. Due to the different users and different time periods, this kind of relation can further be categorized into two sub-types:
: This relation identifies the relationships of the heuristic stones extracted from one user. That is, this relation is used to describe those internal relationships or changes for a specific user s intentions. Given a series of heuristic stones from a specific user ui, represented as {Hs[ui, t1], Hs[ui, t2],..., Hs[ui, tn]}, the differences from Hs[ui, t1] to Hs[ui, tn] changed in a sequence can demonstrate the transitions of this user s interests or needs in a specific period, which can be employed to infer his/her further intention.
: This relation identifies the relationships of the heuristic stones extracted among different users. That is, this relation is used to describe those external relationships among different users intentions. Given two heuristic stones,
represented as Hs[ui, ta] and Hs[uj, tb] for two different users, the relationship can demonstrate the potential connections among these two users in accordance with their dynamical interests or needs.
Relation between Associative Drop and Associative Drop: This type of relation
identifies the relationships among those drops that are clustered into the associative ripples and further compose the organic stream, which can be represented as Associative Drop × Associative Drop. The drops connected together based on this
relation in different associative ripples can represent the whole trend as well as its changes following the timeline.
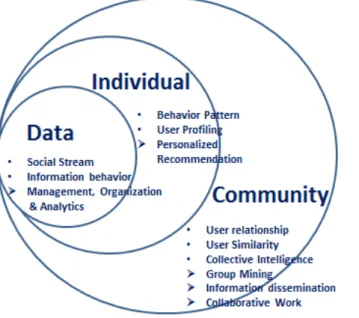
Figure 3-2 Image of Organization Process of Stream Data [56]
Fig. 3-2 shows an image of the organization of personal stream data. As discussed
interest or need, which can be discovered and extracted from his/her own streams. The associative ripple is then generated in accordance with the heuristic stones. For a
specific user, the whole timeline will be divided into several time slices, the heuristic stones are composed by the keywords that are calculated and extracted from his/her own stream data according to the TFIDF-based method. Then each of the time slices will produce an associative ripple in accordance with the heuristic stone. Specifically, each extracted heuristic stone, which can be viewed as the cluster center in each divided time slice,
associative ripples which consist of a set of related drops. Note that different granularities of the calculation of the heuristic stones will lead to different numbers of the associative ripples. The details of extraction and generation processes of heuristic stone and associative ripple are discussed as follows.
3.1.2.2 Collecting Heuristic Stones
As defined above, the heuristic stone is utilized to represent
need. We disco own stream data
following the timeline.
Specifically, two types of interests, the time-evolving interest and consistent intentions, which can be expressed in Eq. (3.2).
(3.2) where indicates the n-dimensional interests extracted from the personal
stream data. The parameteri, ranging from 1 ton, indicates the ranking number of the interest. HT indicates the time-evolving interest, called transilient interest, which describes one kind of interests that will change during some special time periods, or be intrigued due to some hot topics or interesting events. On the other hand, HD
indicates the consistent interest, called durative interest, which describes one kind of interests that can be viewed as the inherent interest and will be continuously held during a long time period.
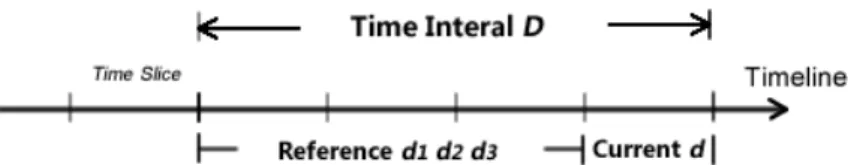
Figure 3-3 Illustration of Dynamical Division of Time Slices
To quantify and distinguish the transilient interest and durative interest for a specific user ui, as shown in Fig. 3-3, in a selected time interval D with several dynamically divided time slices dj, the transilient interest will be extracted in the current time slice d, while the other past time slices (e.g., d1, d2, and d3) will be considered as the references. The durative interest will be extracted referring to the whole time interval D, in which each time slice will hold the same durative interest.
The TFIDF-based method is developed to calculate the frequency-based weight for the transilient interest, which is expressed in Eq. (3.3).
(3.3)
where
For a keyword ki, D indicates the whole time interval, while dj indicates each time slice, D= {dj}. For instance, if Dis set as one month (say 28 days), thendj can be set as one week (seven days), thus D = {d1, d2, d3, d4}. indicates the frequency of the specific keyword ki in the time slice dx. indicates the sum of frequency of all the keywords in the same time slice dx. indicates the number of time slices in which the keywordkihas occurred in the keyword set .
On the other hand, Eq. (3.4) is employed to calculate the frequency-based weight for the durative interest.
(3.4) where, indicates the frequency of a specific keyword ki in the whole time intervalD, while indicates the sum of frequency of all the keywords.
3.1.2.3 Generating Associative Ripples
The extracted heuristic stone is utilized to generate the associative ripples. Note that each heuristic stone may generate a series of ripples, which depends on the number of
divided time slices A cluster center will be
formed by the heuristic stone in the time slice divided from the whole time interval.
The related drops in the river will converge to the cluster center. The distance between the drop and the center describes the relevance between them, and the drops which
have the same relevance to the center will distribute in the same circle. Fig. 3-4 illustrates the associative ripples generated in each time slice.
Timeline
Slice1 Slice2 Slice3 Slice4
Center Center
Center Center
Circle
Circle Circle
Circle
Ripple 1 Ripple 2 Ripple 3 Ripple 4
users
Figure 3-4 Generation of Associative Ripples [6]
As shown in Fig. 3-4, four associative ripples are generated in different time slices. The indicates the cluster center in each time slice
circles around it compose the ripple. All these four ripples are generated by one heuristic stone, which compose a ripple sequence. The drops distributed in each circle mean that they are relevant to the ripple in some degrees, while others are not. At the beginning, the drops from different users are distributing in the river following the timeline. After the clustering, the time sequence is broken, so that the drips do not follow the timeline any more in each ripple, but the relevancy degree to the cluster center from inside to the outside. Note that these ripples falling in the sequence still
follow the timeline.
A six-tuple (Z, Hs, , ,Ars, Q) is employed to describe the generation and composition of the associative ripple.
Z= {Z1,Z2,Z3 Zm}: A non-empty set of input data, which can be a collection of the contents posted by all the users in a certain group.
Hs = {h1, h2, h3 hn}: A non-empty set of the heuristic stones to represent users n-dimensional interests, each of which can generate a series of associative ripples.
: A non-empty sequence of stream data sets which have clustered into one associative ripple. Each
indicates a set of related data that distributed in a specific circle cirn of the ripple.
Note that the sequence of these data sets indicates the descending order in terms of the relevance degree regarding to the heuristic stone in the center.
= < , , >: A non-empty sequence of the
associative ripples produced by one heuristic stone, which follow the timeline in sequence.
Ars= { , , }: A non-empty set of , which is the final results of associative ripples for one specific user.
: A matching function which is used to decide whether Zi
belongs to and calculate the corresponding relevancy.
The algorithm to generate the associative ripples is shown in Fig. 3-5.
Input:The stream data setZ,
A Hs
Output:The associative ripple setArs
Step 1:Divide the whole time period into several time slices. For eachhj, create a cluster center in each time slice
Step 2:For eachZito eachhj,
if satisfy ,
insertZiwith the relevance degree into the corresponding circlecirnin
Step 3:For eachhi,
sort the corresponding by timeline and record them in each Step 4:Return the associative ripple set
Ars= { , , }
Figure 3-5 Algorithm for Generating Associative Ripples
3.1.3 A Scenario for Enrichment of User Search Experience
The method discussed above can be employed to enrich search experience and improve the information seeking process. The stream data analyzer and organizer are developed to create the user profiling in accordance with the organization of personal data from the so-called social streams that includes stream data in the cyber world or life log data from the physical world, which can contribute to both query initialization and document matching. Fig. 3-6 reveals the overall scenario of the enhanced information seeking process.
Figure 3-6 The Scenario of Enhanced Information Seeking [6]
As shown in Fig. 3-6, comparing with the traditional search system, two proposed operators, stream analyzer and organizer, are added to provide supplementary information. The personal data from social streams, such as the tweets in Twitter, are integrated into the search engine to assist search experience enrichment and search process facilitation. U or interests are extracted with those related personal data posted in the social network platform. We provide information to the implemented search engine and go further to create the social stream based user profile. The information provided in the user profile might affect
the ranking resu more precisely. In addition, users
may get feedback with some other adaptive keywords based on the analysis of stream data. They may start over a new query to pursue their requirements. All these can
contribute to the enrichment of user search experience.
As mentioned above, the proposed mechanisms and methods focus on organizing or needs. The associative information which is extracted and organized from the social streams can be utilized to influence the search ranking results and further provide users with a new perspective for information seeking and discovery. As a summary, user search experience can be enriched in the search engine as follows:
The heuristic stone(s) shown in the search engine can be viewed as sort of hints to the search keyword and provide users with a new perspective. These keywords changing dynamically and timely can be employed as sub-queries in the next search round to improve the search keyword quality and refine the search
scope .
The associative ripple(s) generated according to the heuristic stone contains some potential trends or needs among a certain group of people. These meaningfully organized information can provide users with the hot topics that people are discussing recently or the potential trends that may be pursued in the future, which can guide users to seek the more suitable and satisfied information.
Especially, this function may become more helpful in some cases that people do not know what they are really concerned about when they face to a search engine,
or just have a general concept of the seeking issue and type some words to have a try.
The search results can also be re-ranked in accordance with the heuristic stones and associative ripples. T
current interests or needs, or the hot topic and trends will come to the front of the whole s
3.2 Analysis of Individual Behaviors
People always conduct a variety of information behaviors to interact and communicate with each other within some certain social groups. It is necessary to analyze these individual behaviors to discover the behavioral insights hidden in their activities, which can help refine their social relationships, and benefit the individualized information seeking and recommendation.
3.2.1 Detecting Influence from Individual Behaviors
Specifically, in this study, two types of information behaviors, the influencing behavior and influenced behavior, are taken into account, which can be defined as follows.
Influencing Behavior (IgB( )): A set of information behaviors of user ui, which indicates that useruitends to influence useruj. It can also be considered as one kind of behaviors that indicates useru tend to delivery his/her personal information to
useruj.
Influenced Behavior (IdB( )): A set of information behaviors of user uj, which indicates that user uj has been influenced by user ui. It can also be considered as one kind of behaviors that indicates user uj has received user ui personal information or has been in favor of userui thought.
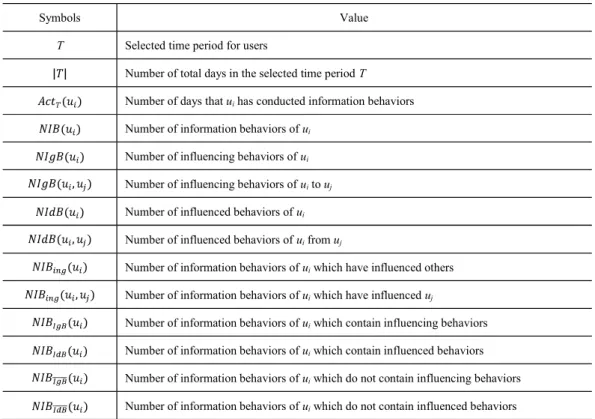
Table 3-1 Descriptions of Information Behaviors
Symbols Value
T Selected time period for users
Number of total days in the selected time periodT Number of days thatuihas conducted information behaviors Number of information behaviors ofui
Number of influencing behaviors ofui
Number of influencing behaviors ofuitouj
Number of influenced behaviors ofui
Number of influenced behaviors ofuifromuj
Number of information behaviors ofuiwhich have influenced others Number of information behaviors ofuiwhich have influenceduj
Number of information behaviors ofuiwhich contain influencing behaviors Number of information behaviors ofuiwhich contain influenced behaviors Number of information behaviors ofuiwhich do not contain influencing behaviors Number of information behaviors ofuiwhich do not contain influenced behaviors
For instance, in Twitter, the information behavior @name can be considered as the influencing behavior. It means user ui tends to build a connection, or delivery some information that may be related to user uj, when ui mentions @ uj in his/her posts. The information behavior RT @name can be considered as the influenced behavior. It means user u has selected and received a sort of u personal opinions,
whenujmentions RT @ui in his/her posts. In addition, the influenced behaviors can also be viewed as the positive behaviors for information propagation.
To describe and analyze individuals information behaviors, especially the influence-based behaviors, the frequency of information behaviors generated from each user is taken into account for the quantification, which is summarized in Table 3-1.
3.2.2 Analyzing Sequential Action Behaviors
We go further to analyze a series of individual behaviors which can be described as a sequence of action behaviors, in order to discover the behavioral similarities based on the action patterns not only to benefit an individual user, but also for a group of users in a social community.
3.2.2.1 Formal Description of Action Behaviors
To discover and model the sequence-based action patterns, the sequential action behaviors in a task-oriented process can be formalized as follows:
act= {U,O,Ir}: A non-empty set to describe the information action, which is the minimum unit for the description of information behaviors.U indicates the user who has conducted this specific action, O indicates the concrete operation of this action behavior (e.g., clicking a web link), andIrindicates the information resources that the userUhas used associated with this action behavior.
Act = < act1, act2, , actn, G>: A non-empty set to describe the information activity, which is represented as a sequence of information actions. Especially, G, in the end of the sequence, is a special action that indicates a specific purpose of this information action sequence, while each acti indicates the information action that belongs to this activity to complete the certain purpose.
S-Task = <Act1,Act2, ,Actn,T>: A non-empty set to describe the information sub-task, which is represented as a sequence of information activities. Each Acti
indicates the information activity that belongs to this sub-task. T indicates a specific time period selected within the whole information task, which can also be viewed as an end of time interval.
Task = < S-Task1, S-Task2, , S-Taskn, >: A non-empty set to describe the information task, which is represented as a sequence of information sub-tasks. Each S-Taski indicates the information sub-task that is divided from this task, while indicates the whole time period to complete the specific information task.
3.2.2.2 Similarity Analysis of Action Patterns
The trie [57], an ordered tree-based structure which can be used to store a dynamic string-like data set, has been well developed and applied in information storing and retrieving. For instance, Iglesias et al. [58] have applied the trie data structure in behavior profile creation and recognition for a computer user. In this study, we
employ this tree-based data structure to find all the related sub-sequences with their frequency in a given information action sequence, in order to calculate the weight w of each action pattern. In particular, a certain action sequence with its subsequence suffixes which extend to the end of this sequence will be all inserted into a trie, in order to calculate the frequency of each sub-sequence during the tree building process.
For example, if the whole sequence is <A, B, C, D>, three sub-sequences <B, C, D>,
<C, D> and <D> shall also be inserted.
Based on these discussed above, two criteria are given to generate the action patterns.
Criteria 1 - Basic Criteria: Given a pre-defined action purpose set G = {G1,
G2, , Gm}, and a sub-sequence q described as ,
where w indicates the weight of each sub-sequence. If it satisfies that n >=2, w>=2, and Actn G, then q is an action pattern for user ui, which can be described as
.
Criteria 2 - Incorporation Criteria: Given two sequences
q1: and q2: for user ui, if they
satisfy that wx = wy, and , then q1
can be incorporated intoq2.
Based on these two criteria, for a specific user, a variety of action patterns can be
extract from the whole action sequence to describe the behavioral features during a selected time period. Note that the different granularities of input action sequences (e.g., one sub-task or one task) will lead to different results of action patterns, which represent the different characteristics of the action behaviors during different time periods.
The similarity among a group of users based on their action patterns can further be analyzed. That is, the whole of action patterns extracted from each user can be grouped into different categories according to the behavioral similarities, specifically, including the action sequences and the corresponding purpose. The former one represents the similarity of information behaviors among the users based on the action patterns, while the latter one indicates the same purpose that these users try to achieve within a specific time period.
Based on these discussed above, it can be viewed as that the users in the same group may have similar action sequences with different weights, which can be formalized as , to pursue the same purpose within a task-oriented process. Thus, the similar action behaviors can be shared among them in order to facilitate their collaboration works and reach the better efficiency.
3.3 Summary
In this chapter, we have introduced the basic methods to systematically model and
describe the personal data and individual behaviors. The basic concepts, models and mechanisms have been addressed to organize the so-called personal stream data, and model the individual action behaviors, in order to better understand the insight hidden in the big personal data and further benefit the individualized information utilization.
Following a graph model to describe the personal stream data in a hierarchical structure using a set of metaphors, the organic stream has been introduced and defined as an extensible data carrier to formally organize, and represent the personal big data.
Three basic relations were defined and proposed to flexibly describe the inherent and potential relationships among the raw stream data. Based on these, two kinds of user interests, the time-evolving interest and consistent interest, were defined and represented as the heuristic stones, to capture users diversified intentions. And a heuristic mechanism was developed to generate the associative ripples, which can aggregate and integrate the relevant stream data together based on the heuristic stones in an associative way. A scenario has been discussed to demonstrate how to utilize the associative information to benefit the enrichment of information seeking process.
As for the individual behavior analysis aspect, two types of information behaviors, the influencing behavior and influenced behavior, have been introduced and defined in order to detect the influence among users interactional behaviors, which can be utilized to refine the users social relationships, and benefit the
information and knowledge delivery during their interaction processes. On the other hand, to model users sequential behaviors, a formal description was given to represent users action behaviors in the task-oriented processes. Furthermore, an analysis method has been proposed to model and discover the action patterns based on the calculation of an individual user s sequential behaviors toward a certain purpose, which can be further employed to analyze the behavioral similarities among a group of users.
![Figure 3-1 Graph Model for Stream Data [6]](https://thumb-ap.123doks.com/thumbv2/123deta/9889787.1909234/35.892.228.677.765.1102/figure-graph-model-for-stream-data.webp)
![Figure 3-2 Image of Organization Process of Stream Data [56]](https://thumb-ap.123doks.com/thumbv2/123deta/9889787.1909234/39.892.228.672.588.861/figure-image-organization-process-stream-data.webp)
![Figure 3-4 Generation of Associative Ripples [6]](https://thumb-ap.123doks.com/thumbv2/123deta/9889787.1909234/43.892.242.644.234.543/figure-generation-of-associative-ripples.webp)
![Figure 3-6 The Scenario of Enhanced Information Seeking [6]](https://thumb-ap.123doks.com/thumbv2/123deta/9889787.1909234/46.892.226.666.117.447/figure-scenario-enhanced-information-seeking.webp)