What needs to be done of personal income tax of Japan?
A perspective for reform under deflation and aging population
*Eiji Tajika
Professor, Faculty of Economics, Seijo University
Hiroyuki Yashio
Professor, Faculty of Economics, Kyoto Sangyo University
Abstract
The purpose of this paper is to study the problems and reforms of personal income tax in consideration of the current status of the economy, fiscal position and social security of Japan remaining under prolonged deflation since the collapse of asset bubbles. One prominent feature of the Japanese economy in deflation is that while companies have continued to secure profits, employee income has kept on dropping due to wage cuts and a shift in employment arrangements from regular employment to non-regular employment. As a result, a vicious circle of slumping domestic demand escalating deflation has arisen. In the meantime, the government has supported the Japanese economy through fiscal expansion. Fiscal expansion has shifted from public investment to social security expenditures, so the growth in social security expenditures has continued unchecked amid the ongoing aging of society.
Under these circumstances, the generational gap in the tax and social security burdens has been expanding. This paper paid attention to the current situation where the social insurance payments burden has become heavier than the tax burden for younger people with low income. As a reform measure to correct this problem, the paper first called for integrating tax and social security premium burdens into a widely defined income tax burden and for introducing tax credits to lessen the social insurance premium burden that cannot be mitigated through income deduction. Second, the paper argues that in order to finance the tax credit, it is necessary to require people with high income to bear a heavier burden than now by cutting income tax deductions and expanding the tax base, instead of raising the top marginal tax rate, which is currently 55%, including national and local taxes.
Third, the paper argues that it is necessary to reform the deductions for social-insurance premiums and public pension. Taking into consideration the feasibility of the reform, the paper argues that it is urgent to abolish the public pension deduction (for calculating income for taxation) for correcting the present inequality of burden among generations and reducing the tax burden on elderly low-income earners.
Keywords: deflationary economy, personal income tax, social insurance premiums, tax credit, public pension deduction
JEL Classification: H24, H61, H62
Policy Research Institute, Ministry of Finance, Japan, Public Policy Review, Vol.14, No.2, March 2018 217
I. Introduction
Since the collapse of asset bubbles, the Japanese economy has remained in deflation, with economic globalization making progress against the backdrop of the yen’s appreciation.
Japanese companies’ strategies under deflation have included cost reduction for securing profit. In cost cutting efforts, they have first implemented employment adjustment and wage cuts. In the adjustment, regular employees for whom employers pay high fixed costs including social insurance premiums have been replaced by non-regular employees, leading to more unstableemployment. At the same time, domestic labor has been replaced by overseas labor amid companies’ overseas expansion, increasing downward pressure on wages.
Such situation has been prolonged under deflation. Stagnating wages have led domestic demand to shrink, prompting companies to further cut wages to secure profit. Ironically, however, people in the deflationary economy have felt rather comfortable. For aged people whose pension and assets can keeptheir real value in the absence of price hikes, deflation means a fall in their costs of living and is not necessarily bad. Amid protracted deflation, companies have found ways to secure profit, while unable to continue their dependence on cost cuts forever. Most seriously affected by deflation are working people, particularly young workers. The decline in costs of livinghas managed to support the livelihood of young workers.
In this way, deflation amounts to hypothermia of the Japanese economy. The economy in prolonged deflation gets used to deflation, loses its vitality and has growing difficulties in recovering the vitality. Overcoming deflation is turning out to be a top priority for Japan. The Bank of Japan’s “bold monetary easing” to set a target of a 2% hike in consumer prices and continue buying public bonds until the achievement of the target has been devised as part of an emergency economic policy. In addition to the so-called quantitative easing, the Bank of Japan has imposed a negative interest rate on financial institutions’ deposits at the central bank in a bid to promote their outflow into the market. Quantitative monetary easing and negative interest rates can be expected to induce industrial and residential investment and eventually correct the yen’s appreciation to stimulate export-oriented demand. However, monetary policy is nothing more than a means to guide the real economy. In the face of the stagnant world economy, it is difficult to place great hopes on the effect of monetary policy.
What are problems in Japan’s tax system in the deflationary economy? How should the tax system be reformed to addressthe problems? From the viewpoint of overcoming hypothermia, the corporation tax should be called into question and reduced. Instead of cutting the corporation tax unilaterally, however, the government must secure adequate tax on income from overseas expansion.
As for the personal income tax, however, the problem is that the burden of social insurance premiums on wages stagnating under protracted deflation is growing in line with the aging of population. Japan must prevent tax and social security systems from leading deflation to further deepen. While reforming the social security system and securing financial resources, the government must boldly lower the burden on working people, particularly young low-
218 E Tajika, H Yashio / Public Policy Review
income workers. The key here is integrating tax and social security premium burdens. Another problem is that consumption tax revenues are earmarked for pension, healthcare, long- termlong-term care and child care. If it is impossible for consumption tax revenues alone to cover the four growing expenditures, the social security system may have to be reformed to meet the limited tax sources.
This paper takes up personal income tax based on the reform of redistribution policy. The reform has been required because the social security burden on working people including low-income workers has increased due to the aging population while wages have remained stagnant under prolonged deflation, as described above. This paper seeks to illustrate the personal income tax problems and provide the ways for reform. Personal income tax here covers the national income tax and the local individual inhabitant tax.
In the following, the paper first discusses the history and present situation of Japan’s economy and fiscal position after the collapse of asset bubbles. Since the collapse, fiscal spending has played a great role in supporting the economy. However, fiscal conditions have deteriorated, with public debt being two times as much as Japan’s gross domestic product.
The paper indicates that fiscal expansion since the collapse of asset bubbles has made a transition from public investment in the form of local government expenditure expansion to transferable spending to cover the burden on social security beneficiaries. Second, the paper clarifies the realities of public expenditures on social security and a mechanism for the expenditure’s growth. The paper indicates the problem is that the government has been committed to to paying a certain share of social security benefits and continued to do so, instead of using public expenditures only to cover shortages in financial resources for social security benefits.
The third issue represents personal income tax problems based on the above. While the social insurance premium burden as financial resources supporting social security has already increased, it is difficult for the government to continue depending on deficit-financing government bonds for covering public expenditures on social security. Social insurance premiums must cover social security benefits. It is important to simultaneously think about personal tax and social insurance premium burdens. Particularly, the problem is that the social insurance premium burden growing on the aging population has shifted to young low- income workers whose wages have remained stagnant in the deflationary economy. The paper clarifies the realities of the personal income tax and social insurance premium burdens and discusses the need and way to reduce the burdens on young low-income workers.
II. Fiscal Problems
II-1. Economic growth and distribution
The above argued that wages fail to grow while companies attempt to secure profit amid deepening deflation. Here, the Cabinet Office’s final National Accounts for FY2013 (flow), known as Japan’s GDP statistics, is used to review the realities of the economy. It must be
Policy Research Institute, Ministry of Finance, Japan, Public Policy Review, Vol.14, No.2, March 2018 219
noted that the latest final data available at present are for FY2013. Data for FY2014 are preliminary. From FY2013 to FY2014, nominal GDP grew 1.6%. On a real basis, however, GDP shrank 0.9%. Figure 1-1 indicates Japan’s annual nominal and real GDP changes, or growth rates. In all the years listed in the figure, excluding FY1995-97, nominal growth rates slipped below real growth rates. Their gap represents the GDP deflator, a price index for GDP. As shown in Figure 1-2, the GDP deflator was negative in all the years other than FY1997, indicating the Japanese economy remained in deflation in the years. The GDP deflator came to a positive 2.5% for FY2014 due to an increase of the consumption tax rate from 5% to 8% in April 2014, meaning that deflation did not necessarily ended in the year.
Figure 1-1 Annual changes in nominal and real GDP (%)
remained stagnant in the deflationary economy. The paper clarifies the realities of the personal income tax and social insurance premium burdens and discusses the need and way to reduce the burdens on young lowincome workers.
II.Fiscal Problems II1 Economic growth and distribution
The above argued that wages fail to grow while companies attempt to secure profit amid deepening deflation. Here, the Cabinet Office’s final National Accounts for FY2013 (flow), known as Japan’s GDP statistics, is used to review the realities of the economy. It must be noted that the latest final data available at present are for FY2013. Data for FY2014 are preliminary. From FY2013 to FY2014, nominal GDP grew 1.6%. On a real basis, however, GDP shrank 0.9%. Figure 11 indicates Japan’s annual nominal and real GDP changes, or growth rates.
In all the years listed in the figure, excluding FY199597, nominal growth rates slipped below real growth rates.
Their gap represents the GDP deflator, a price index for GDP. As shown in Figure 12, the GDP deflator was negative in all the years other than FY1997, indicating the Japanese economy remained in deflation in the years.
The GDP deflator came to a positive 2.5% for FY2014 due to an increase of the consumption tax rate from 5% to 8% in April 2014, meaning that deflation did not necessarily ended in the year.
What was workers’ and companies’ income under deflation? Table 11 shows the trend and breakdown of national income, or distributive income determined by subtracting indirect tax and depreciation cost from GDP.
Over about 20 years from FY1995, nominal national income decreased from 370.8 trillion yen to 362.1 trillion yen in FY2013. Compensation of employees, which represents what is referred to as wages in this paper, decreased 22 trillion yen from 270.2 trillion yen to 248.3 trillion yen over the period. Property income also declined, reflecting low interest rates. In contrast, entrepreneurial income increased sharply on a total basis and on a private corporation basis. Private corporations’ income expanded from 34.6 trillion yen in FY1995 to 51.9 trillion yen in FY2013.
While overall national income declined, entrepreneurial income increased faster than wages declined.
Figure 1-2 Annual GDP deflator changes (%)
Figure 12 Annual GDP deflator changes (%)(Source) Department of National Accounts, Economic and Social Research Institute, Cabinet Office, “National Accounts for FY2013 (Flow), Points” December 25, 2014
Table 12 shows each income category’s share of national income, representing a distribution rate. The so
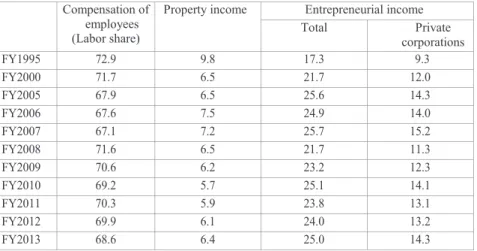
called labor share is the proportion of employees’compensation to national income. Over the period from FY1995 to FY2013 subject to the analysis, the labor share dropped from 72.9% to 68.6% while the entrepreneurial income share rose substantially from 17.3% to 25.0%. These data represent the true face of the deflationary economy.
Table 11 National income and its breakdown
In trillions of yen
National
income
Compensation of employees
Property income
Entrepreneurial income Total
Private
corporations 業
FY1995 370.8 270.2 36.5 64.1 34.6
FY2000 375.2 269.2 24.5 81.5 45.0
FY2005 374.1 254.1 24.4 95.6 53.6
FY2006 378.2 255.7 28.4 94.1 52.8
FY2007 381.2 255.6 27.6 98.0 57.8
FY2008 355.0 254.3 23.1 77.1 40.1
FY2009 344.4 243.0 21.5 79.9 42.2
FY2010 352.7 244.0 20.2 88.6 49.9
FY2011 349.6 245.6 20.7 83.3 45.7
FY2012 352.0 245.9 21.5 84.6 46.6
FY2013 362.1 248.3 23.1 90.7 51.9
(Source) Department of National Accounts, Economic and Social Research Institute, Cabinet Office, “National Accounts for FY2013 (Flow), Points” December 25, 2014
220 E Tajika, H Yashio / Public Policy Review
What was workers’ and companies’ income under deflation? Table 1-1 shows the trend and breakdown of national income, or distributive income determined by subtracting indirect tax and depreciation cost from GDP. Over about 20 years from FY1995, nominal national income decreased from 370.8 trillion yen to 362.1 trillion yen in FY2013. Compensation of employees, which represents what is referred to as wages in this paper, decreased 22 trillion yen from 270.2 trillion yen to 248.3 trillion yen over the period. Property income also declined, reflecting low interest rates. In contrast, entrepreneurial income increased sharply on a total basis and on a private corporation basis. Private corporations’ income expanded from 34.6 trillion yen in FY1995 to 51.9 trillion yen in FY2013. While overall national
Table 1-1 National income and its breakdown
Figure 12 Annual GDP deflator changes (%)
(Source) Department of National Accounts, Economic and Social Research Institute, Cabinet Office, “National Accounts for FY2013 (Flow), Points” December 25, 2014
Table 12 shows each income category’s share of national income, representing a distribution rate. The so
called labor share is the proportion of employees’compensation to national income. Over the period from FY1995 to FY2013 subject to the analysis, the labor share dropped from 72.9% to 68.6% while the entrepreneurial income share rose substantially from 17.3% to 25.0%. These data represent the true face of the deflationary economy.
In trillions of yen
National
income
Compensation of employees
Property income
Entrepreneurial income
Total
Private
corporations 業
FY1995 370.8 270.2 36.5 64.1 34.6
FY2000 375.2 269.2 24.5 81.5 45.0
FY2005 374.1 254.1 24.4 95.6 53.6
FY2006 378.2 255.7 28.4 94.1 52.8
FY2007 381.2 255.6 27.6 98.0 57.8
FY2008 355.0 254.3 23.1 77.1 40.1
FY2009 344.4 243.0 21.5 79.9 42.2
FY2010 352.7 244.0 20.2 88.6 49.9
FY2011 349.6 245.6 20.7 83.3 45.7
FY2012 352.0 245.9 21.5 84.6 46.6
FY2013 362.1 248.3 23.1 90.7 51.9
Table 1-2 National income shares for compensation of employees (labor share), property income and entrepreneurial income (%)
Table 12 National income shares for compensation of employees (labor share), property income and entrepreneurial income (%)
Compensation of
employees (Labor share)
Property income Entrepreneurial income
Total Private
corporations
FY1995 72.9 9.8 17.3 9.3
FY2000 71.7 6.5 21.7 12.0
FY2005 67.9 6.5 25.6 14.3
FY2006 67.6 7.5 24.9 14.0
FY2007 67.1 7.2 25.7 15.2
FY2008 71.6 6.5 21.7 11.3
FY2009 70.6 6.2 23.2 12.3
FY2010 69.2 5.7 25.1 14.1
FY2011 70.3 5.9 23.8 13.1
FY2012 69.9 6.1 24.0 13.2
FY2013 68.6 6.4 25.0 14.3
II2 Financial surplus or deficit for households, enterprises and government
While compensation of employees accounted for most of household income declined, entrepreneurial income increased, as noted above. Let us turn to the demand side changes to search causes for deflation. Here, a financial surplus or deficit position is checked for the household, corporation and government sectors to find causes for GDP stagnation. If households save consumption and increase savings to protect their livelihood, their financial surplus (lending) increases to lower GDP growth.
Figure 2 shows the household savings rate. Over the period from FY1995 to FY2013 subject to the analysis, the rate declined substantially. The household savings rate fell sharply after increasing for several years from FY2008, the year that saw the Lehman Shock. The substantial decline is apparently attributable to an income drop and a rise in the propensity to consume amid expansion in elderly people’s share of population. In FY2013, the household savings rate fell to a negative 1.3%. These data apparently indicate that household consumption shortages are not responsible for deflation.
Figure 3 shows financial surplus or deficit for corporations (nonfinancial and financial) and the general government sector (covering national and local governments, and social security funds) as well as households. The overseas sector covers the world other than Japan. The overseas sector’s financial deficit (net borrowings) means that Japan has net loans to the rest of the world. The figure provides some interesting findings.
The household sector substantially reduced its role as lender in line with the decline in the savings rate. As funds flow into and out of financial corporations, their financial position does not influence GDP representing the real economy. Influencing GDP are nonfinancial corporations including manufacturers and service providers. Non
financial corporations had supported the Japanese economy’s growth through their robust investment. In a change to which attention must be paid in regard to deflation, nonfinancial corporations made a transition from borrowers to lenders around FY1998. Under deflation, nonfinancial corporations secured profit by cutting costs and saved domestic investment to create surplus funds as financial assets for holdings. Nonfinancial corporations are no longer driving the Japanese economy through investment.
At the same time as the corporation sector made a transition to a financial surplus position, the general government sector became a fund borrower. Since then, the corporation sector has remained in a financial surplus position in contrast to a financial deficit position for the general government sector. This means that the general government sector has covered a demand shortage at the corporation sector. In macroeconomic terms, government spending has supported the economy in deflation. In the meantime, the overseas sector has retained a financial deficit position. Japan as a whole has remained in a financial surplus position, providing net loans to the rest of the world. However, the financial surplus position has weakened substantially over recent years. A factor behind the weakening financial surplus position is that Japan has had no choice but to increase dependence on fossil fuel imports for power generation as the Great East Japan Earthquake has led nuclear power plants to be shut down.
Even without this factor, however, Japan’s financial surplus position has weakened.
(Source) Same as for Figure 1
Policy Research Institute, Ministry of Finance, Japan, Public Policy Review, Vol.14, No.2, March 2018 221
income declined, entrepreneurial income increased faster than wages declined.
Table 1-2 shows each income category’s share of national income, representing a distribution rate. The so-called labor share is the proportion of employees’compensation to national income. Over the period from FY1995 to FY2013 subject to the analysis, the labor share dropped from 72.9% to 68.6% while the entrepreneurial income share rose substantially from 17.3% to 25.0%. These data represent the true face of the deflationary economy.
II-2. Financial surplus or deficit for households, enterprises and government
While compensation of employees accounted for most of household income declined, entrepreneurial income increased, as noted above. Let us turn to the demand side changes to search causes for deflation. Here, a financial surplus or deficit position is checked for the household, corporation and government sectors to find causes for GDP stagnation. If households save consumption and increase savings to protect their livelihood, their financial surplus (lending) increases to lower GDP growth.
Figure 2 shows the household savings rate. Over the period from FY1995 to FY2013 subject to the analysis, the rate declined substantially. The household savings rate fell sharply after increasing for several years from FY2008, the year that saw the Lehman Shock. The substantial decline is apparently attributable to an income drop and a rise in the propensity to consume amid expansion in elderly people’s share of population. In FY2013, the household savings rate fell to a negative 1.3%. These data apparently indicate that household consumption shortages are not responsible for deflation.
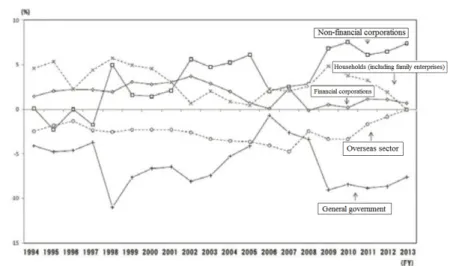
Figure 3 shows financial surplus or deficit for corporations (non-financial and financial) and the general government sector (covering national and local governments, and social security funds) as well as households. The overseas sector covers the world other than Japan.
The overseas sector’s financial deficit (net borrowings) means that Japan has net loans to the rest of the world. The figure provides some interesting findings.
The household sector substantially reduced its role as lender in line with the decline in the savings rate. As funds flow into and out of financial corporations, their financial position does not influence GDP representing the real economy. Influencing GDP are non-financial corporations including manufacturers and service providers. Non-financial corporations had supported the Japanese economy’s growth through their robust investment. In a change to which attention must be paid in regard to deflation, non-financial corporations made a transition from borrowers to lenders around FY1998. Under deflation, non-financial corporations secured profit by cutting costs and saved domestic investment to create surplus funds as financial assets for holdings. Non-financial corporations are no longer driving the Japanese economy through investment.
At the same time as the corporation sector made a transition to a financial surplus position, the general government sector became a fund borrower. Since then, the corporation sector has remained in a financial surplus position in contrast to a financial deficit position for the general government sector. This means that the general government sector has covered a
222 E Tajika, H Yashio / Public Policy Review
demand shortage at the corporation sector. In macroeconomic terms, government spending has supported the economy in deflation. In the meantime, the overseas sector has retained a financial deficit position. Japan as a whole has remained in a financial surplus position, providing net loans to the rest of the world. However, the financial surplus position has weakened substantially over recent years. A factor behind the weakening financial surplus position is that Japan has had no choice but to increase dependence on fossil fuel imports for power generation as the Great East Japan Earthquake has led nuclear power plants to be shut down. Even without this factor, however, Japan’s financial surplus position has weakened.
Figure 2 Household savings rate trend
Figure 2 Household savings rate trend
government primary balance’s ratio to GDP.
(Source) Same as for Figure 1
Figure 3 Net loans (+) and borrowings (-) by sector as percent of GDP
as percent of GDP
Same as for Figure 1
government primary balance’s ratio to GDP.
(Source) Same as for Figure 1
Policy Research Institute, Ministry of Finance, Japan, Public Policy Review, Vol.14, No.2, March 2018 223
The above indicates that the general government sector drove the economy plagued with deflation, playing a key role in creating demand. However, the cost for the government sector was huge. Figure 4 shows the general government primary balance’s ratio to GDP. Over the period subject to the analysis, the primary budget balance remained in deficit. Recently, an annual primary balance deficit amounted to nearly 7% of GDP. Clearly, the national government accounted for most of the deficit. The annual budget deficit worked to expand outstanding general government debt sharply to 201% of GDP in FY2013.
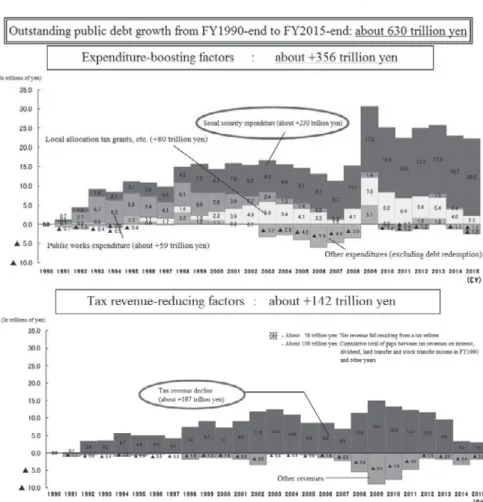
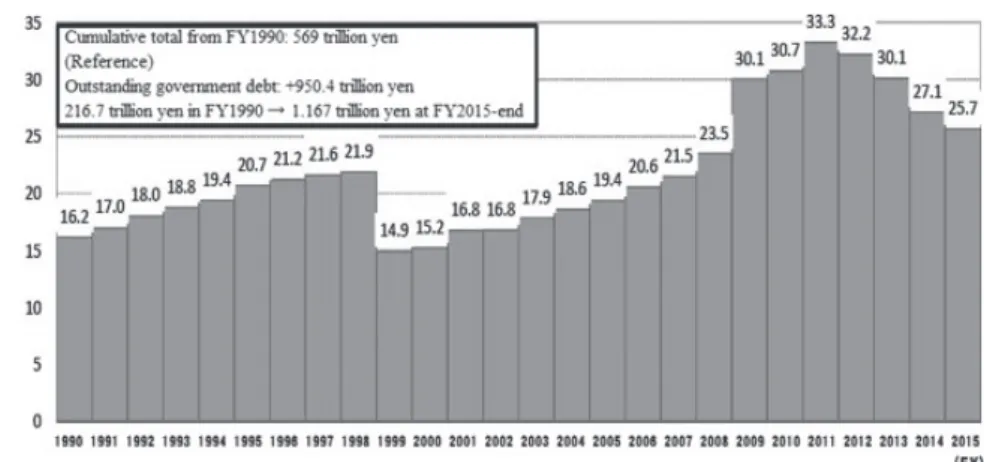
Figure 5 shows factors behind outstanding general government debt growth. From FY1990 to FY2015, outstanding public debt increased 630 trillion yen. Of the increase, spending growth accounted for 356 trillion yen and tax and other revenue falls for 142 trillion yen. Tax revenue decline as well as spending growth was substantial due to tax cuts for boosting the economy and falling tax revenue under deflation.
The financial surplus or deficit positions for economic sectors pointed out above indicate that government spending supported the economy from the demand side under deflation.
Figure 5 shows details of the situation. From around FY1992 just after the collapse of asset bubbles to FY1999 when Japan was shaken by the Asian economic crisis and the disposal of non-performing loans, public investment played the main role in expanding government spending. Public investment was designed for boosting the economy. Later, social security expenditures expanded. Local allocation tax grants also increased to cover local government deficits. However, social security expenditure growth was dominant.
While government spending drove the deflationary economy, government spending priority shifted from public investment for boosting the economy to tax allocation to local governments and social security as reviewed above. Social security expenditures mean that the government shoulders the cost of services to citizens, including pension, healthcare and long-term care. While public bonds continued to be issued during the shift, those bonds
Figure 4 General government primary balance breakdown (as percentage of GDP)
4 General government primary balance breakdown (as percentage of GDP)
Same as for Figure 1
companies’ financial surplus to (Source) Same as for Figure 1
224 E Tajika, H Yashio / Public Policy Review
shifted from construction bonds backed by public capital formation to deficit-financing bonds to cover annual current account revenue shortfalls.
Details of government spending backed by growing public debt issues must be called into question now. In local finance, a special addition made to local allocation tax grants under an emergency economic stimulus package in response to the Lehman Shock has been maintained.
The government covers most of social security expenditures by passing the cost of current services on to the future. Such practice is problematic from the viewpoint of intergenerational equity. Although government spending has surely played a key role in supporting the deflationary economy, it is not sustainable to continue expanding public debt at a time when outstanding general government debt exceeds 200% of GDP. Government spending must be reformed now. If the reduction of deficit-financing bond issues inevitably causes the burden to increase, the problem will be linked to the tax system.
Figure 5 Factors behind growth in outstanding public debt
(Note) In addition to the abovecited factors behind outstanding public debt growth, there are the revenue
outlay gap of 71 trillion yen in FY1990 and the succession of 61 trillion yen in debt from the defunct Japanese National Railways.
(Source) Ministry of Finance, “Japan’s Fiscal Data,” September 2015
III. Why do social security expenditures continue increasing?
III1 Social security expenditures and their financial resources
It has been noted that Japan’s government debt stems primarily from social security expenditures. Here, social security expenditure trends and relevant financial resources are checked first. Later, reasons for social security expenditure growth are clarified, based on healthcare and longterm longterm care insurance systems.
Japan’s social security comprises pension, healthcare, longterm care and employment based on social insurance systems, and livelihood aid and livelihood subsidies financed by tax. Figure 6 shows the trends of social security benefits and insurance premiums. Social security benefits increased substantially in about 20 years from 47.2 trillion yen in FY1990 to 108.6 trillion yen in FY2012. They included 56.2 trillion yen for pensions, 37.5 trillion yen for healthcare and 9.7 trillion yen for longterm care. The three components totaled 103.4 trillion yen accounting for most of social security benefits.
In the meantime, social insurance premiums grew from 39.5 trillion yen to only 61.4 trillion yen, leading a gap between social security benefits and premiums to expand from 7.7 trillion yen to 47.2 trillion yen. The gap is mostly covered by national and local governments expenditures (public expenditures). Of the total gap, the national government covered 31.8 trillion yen and local governments 12.8 trillion yen. Figure 7 shows a breakdown of the national government’s social security expenditures. In FY2015, the national government provided 11.2 trillion yen for pensions, 11.4 trillion yen for healthcare and 2.7 trillion yen for longterm care. It must be noted that the government also provided 150 billion yen for employment insurance. Figure 8 shows the (Note) In addition to the above-cited factors behind outstanding public debt growth, there are the revenue-outlay gap of 71 trillion yen in FY1990 and the succession of 61 trillion yen in debt from the defunct Japanese National Railways.
(Source) Ministry of Finance, “Japan’s Fiscal Data,” September 2015
Policy Research Institute, Ministry of Finance, Japan, Public Policy Review, Vol.14, No.2, March 2018 225
For the macroeconomic purpose of overcoming deflation, meanwhile, domestic demand must be stimulated. Instead of forcing government spending to play a role in stimulating domestic demand, the government should promote effective use of surplus funds reserved at companies now serving as lenders and lead them to raise return on equity, wages and dividends to more effectively overcome deflation. Wolf (2015) compared a saving glut at companies in Japan with those in other developed countries and called for making effective use of internal reserves at companies through such measures as taxation on such reserves.
Smithers (2014) attributed Japanese companies’ financial surplus to higher depreciation costs than indicated by decelerating investment and called for cutting depreciation costs boldly to increase their income for raising dividends and wages. Both paid attention to the corporation side in considering how to stimulate demand in the Japanese economy and are useful for considering future policies in Japan.
III. Why do social security expenditures continue increasing?
III-1. Social security expenditures and their financial resources
It has been noted that Japan’s government debt stems primarily from social security expenditures. Here, social security expenditure trends and relevant financial resources are checked first. Later, reasons for social security expenditure growth are clarified, based on healthcare and long-term long-term care insurance systems.
Japan’s social security comprises pension, healthcare, long-term care and employment based on social insurance systems, and livelihood aid and livelihood subsidies financed by tax. Figure 6 shows the trends of social security benefits and insurance premiums. Social security benefits increased substantially in about 20 years from 47.2 trillion yen in FY1990 to 108.6 trillion yen in FY2012. They included 56.2 trillion yen for pensions, 37.5 trillion yen for healthcare and 9.7 trillion yen for long-term care. The three components totaled 103.4 trillion yen accounting for most of social security benefits.
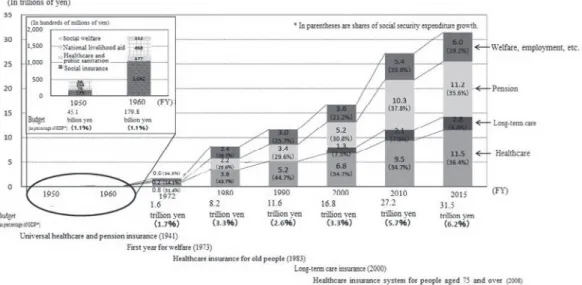
In the meantime, social insurance premiums grew from 39.5 trillion yen to only 61.4 trillion yen, leading a gap between social security benefits and premiums to expand from 7.7 trillion yen to 47.2 trillion yen. The gap is mostly covered by national and local governments expenditures (public expenditures). Of the total gap, the national government covered 31.8 trillion yen and local governments 12.8 trillion yen. Figure 7 shows a breakdown of the national government’s social security expenditures. In FY2015, the national government provided 11.2 trillion yen for pensions, 11.4 trillion yen for healthcare and 2.7 trillion yen for long-term care. It must be noted that the government also provided 150 billion yen for employment insurance. Figure 8 shows the trend of the national government’s social security expenditures. Those expenditures increased from 11.6 trillion yen in FY1990 to 31.5 trillion yen in FY2015. Their share of the national government budget rose sharply from 2.6% to 6.2%.
What were the financial resources for growing social security expenditures? To find the
226 E Tajika, H Yashio / Public Policy Review
Figure 6 Social security benefits and their financial resources
trend of the national government’s social security expenditures. Those expenditures increased from 11.6 trillion yen in FY1990 to 31.5 trillion yen in FY2015. Their share of the national government budget rose sharply from 2.6% to 6.2%.
(Source) Ministry of Finance, “Japan’s Fiscal Data,” September 2015. Original data are from National Institute of Population and Social Security Research, “The Cost of Social Security in Japan,” and the Ministry of Health, Labor and Welfare budget.
Figure 7 Social security expenditures in national budget (FY2014 and FY2015)
(Source) Ministry of Finance, Fiscal System Council Fiscal System Subcommittee documents, April 2015 What were the financial resources for growing social security expenditures? To find the answer to the question, the extent to which income, corporation and consumption tax revenues as mainstay national revenue sources can cover social security expenditures is considered. As shown in Figure 9, income tax revenue is estimated at 16.4 trillion yen for FY2015, corporation tax revenue at 10.9 trillion yen and consumption tax revenue at 17.1 trillion yen. Of their total, about onethird is statutorily earmarked for local allocation tax grants.
(Source) Ministry of Finance, “Japan’s Fiscal Data,” September 2015. Original data are from National Institute of Population and Social Security Research, “The Cost of Social Security in Japan,” and the Ministry of Health, Labor and Welfare budget.
Figure 7 Social security expenditures in national budget (FY2014 and FY2015)
trend of the national government’s social security expenditures. Those expenditures increased from 11.6 trillion yen in FY1990 to 31.5 trillion yen in FY2015. Their share of the national government budget rose sharply from 2.6% to 6.2%.
Figure 6 Social security benefits and their financial resources
(Source) Ministry of Finance, “Japan’s Fiscal Data,” September 2015. Original data are from National Institute of Population and Social Security Research, “The Cost of Social Security in Japan,” and the Ministry of Health, Labor and Welfare budget.
Figure 7 Social security expenditures in national budget (FY2014 and FY2015)
(Source) Ministry of Finance, Fiscal System Council Fiscal System Subcommittee documents, April 2015 What were the financial resources for growing social security expenditures? To find the answer to the question, the extent to which income, corporation and consumption tax revenues as mainstay national revenue sources can cover social security expenditures is considered. As shown in Figure 9, income tax revenue is estimated at 16.4 trillion yen for FY2015, corporation tax revenue at 10.9 trillion yen and consumption tax revenue at 17.1 trillion yen. Of their total, about onethird is statutorily earmarked for local allocation tax grants.
(Source) Ministry of Finance, Fiscal System Council Fiscal System Subcommittee documents, April 2015
Policy Research Institute, Ministry of Finance, Japan, Public Policy Review, Vol.14, No.2, March 2018 227
answer to the question, the extent to which income, corporation and consumption tax revenues as mainstay national revenue sources can cover social security expenditures is considered. As shown in Figure 9, income tax revenue is estimated at 16.4 trillion yen for FY2015, corporation tax revenue at 10.9 trillion yen and consumption tax revenue at 17.1 trillion yen.
Of their total, about one-third is statutorily earmarked for local allocation tax grants. The three tax revenues are thus estimated to provide nearly 30 trillion for the national government.
Given social security expenditures at 31.5 trillion yen, income, corporation and consumption tax revenues available for the national government fall short of covering all social security expenditures.
The government also appropriated5.9 trillion yen for public works, 5.3 trillion yen for education and science, 4.9 trillion yen for national defense and 9.5 trillion yen for others including agriculture, forestry and fisheries, small and medium enterprises, and official development assistance. These expenditures total 25.6 trillion yen. Tax revenues fall far short of covering national government expenditures in Japan. This fact is behind primary budget balance deficits shown in Figure 4. Actually, deficit-financing government bond issues totaled 30.9 trillion yen in FY2015.
The extent to which consumption tax revenue designated for social security can cover public social security expenditures is checked here to clarify the problem of financial resources for social security. As one percentage point of local consumption tax has been designated as financial resources for local governments since before the tax and social security reform, the extent to which national and local consumption tax revenue excluding this portion can cover public (national and local government) social security expenditures is considered.
Figure 8 Trend and breakdown of national social security expenditures
The three tax revenues are thus estimated to provide nearly 30 trillion for the national government. Given social security expenditures at 31.5 trillion yen, income, corporation and consumption tax revenues available for the national government fall short of covering all social security expenditures.
The government also appropriated5.9 trillion yen for public works, 5.3 trillion yen for education and science, 4.9 trillion yen for national defense and 9.5 trillion yen for others including agriculture, forestry and fisheries, small and medium enterprises, and official development assistance. These expenditures total 25.6 trillion yen. Tax revenues fall far short of covering national government expenditures in Japan. This fact is behind primary budget balance deficits shown in Figure 4. Actually, deficitfinancing government bond issues totaled 30.9 trillion yen in FY2015.
The extent to which consumption tax revenue designated for social security can cover public social security expenditures is checked here to clarify the problem of financial resources for social security. As one percentage point of local consumption tax has been designated as financial resources for local governments since before the tax and social security reform, the extent to which national and local consumption tax revenue excluding this portion can cover public (national and local government) social security expenditures is considered.
The extent is shown in Figure 10. Consumption tax revenue fell 25.7 trillion yen short of social security expenditures in FY2015, although the shortfall narrowed slightly reflecting a consumption tax increase in April 2014. The shortfall amounts to more than 10 percentage points on a consumption tax rate basis. This rough estimate indicates how difficult it is to raise financial resources for national and local social security expenditures exceeding 40 trillion yen.
Figure 8 Trend and breakdown of national social security expenditures
(Source) Ministry of Finance, Fiscal System Council Fiscal System Subcommittee documents, September 2015
(Source) Ministry of Finance, Fiscal System Council Fiscal System Subcommittee documents, September 2015
228 E Tajika, H Yashio / Public Policy Review
The extent is shown in Figure 10. Consumption tax revenue fell 25.7 trillion yen short of social security expenditures in FY2015, although the shortfall narrowed slightly reflecting a consumption tax increase in April 2014. The shortfall amounts to more than 10 percentage points on a consumption tax rate basis. This rough estimate indicates how difficult it is to raise financial resources for national and local social security expenditures exceeding 40 trillion yen.
Figure 9 National general account revenues and their mix (FY2015)
Figure 9 National general account revenues and their mix (FY2015)
(Source) Ministry of Finance, “Japan’s Fiscal Data,” September 2015
Figure 10 Gap between public national and local public social security expenditures and consumption tax revenue (excluding a 1% portion for local governments)
(In trillions of yen)
(Source) Ministry of Finance, Fiscal System Council Fiscal System Subcommittee documents, September 2015 III2 Reasons for growing social security expenditures
As social security benefit growth has forced public social security expenditures to expand, it has become difficult to secure financial resources for such expenditures, as reviewed above. The social security budget includes the socalled natural increase of nearly 1 trillion yen per year stemming from the aging of population and the advancement of medical treatment techniques. How to lower the natural increase is one of the keys to fiscal reconstruction. The Plan for Economic and Fiscal Revitalization in the Basic Policies for Economic and Fiscal Management and Reform 2015 called for continuing the rationalization of livelihood subsidies, the revision of drug prices and longterm care fees and other measures that worked to limit the annual natural increase to around 500 billion yen in the past three years.
Why have social security expenditures continued to increase? As social security benefits increase, a rise in public social security expenditures is taken as natural. However, such interpretation is unobvious. An increase in (Source) Ministry of Finance, “Japan’s Fiscal Data,” September 2015
Figure 10 Gap between public national and local public social security expenditures and consumption tax revenue (excluding a 1% portion for local governments)
Figure 9 National general account revenues and their mix (FY2015)
(Source) Ministry of Finance, “Japan’s Fiscal Data,” September 2015
Figure 10 Gap between public national and local public social security expenditures and consumption tax revenue (excluding a 1% portion for local governments)
(In trillions of yen)
(Source) Ministry of Finance, Fiscal System Council Fiscal System Subcommittee documents, September 2015 III2 Reasons for growing social security expenditures
As social security benefit growth has forced public social security expenditures to expand, it has become difficult to secure financial resources for such expenditures, as reviewed above. The social security budget includes the socalled natural increase of nearly 1 trillion yen per year stemming from the aging of population and the advancement of medical treatment techniques. How to lower the natural increase is one of the keys to fiscal reconstruction. The Plan for Economic and Fiscal Revitalization in the Basic Policies for Economic and Fiscal Management and Reform 2015 called for continuing the rationalization of livelihood subsidies, the revision of drug prices and longterm care fees and other measures that worked to limit the annual natural increase to around 500 billion yen in the past three years.
Why have social security expenditures continued to increase? As social security benefits increase, a rise in public social security expenditures is taken as natural. However, such interpretation is unobvious. An increase in (Source) Ministry of Finance, Fiscal System Council Fiscal System Subcommittee documents, September 2015
Policy Research Institute, Ministry of Finance, Japan, Public Policy Review, Vol.14, No.2, March 2018 229
III-2. Reasons for growing social security expenditures
As social security benefit growth has forced public social security expenditures to expand, it has become difficult to secure financial resources for such expenditures, as reviewed above.
The social security budget includes the so-called natural increase of nearly 1 trillion yen per year stemming from the aging of population and the advancement of medical treatment techniques. How to lower the natural increase is one of the keys to fiscal reconstruction. The Plan for Economic and Fiscal Revitalization in the Basic Policies for Economic and Fiscal Management and Reform 2015 called for continuing the rationalization of livelihood subsidies, the revision of drug prices and long-term care fees and other measures that worked to limit the annual natural increase to around 500 billion yen in the past three years.
Why have social security expenditures continued to increase? As social security benefits increase, a rise in public social security expenditures is taken as natural. However, such interpretation is unobvious. An increase in Japan’s social security expenditures as a percentage of GDP in the past 20 years is compared with such increases in the United States, Germany, the United Kingdom, France and Italy where the population is aging as in Japan. The increase in Japan came to 11.2 percentage points (from 12.8% in FY1995 to 24.0% in FY2013), followed by 5.3 points (from 22.9% to 28.2%) in Italy and lower growth in other foreign countries. Germany posted a decline of 0.6 points (from 26.4% to 25.8%) (Fiscal System Council Fiscal System Subcommittee documents, October 9, 2015).
The relatively higher growth in Japan is attributable to public expenditures’ unique relations with pensions, healthcare and long-term care benefits. Japan not only eases insurance premium burdens on low-income earners but also features public social security expenditures representing the government sector’s guarantee of some portion of benefits for each insurance system. For example, the national government shoulders 50% of basic pensions. Public expenditures on healthcare and long-term care are also fixed at certain portions of benefits and subventions from insurers. As a result, government social security expenditures increase automatically as social security benefits grow.
Public expenditures on pensions expand as benefits increase on a rise in the number of pensioners. Under a pension reform, nevertheless, per capita pension is designed to decline in accordance with the aging of the population and the fall of birthrates, with the maximum premium rate fixed. However, healthcare benefits have been persistently growing in accordance with the aging of population and the advancement of medical treatment techniques. Long-term care benefits are destined to increase as the number of old people aged 75 and more grows.
In this way, social security benefits will continue expanding. As the Japanese social security system designs government expenditures to automatically cover certain portions of social security benefits, it is difficult to control government social security expenditures. In contrast, foreign countries have stricter rules to restrict government expenditures’ coverage of social security benefits, limit benefits to specific tax revenue or cover social security
230 E Tajika, H Yashio / Public Policy Review
benefits with premiums alone without government expenditures in principle. In a typical example, Germany strictly restricts public expenditures’ coverage of healthcare insurance benefits and adopts a full insurance system for long-term care to determine benefits in line with premium income.
In Japan, the government’s commitment to shoulder certain portions of social security benefits lead healthcare and long-term care costs to expand. The government provides expenditures to lower healthcare and long-term care service users’ burden, encouraging citizens to excessively use those services. Given the results of free healthcare services for elderly people in the 1970s and 1980s, such encouragement is plausible. Meanwhile, healthcare and long-term care service providers tend to expand services excessively as subsidies are given to users under systems that differ from pure insurance systems. In this way, Japan has a mechanism for citizens, and doctors and medical institutions to expand costs. As a result, public national and local government expenditures or subsidies are required to meet growing healthcare and long-term care costs that increase based on government expenditures, leading to a vicious circle.
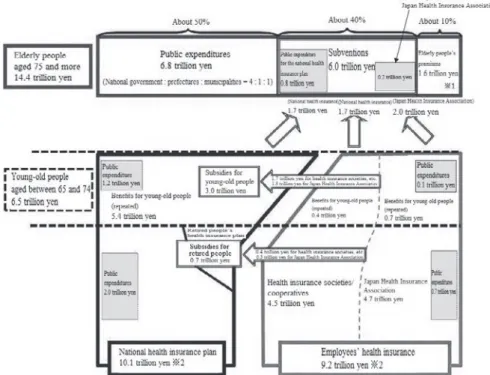
Figure 11 shows financial resources for the healthcare insurance system. The Japanese healthcare insurance system comprises employees’ insurance (provided by healthcare insurance societies and cooperatives, and the Japan Health Insurance Association) and other people’s insurance which is called the national health insurance plan. For people aged between 65 and 74 who are covered by the national health insurance plan, employees’
insurance providers as well as the plan shoulder some costs. Furthermore, people aged 75 and more are covered by a healthcare insurance plan designed for old-old people.
The government covers a fixed share of benefits for each healthcare insurance plan. The national government shoulders 50% of benefits for the national health insurance plan.
Concerning the benefits for the Japan Health Insurance Association plan mainly for small and medium enterprises, the national government provides 16.4%. Under the healthcare insurance plan for old-old people, public expenditures cover 50% of benefits, with 40% provided by subventions from the national health insurance plan and employees’ insurance. The remaining 10% is covered by premiums paid by insured people (the national government eases the premium burden on low-income earners). Furthermore, the national government shoulders the same portions of subventions from the national health insurance plan and employees’
insurance as those of benefits for these insurance plans.
In this way, the national government shoulders some portions of healthcare insurance benefits in a multi-layered manner. As a result, healthcare service users remain unaware of information on healthcare costs. Their healthcare costs are shouldered by their own payment and insurance premiums, and by subsidies from national and local governments, which have difficulties in raising financial resources for such subsidies and have no choice but to issue deficit-financing bonds in a manner to pass the burden on to future generations. Healthcare service users are left uncertain about such mechanism.
Public expenditures also cover some portion of benefits under the long-term care insurance system. Figure 12 shows the financial resources mix for the system. The mix is
Policy Research Institute, Ministry of Finance, Japan, Public Policy Review, Vol.14, No.2, March 2018 231
close to that for the healthcare insurance plan for old-old people. In fact, the long-term care insurance system was launched in FY2000 before the healthcare insurance plan for old-old people was introduced in 2008 in a manner to imitate the financial resources mix for the long-term care system. Of long-term care insurance benefits, 50% is covered by public expenditures and the remainder by insurance premiums. Of the public expenditures, the national government accounts for 50%, prefectural governments for 25% and municipal governments for 25%. Premiums paid by elderly people aged 65 and more, or main users of long-term care services, cover 21% of benefits. Premiums paid by people aged between 40 and 64 cover 29% of benefits through their respective healthcare insurance plans. Based on the long-term care system framework, the healthcare insurance plan for old-old people fixes shares of benefits for public expenditures, subventions and premiums. Both take advantage of public expenditures and subventions to substantially ease the burden on service users.
Figures 13 and 14 show healthcare and long-term care cost trends. National healthcare costs totaled 43 trillion yen on a budget basis in FY2015. Long-term care costs stood at 9.4 trillion yen in FY2013 and are estimated to have reached 10 trillion yen in FY2015 based on
Figure 11 Financial resources mix for healthcare insurance system
and more, or main users of longterm care services, cover 21% of benefits. Premiums paid by people aged between 40 and 64 cover 29% of benefits through their respective healthcare insurance plans. Based on the longterm care system framework, the healthcare insurance plan for oldold people fixes shares of benefits for public expenditures, subventions and premiums. Both take advantage of public expenditures and subventions to substantially ease the burden on service users.
(Source) Ministry of Health, Labor and Welfare, “Japan’s Healthcare Insurance”
Figure 12 Financial resources of the longterm care insurance system
(Source) Ministry of Health, Labor and Welfare, “Present Longterm care Insurance System and Its Future Role,” FY2014
Figures 13 and 14 show healthcare and longterm care cost trends. National healthcare costs totaled 43 trillion yen on a budget basis in FY2015. Longterm care costs stood at 9.4 trillion yen in FY2013 and are estimated to have reached 10 trillion yen in FY2015 based on the past pace of growth. Healthcare costs have increased 23%
(Note) Public expenditures’ shares of insurance benefits or subventions to the healthcare insurance plan for old-old people are as follows: 50% for the national health insurance plan managed by municipal governments, 16.4% for the Japan Health Insurance Association, zero (excluding some share level) for health insurance societies or cooperatives and 50% for the healthcare insurance plan for old-old people.
(Source) Ministry of Health, Labor and Welfare, “Japan’s Healthcare Insurance”
232 E Tajika, H Yashio / Public Policy Review
the past pace of growth. Healthcare costs have increased 2-3% annually. Particularly, healthcare costs for old-old people have risen faster, accounting for 37% of total healthcare costs in FY2015. Long-term care costs have soared even faster than healthcare costs, growing 2.5-fold from 4 trillion yen in the initial year for the long-term care insurance system to FY2015 on an estimated basis.
Behind healthcare and long-term care cost growth have been the aging population, Figure 12 Financial resources of the long-term care insurance system
and more, or main users of longterm care services, cover 21% of benefits. Premiums paid by people aged between 40 and 64 cover 29% of benefits through their respective healthcare insurance plans. Based on the longterm care system framework, the healthcare insurance plan for oldold people fixes shares of benefits for public expenditures, subventions and premiums. Both take advantage of public expenditures and subventions to substantially ease the burden on service users.
Figure 11 Financial resources mix for healthcare insurance system
(Note) Public expenditures’ shares of insurance benefits or subventions to the healthcare insurance plan for oldold people are as follows: 50% for the national health insurance plan managed by municipal governments, 16.4% for the Japan Health Insurance Association, zero (excluding some share level) for health insurance societies or cooperatives and 50% for the healthcare insurance plan for oldold people.
(Source) Ministry of Health, Labor and Welfare, “Japan’s Healthcare Insurance”
Figure 12 Financial resources of the longterm care insurance system
(Source) Ministry of Health, Labor and Welfare, “Present Longterm care Insurance System and Its Future Role,” FY2014
Figures 13 and 14 show healthcare and longterm care cost trends. National healthcare costs totaled 43 trillion yen on a budget basis in FY2015. Longterm care costs stood at 9.4 trillion yen in FY2013 and are estimated to have reached 10 trillion yen in FY2015 based on the past pace of growth. Healthcare costs have increased 23%
(Source) Ministry of Health, Labor and Welfare, “Present Long-term care Insurance System and Its Future Role,” FY2014
Figure 13 Healthcare cost trend
annually. Particularly, healthcare costs for oldold people have risen faster, accounting for 37% of total healthcare costs in FY2015. Longterm care costs have soared even faster than healthcare costs, growing 2.5fold from 4 trillion yen in the initial year for the longterm care insurance system to FY2015 on an estimated basis.
Behind healthcare and longterm care cost growth have been the aging population, technique advancement and increasing rewards for service providers. However, public expenditures’ partial coverage of healthcare and longterm care costs has encouraged service users and providers to expand the costs. As for the healthcare insurance plan for oldold people and the longterm care insurance system for which benefits are expected to increase, whether government expenditures’ coverage of costs or benefits should be left unchanged should be fundamentally reconsidered.
Figure 13 Healthcare cost trend
(Source) Ministry of Finance, Fiscal System Council Fiscal System Subcommittee documents, April 27, 2015.
Original data are from Ministry of Health, Labor and Welfare, “Healthcare Cost Trend Survey”
Figure 14 Longterm care cost trend
(Note) Costs are actual for FY20002011 and estimated in initial budgets for FY20122013.
(Source) Ministry of Health, Labor and Welfare, “Present Longterm care Insurance System and its Future Roles,”
FY2014
(Source) Ministry of Finance, Fiscal System Council Fiscal System Subcommittee documents, April 27, 2015. Original data are from Ministry of Health, Labor and Welfare, “Healthcare Cost Trend Survey”
Policy Research Institute, Ministry of Finance, Japan, Public Policy Review, Vol.14, No.2, March 2018 233
technique advancement and increasing rewards for service providers. However, public expenditures’ partial coverage of healthcare and long-term care costs has encouraged service users and providers to expand the costs. As for the healthcare insurance plan for old-old people and the long-term care insurance system for which benefits are expected to increase, whether government expenditures’ coverage of costs or benefits should be left unchanged should be fundamentally reconsidered.
IV. Perspectives for reforming personal income tax IV-1. Income and employment changes
The compensation of employees share of national income has decreased under protracted deflation while entrepreneurial income has continued to increase. As a result, the labor share has declined, as noted above. In fiscal aspects, the government has supported the economy by continuing to borrow funds. However, a main factor behind budget deficits has made a transition from being public investment for boosting the economy just after the collapse of asset bubbles to public expenditures on social security. Effectively, the government is passing part of present costs for pensions, healthcare and long-term care benefits on to future generations through debt issues. While how to address growing social security costs under the aging of population has failed to be fully considered, an excessive burden has been exerted on deficit-financing public bonds.
Under such situation, the most important problem for the tax and fiscal systems is to reform heavy fiscal dependence on deficit-financing public bonds. To this end, national and
Figure 14 Long-term care cost trend
annually. Particularly, healthcare costs for oldold people have risen faster, accounting for 37% of total healthcare costs in FY2015. Longterm care costs have soared even faster than healthcare costs, growing 2.5fold from 4 trillion yen in the initial year for the longterm care insurance system to FY2015 on an estimated basis.
Behind healthcare and longterm care cost growth have been the aging population, technique advancement and increasing rewards for service providers. However, public expenditures’ partial coverage of healthcare and longterm care costs has encouraged service users and providers to expand the costs. As for the healthcare insurance plan for oldold people and the longterm care insurance system for which benefits are expected to increase, whether government expenditures’ coverage of costs or benefits should be left unchanged should be fundamentally reconsidered.
Figure 13 Healthcare cost trend
(Source) Ministry of Finance, Fiscal System Council Fiscal System Subcommittee documents, April 27, 2015.
Original data are from Ministry of Health, Labor and Welfare, “Healthcare Cost Trend Survey”
Figure 14 Longterm care cost trend
(Note) Costs are actual for FY20002011 and estimated in initial budgets for FY20122013.
(Source) Ministry of Health, Labor and Welfare, “Present Longterm care Insurance System and its Future Roles,”
FY2014
(Note) Costs are actual for FY2000-2011 and estimated in initial budgets for FY2012-2013.
(Source) Ministry of Health, Labor and Welfare, “Present Long-term care Insurance System and its Future Roles,” FY2014
234 E Tajika, H Yashio / Public Policy Review