SUMMARY In this paper, we developed saccade-induced line displays including flashing period controllers. The displays speeded up the flashing period of one line using LED drivers and Arduino Uno equipped with AVR microcomputers. It was shown that saccades were easily induced when the observer alternately looks at the two fast flashing line displays apart. Also, we were able to find the optimum flashing period using a controller that can speed up the flashing period and change its speed. We found that the relationship between the viewing angle of the observer and the optimum flashing period is almost proportional.
key words: saccade, line display, eyeball movement, LED driver
1. Introduction
Various kinds of line LED display devices using afterim- age have been developed. One type is the plural line dis- plays arranged at certain intervals, and another type is the moving flashing line display, called “POV-Persistent Of Vi- sion”. Besides, a single-line fixed display using the saccade eyeball movement has been developed[1],[2]. Power and space saving can be achieved by not only decreasing the number of line display but also fixing the line displays po- sition. However, to control the saccade characteristics, an- other fixed marker is required and the flashing timing must be controlled. Therefore, we proposed two fixed line dis- plays that alternatively work as a marker and image display to induce the saccade efficiently[3],[4]. However, these de- vices have limitations in high-speed control, and it was not possible to achieve high resolution[5].
In this paper, we developed a saccade type line display which can realize high speed flashing. This line display has a controller which can change its flashing period to various values each time the tact switch is pushed. Experiments us- ing this controller are conducted to find the optimal flashing period for us to see the displayed image most clearly. By using a digital camera, we confirm that the line display is ac- tually flashing according to the flashing periods specified by the program written in the microcomputer. Images for vari- ous flashing periods are taken by moving the digital camera to simulate the eyeball movement, at a fixed shutter speed.
We estimate the flashing period from the number of images captured. We also measure the voltage applied to one LED using an oscilloscope and confirmed high-speed flashing.
Manuscript received February 27, 2018.
Manuscript revised May 15, 2018.
†The authors are with Kanagawa Institute of Technology, Atsugi-shi, 243–0292 Japan.
a) E-mail: [email protected] DOI: 10.1587/transele.E101.C.851
In Sect. 2, we describe our proposed line display de- vice with a controller. Section 3 is the discussion on the experiments. The results are described in Sect. 4. Finally, we conclude with Sect. 5.
2. Saccade Type Line Display
2.1 Saccade
The proposed line display uses saccade. Saccades are short- term high-speed eye movements that occur when the head is stationary in relation to the environment. For example, when our eyes are facing the front, we notice an object we care about within the field of view and turn our eyes towards it.
When there is an interesting object such as a point of interest in a peripheral area of the visual field, the eyes have the char- acteristic of rapidly turning their lines of sight to the point of interest and abruptly stopping after a duration of about 30–
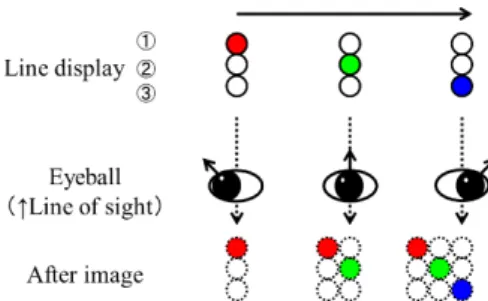
50 ms[6]–[10]. Principle of the saccade type line display is shown in Fig. 1. We can recognize an image by observing a flashing line display while moving eyeballs. It is known that when the eyeball is moved from left to right and from right to left with respect to the light spot sequence in which a series of image segments forming a two-dimensional image are sequentially displayed, the direction of the image also changes.
In general, during the saccades, perception is sup- pressed by the brain’s function called suppression of sac- cades, which makes it difficult to perceive the visual stimu- lus and its changes. However, when luminance and color in- clude high frequency components, and background is dark, it is known that it is easy to perceive images around the vi- sual field[6].
Fig. 1 Principle of saccade type line display
Copyright c2018 The Institute of Electronics, Information and Communication Engineers
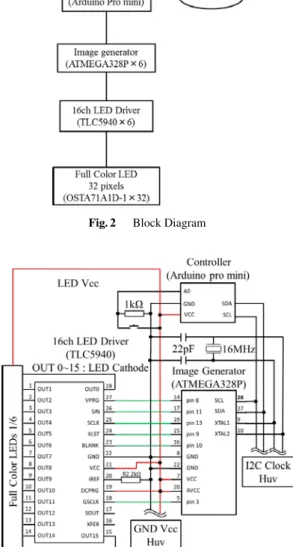
Fig. 2 Block Diagram
Fig. 3 Circuit Diagram of LED control unit
2.2 Developed Line Display
We developed a 32-pixel line display using 32 square- shaped full color LEDs (OSTA71A1D-1), 6 LED drivers (TLC 5940), and 8-bit AVR RISC-based microcontrollers (ATMEGA 328P) and an Arduino Pro Mini for flashing con- trol of LEDs. The block diagram of our developed line dis- play device is shown in Fig. 2. A circuit diagram of the LED control unit is shown Fig. 3. The actual prototype produced is shown in Fig. 4. Since the device produced this time uses 32 full-color LEDs, it is necessary to control each of the 32 RGBs. Six of TLC 5940 which is a 16ch constant current sink LED driver are used, and each drivers is controlled by ATMEGA 328.
•2.2.1 Controller
This controller uses Arduino Pro Mini and sends operation timing signals to six image generators by I2C communica- tion.
Fig. 4 Prototype line display block with LED controller
Fig. 5 Original dotted image
•2.2.2 Image generator
For this image generator, ATMEGA 328 P of AVR micro- computer is used. The six image generators are operating with a common 16-MHz clock. Each of the microcomput- ers includes different programs composed of separate im- age data for red, green and blue and operates simultaneously upon receiving an instruction from the controller.
•2.2.3 16-ch LED driver
This 16-ch LED driver uses TLC5940. One image generator is connected to one driver, and the program of the image generator is executed. This driver is 16-ch, and 6 pieces are used for controlling the 32 full color LEDs.
2.3 Operation of Image Generator
We have designed the image generators for the display of a 32 (V) ×32 (H) pixel original image such as shown in Fig. 5. Using VBA (Visual Basic for Applications), this original image was created by calculating a 256-level value for each of the RGB colors. Since the LED driver used
Fig. 7 Images captured by a digital camera of a shutter speed 50 ms
can control the brightness of each LED by 4096-levels (12- bits) PWM, theoretically about 68.7 billion colors can be expressed. However, human eyes are unable to distinguish the difference of gradation with about 16.77 million colors expressing each component of RGB in 256 steps (8 bits).
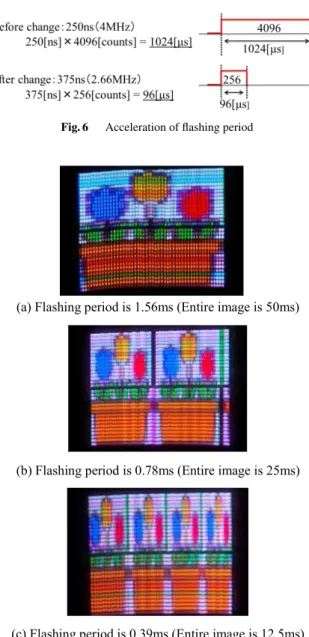
Furthermore commonly used personal computers represent a full color image as 256 levels of RGB in general. So we set the upper limit of 255 for each color this time. As shown in Fig. 6, the LED driver used counts 4096 times by default and takes at least 1024µs in one cycle. Since the limit of human gradation recognition is about 10 million colors, we set several parameters again to maximize the clock count to
“256” and speed up to 96µs that means 192µs for the flash- ing period, since the duty ratio is 50%.
The image used in this experiment is a 32×32 pixel square image. The vertical size of the image is physically determined by 32 LEDs, but its horizontal size observed by the eye depends on the duration of the saccade and can
Fig. 8 Voltage waveforms of the clock of a LED driver
be different from 32. According to the program, the image in the figure is lighted at high speed in order from the left within a fixed time.
2.4 Confirmation of Prototype High Speed Line Display The developed line display device consists of one Arduino Pro mini and six of ATMEGA328P as master-slave con- trollers, a tact switch as a counter for changing the flush- ing period, six of LED drivers (TLC5940) and 32-pixel full color LED line display. By a parallel transfer of image data using the six slave controllers, a flashing operation with a doubled speed which corresponds to a flashing period of 0.39 ms has been achieved.
To confirm the high flashing speed, images for flash- ing periods of 1.56 ms, 0.78 ms and 0.39 ms were taken by a digital camera being moved to simulate the eyeball move- ment. When the flashing periods of one line are 1.56, 0.78
Fig. 9 Observation environment seen from the side
Fig. 10 Observation environment seen from above
and 0.39 ms, it flashes 32 times for the entire image, so the periods of the entire image are 50, 25 and 12.5 ms, respec- tively. The shutter speed was fixed to 50 ms. Results are shown in Fig. 7. In the flashing period of 12.5 ms, four clear images could be reproduced. It can confirmed that the flash- ing speed is visually accelerated and a 0.39 ms high speed controller was successfully developed. Figure 8 shows the voltage waveforms of the clock for grayscale PWM control of the LED driver when the flashing period is changed to 1.56, 0.78 and 0.39 ms.
3. Experiments for Optimizing Flashing Period We conducted experiments to find the optimum value of the flashing period. The experimental environment is shown in Fig. 9 and Fig. 10. Each observer sat on a chair so that the position of the eyes coincided with the center of the line dis- play and sat down from the line display at different distances of 900 mm, 1800 mm, 2800 mm and 3200 mm. In this de- vice, the flashing period of the line display can be changed to five patterns of 0.20 ms, 0.39 ms, 0.78 ms, 1.56 ms and 3.12 ms by pressing the tact switch. The observer induced saccades by alternately watching the two displays with the eyeball movement alone, without moving the head from the sitting position. We conducted a subjective evaluation for the difference in length of the flashing period for 10 ob- servers. The observers sitting at each distance from the line display evaluated the image quality with 5 grades of distor-
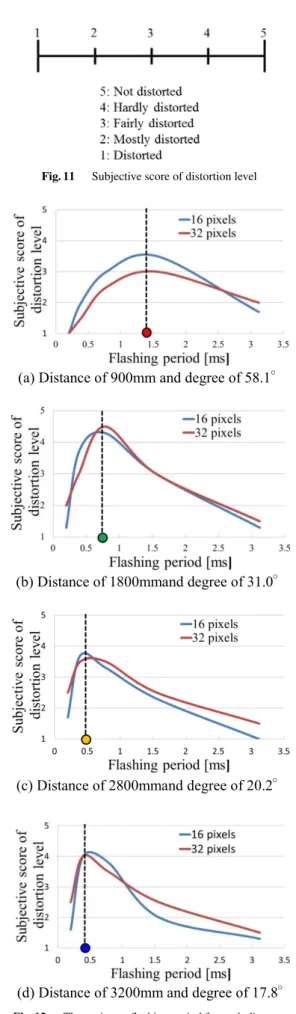
Fig. 11 Subjective score of distortion level
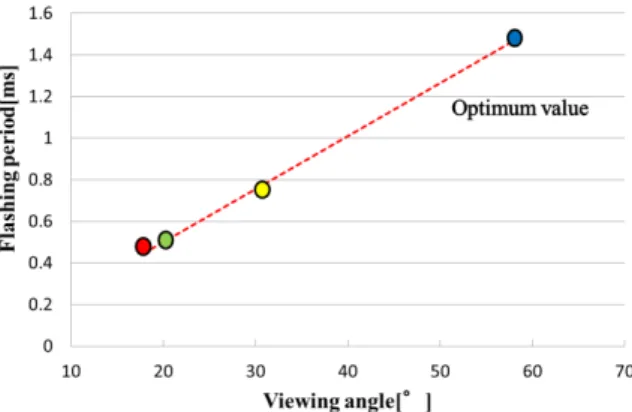
Fig. 12 The optimum flashing period for each distance
Fig. 13 The optimum values of eyeball angle and flashing period
tion level shown in Fig. 11. Here, the distortion means the difference of the aspect ratio between the perceived image and the original image.
4. Experiment Results
By using the display controller, the flashing period opti- mization was experimented. The LED flashing period was changed to 0.20 ms, 0.39 ms, 0.78 ms, 1.56 ms and 3.12 ms by the tact switch and LED display resolution was 16×16 and 32×32. The result of the optimum flashing period is shown in Fig. 12. As a result, in the case of the 1800 mm environment, the optimum flashing time for both the 16×16 size display and the 32×32 size display was 0.78 ms. The period of the image was 12.5 ms for this 16×16 size dis- play and 25.0 ms for the 32×32 size display. In addition, it was found that the optimum period exists for perception due to the variation of the distance. It became clear that a longer period is selected when the distance is shortened, and faster frequency is selected when the distance is longer. That is, when the observation distance is short (the movement angle of the eyeball is large), the duration time becomes long, and when the observation distance is long (the eyeball movement angle is small), the duration time becomes short.
When the period of the image becomes longer than the op- timum value in all the patterns, the image is observed in an enlarged manner in the lateral direction, and when shorter, a laterally shrunk image was observed. Experimental results showed that the optimum frequencies of 16×16 and 32×32 are the same for all distances, so that they are independent on the number of pixels. Also, as can be seen in Fig. 13, it was found that the optimum flashing period is almost pro- portional to the viewing angle. From this result, it is possible to obtain the optimum frequency in three observed points.
5. Conclusions
The high speed display controller for our proposed saccade- type line display was developed, and by using the controller, the optimized flashing period was determined. The lighting time per line could be shortened to 192µs by using the con- troller developed in the experiment. We were able to find the
becomes smaller and the saccade continuation time becomes shorter. Then the optimum flashing period becomes shorter.
We found that the relationship between the viewing angle of the observer and the optimum flashing period is almost proportional. Our line display can achieve high resolution saccade-type display with low power and space saving suit- able for advertising and amusement application. Low power and space saving line displays help to make environmentally friendly society.
Acknowledgments
The authors would like to thank Dr. Junji Watanabe for use- ful advice and helpful discussion and thank reviewers for helpful comments. This work was supported by JSPS KAK- ENHI Grant Number JP18K04270.
References
[1] J. Watanabe and T. Maeda, “The Study of Saccade-based Display,”
in Japanese, TVRSJ, vol.6, no.2, pp.79–87, 2001.
[2] J. Watanabe, T. Maeda, and S. Tachi, “Time Course of Localization for a Repeatedly Flashing Stimulus Presented at Perisaccadic Tim- ing,” in Japanese, IEICE, D-II, vol.J86, no.7, pp.1350–1357, 2003.
[3] K. Kanazawa and M. Okumura, “Evaluation experiment of the information-display system by using afterimage according to eye- ball movement,” in Japanese, IPSJ SIG Technical Reports, vol.2016- CDS-17, no.2, pp.1–5, 2016.
[4] K. Kanazawa and M. Okumura, “Evaluation experiment of the information-display system by using afterimage according to eye- ball movement,” in Japanese, IPSJ SIG Technical Reports, vol.2017- CDS-18, no.27, pp.1–7, 2017.
[5] K. Kanazawa, S. Kazuno, and M. Okumura, “Evaluation experiment of the information - display system by using full color LED to eye- ball movement,” in Japanese, IPSJ SIG Technical Reports, vol.2017- CDS-18, no.28, pp.1–6, 2017.
[6] H. Mitsudo, “Saccadic eye movements and perceptual stability,”
in Japanese, Kyushu University Psychological Research, vol.12, pp.61–68, 2011.
[7] Vision Society of Japan Editing, “Vision Information Processing Handbook,” Asakura Bookstore, 2000.
[8] H. Ando, J. Watanabe, T. Amemiya, and T. Maeda, “Full-scale saccade-based display: Public/Private image presentation based on gaze-contingent visual illusion,” SIGGRAPH 2007 Emerging Tech- nologies proceeding, San Diego, California USA, Aug. 2007.
[9] H. Ando, J. Watanabe, T. Amemiya, and T. Maeda, “Study of saccade-incident information display using saccade detection de- vice,” In proceedings of the 15th International Conference on Ar- tificial Reality and Telexistence, pp.119–124, 2005.
[10] Edited by R.H.S Carpenter, “Eye Movements,” Macmillan, 1991.
Shota Kazuno received the B.E. and M.S.
degrees in Electrical and electronics Engineer- ing from Kanagawa Institute of Technology in 2016 and 2018, respectively. He has studied consumer electronics using IoT technologies.
Makiko Okumura received her B.E. degree from Keio University in 1982, and Ph.D. degree in electrical engineering from Tohoku Univer- sity in 1994. She joined Toshiba R & D Center, Kawasaki, Japan, and transferred to Kanagawa Institute of Technology in 2000. She has been working on the development of analog circuit simulators and now studying consumer electron- ics. She is a member of the institute of Electron- ics, Information and Communication Engineers of Japan and a member of IEEE.