Preliminary Helioseismology with the FFT of Image Analysing System Applied to the
Spacelab2 Movie Images
Kouichi Koyama RIST,Kinki University, Higasi-Osaka, Osaka-577 Japan
Soji Ohara
Faculty of Economics, Nara Sangyo University, Ikomagun, Nara-636 Japan
Wasaburo Unno RIST,Kinki University, Higasi-Osaka, Osaka-577 Japan
(Received December 28, 1993)
Abstract
White-light movie images of quiet sun observed by Spacelab2 are studied by means of a simple personal image analyzing system(PIAS). A 2-dimensional spacial Fourier analysis is performed for scenes of more than 20 epochs in 25 minutes observing interval. Inverse Fourier transform images for several selected spatial frequency regions are then produced, and the brightness of a pixel on successive images is measured to obtain the time dependence of that spatial frequency.
Preliminaly measurements show peaks in the (k - w )-spectram corresponding to spectral ranges of the evanescent wave in addition to the spectral ranges corresponding to the well-known solar 5 min oscillation. Since the present measurement is relatively sensitive to holizontal motion, the possible detection of the evanescent wave spectrum should not be disregarded, even if theoretically implausible.
Key Words: Solar oscillation, Fourier analysis
1 Introduction
White-light movies of the solar surface were obtained by the Solar Optical Universal Polarime- ter( SOUP) instrument flown on Spacelab2(NASA Space Shuttle mission 51-F). The movies are com- pletely free from the distortion introduced by the Earth's atmosphere. (Simonet al. 1988) The sur- face movie of quiet sun observed by Spacelab2 is analyzed by image analysis system(PIAS) using personal computer. The movie have been treated of running average( over 300 frames) in advance such that 1 scene is an averaged image for 10 sec-
onds observation. The total number of scenes is 150. So the movie represents the 25 minutes ob- servation of the surface of quiet sun. The data can be used for helioseismological study to derive the ( k - w) diagram of the surface brightness. In contrast to the Doppler motion measurement, the brightness measurement is expected to be sensi- tive to transverse large scale motions rather than vertical small scale motions. Thus, the detection of g-modes or f-modes may be relatively easier.
1a
1d
Fig~re 1: 2-dimensional FFT by PIAS. (1a) original image of quiet sun, (1b) 2-D power spectram in- tensity diagram, (1c) the spectral region selected from the domain b, (1d) the inverse Fourier transform corresponding to the spectral region shown in (1c).
2 Analysis and Results
More than 20 scenes were selected for analysis in nearly every 5 scenes. For each selected scene, 2-dimensional FFT analysis was applied to obtain the power spectram for spacial oscilations of the sun. On this 2-dimensional power spectram, circu- lar region in frequency domain centered at the ori- gin k
=
0 is selected and the inverse Fourier trans- form was performed only with the Fourier compo- nents in that selected region. Figure 1 shows the results of the above process, Figure 1(a) shows the sample image area of quiet sun(2011 x 2011) degitized by 256 x 256 pixels in which granula-tions are clearly observed, Figure 1(b) is the 2- dimensional power spectram in which small spec- tral ranges in wave number are selected such as shown in Figure 1 (c) to be circular region of 7 pixel radius. Let B(r, ti) denote the brightness at a position r at time ti as shown in Figure 1(a).
Figure 1(b) shows B(k,ti) and Figure 1(c) rep- resents D.B(kj, ti) corresponding to the adapted band width D.k in wave number space. Figure 1(d) is the inverse Fourier transform image cor- responding to the selected circular region in Fig- ure 1(c).Figure 1(d) then gives D.Bk;(r, ti), corre- sponding to the selected kj ::; 3.0Mm-1 ranges of Figure 1 (c).
Figure 2 shows the time series data of the in Figure 1d. We obtain D.Bk;(rm, ti) for other kj brightness D.Bk1(rm,ti) (kj = 1.52Mm-1) for (i = and rm as seen in Figure 3 and Figure 4.
1, · · ·n(n = 25)) at an arbitrary chosen point rk
g
...
,,·· ... .
•'··· ...
. ... .
•'
···
.. ·
8+-~~-r--~~----r-.-~~,-~-.~~~-.~r-.-~,-~---.~
"b. oo 10. oo 20. oo 30. oo •o· oo so. oo eo. oo 70. oo eo. oo so. oo 100. oo 110. oo 120. oo uo. oo
TIME SEAlES
Figure 2: The time series data of the brightness at an arbitrary chosen pixel in Figure ld.
(kj =
1.52Mm-1)
ci ;:;
g
~~
~g ··' ,•'''• •,, ,.···'"'•••"''''•
~~
··· ...
',··· ···
,•''
,•''''•,
.. ···· ··.
.. ···
'• •,,...
"b. 00 10. DO 20. CO 30.00 40- DO 50.00 60. DO 10. DO 80.00 90.00 100.00 110. DO 120.00 JSQ. 00
TIME SERIES
Figure 3: The time series data of the brightness at a pixel in the inverse Fourier transform image corresponding to the spectral region (ki
=
1.08Mm-1 ).g
ci ;:;
0
~~
"'
. ~~
.····""'· ...
•'0
:i
•,
...
', '•
..
,Figure 4: The time series data of the brightness at a pixel in the inverse l<'ouner transform image corresponding to the spectral region (ki = 0.65Mm-1
g
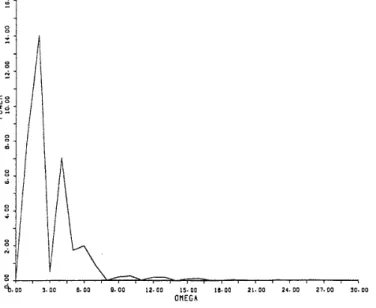
<b.oo 3.oo s.oo a.oo 12.00 1s.oo 11.00 21.00 24.oo 21.00 ~o.oo OMEGA
Figure 5: !-dimensional FFT for the time series data shown in Figure 2.
k (}Jnc 1) w oo-ss-1)
0.65 4.9 9.8 24.5
1. 08 9.8 19.6 29.5
1. 52 9.8 19.6 29.5
Table 1: Estimates of holizontal wave number k and angular frequency w obtained by FFT.
1-dimensional FFT is applied to the time se- ries data for Figure 2, Figure 3 and Figure 4.
One of the power spectram is shown in Figure 5. Every power spectram has three peaks. From the peak positions we get the angular frequen-
3 Discussion
The time series images of quiet sun are ana- lyzed by FFT. For two selected holizontal frequen- cys, we get several angular frequencys as shown in Table 1. Figure 9 shows the k-w diagram. Several data of present results fit to experimental and the- oretical oscillation reported in Unno et al.(1979) which was recognized as p2-mode and !-mode of oscilations. There are other three data that could
Acknowledgement
cys as shown in Table 1. Figure 6 shows the k(holizontal wavenumber )-w( angular frequency) diagram of present results superimposed on the results of calculation( solid line) summarized in Unno et al.
be identified as another mode wich is located be- tween f- and g-mode oscilations though it is the- oretically implausible. Present analysis was per- formed by a system which had not enough frame memory for storing and processing multiple movie images. Therefore the result is preliminary and the precision of results is not enough. However, in view of the accuracy of brightness data for de- tecting low wave number modes, more advanced study seems to be worth doing.
We thank Dr.L.C.Acton for making spacelab2 movie available for the present study.
p ,(cal)
30
D D
I
"'
0
0
.::
a
20
f (call
>.
0 0
u c
"'
::l C'
"'
~
tx.
::l 10
..
c<
0 0.5 1.0 1.5
H o r i z o n t a I W a v en u m be r k (Mm-•)
Figvre 6: k - w diagram of present results. Solid line are the calculated results summarized in Unno et al.
References
[1] Simon,G.W.,Title,A.M.,Topka,K.P.,Tarbell,T.D.,Shine,R.A.,Fergson,S.H.,Zirin,H.
and The SOUP Team.l988,.Astrophysical Journal,No327,964.
[2] Unno,W.,Osaki,Y.,Ando,H.,Shibahashi,H.l979,.University of Tokyo Press.