Comparison of Analyzed and Calculated Values of Gamma-Aminobutyric Acid (GABA) Intake from Hospital Diet
4
0
0
全文
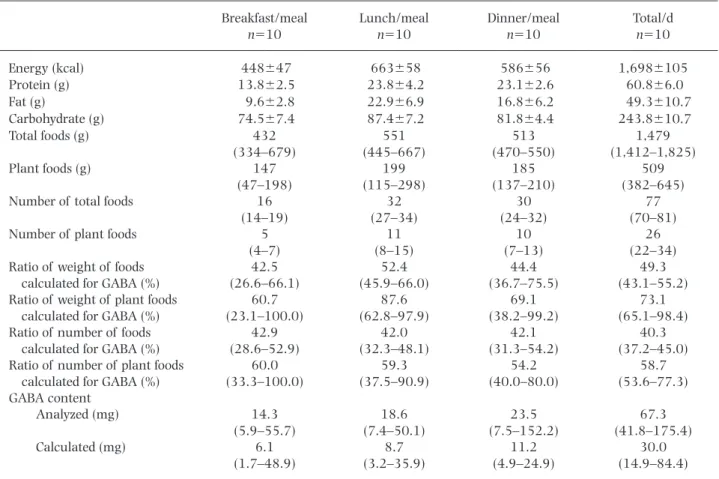
(2) 140. Ito S et al.. Table 1. Nutrient content, number and weight of food used for menu, and GABA analysis and calculation values of the sampled diet.. Energy (kcal) Protein (g) Fat (g) Carbohydrate (g) Total foods (g) Plant foods (g) Number of total foods Number of plant foods Ratio of weight of foods calculated for GABA (%) Ratio of weight of plant foods calculated for GABA (%) Ratio of number of foods calculated for GABA (%) Ratio of number of plant foods calculated for GABA (%) GABA content Analyzed (mg) Calculated (mg). Breakfast/meal n510. Lunch/meal n510. Dinner/meal n510. Total/d n510. 448647 13.862.5 9.662.8 74.567.4 432 (334–679) 147 (47–198) 16 (14–19) 5 (4–7) 42.5 (26.6–66.1) 60.7 (23.1–100.0) 42.9 (28.6–52.9) 60.0 (33.3–100.0). 663658 23.864.2 22.966.9 87.467.2 551 (445–667) 199 (115–298) 32 (27–34) 11 (8–15) 52.4 (45.9–66.0) 87.6 (62.8–97.9) 42.0 (32.3–48.1) 59.3 (37.5–90.9). 586656 23.162.6 16.866.2 81.864.4 513 (470–550) 185 (137–210) 30 (24–32) 10 (7–13) 44.4 (36.7–75.5) 69.1 (38.2–99.2) 42.1 (31.3–54.2) 54.2 (40.0–80.0). 1,6986105 60.866.0 49.3610.7 243.8610.7 1,479 (1,412–1,825) 509 (382–645) 77 (70–81) 26 (22–34) 49.3 (43.1–55.2) 73.1 (65.1–98.4) 40.3 (37.2–45.0) 58.7 (53.6–77.3). 14.3 (5.9–55.7) 6.1 (1.7–48.9). 18.6 (7.4–50.1) 8.7 (3.2–35.9). 23.5 (7.5–152.2) 11.2 (4.9–24.9). 67.3 (41.8–175.4) 30.0 (14.9–84.4). Average6SD or median (minimum–maximum value).. calculated by the ratio of the peak area of GABA/theanine derivatives, then the GABA content per meal was finally derived. GABA content calculation. The energy and nutrients content were calculated from the ingredients and the weights used for each dish using a computer program with the Standard Tables of Food Composition in Japan (5). GABA content was calculated only for foods with reported amount of GABA in Japan. In addition to the data published by the National Agriculture and Food Research Organization (http://www.naro.affrc.go.jp/labo ratory/nfri/contens/ffdb/ffdb.html), we performed a literature search in PubMed and ICHUSHI (Japan Medical Abstracts Society; https://search.jamas.or.jp/) in July 2018. Search term was “GABA” or “aminobutyric acid” and after that, the literature was collected by hand search (6–15). If more than one GABA amount was shown for the same food, the mean was calculated and used in the calculation. Although GABA is hardly decomposed by heating, it is known that GABA is transferred to boiled juice by cooking operations such as boiling (16). However, since there is no data on cooking loss for each food, in the case of boiling spilled cooking, the amount of GABA was tentatively calculated to be 50%. The GABA amount for each meal was calculated by adding the GABA amount of each dish. Since GABA is mainly contained in plant foods (vegetables, fruits, potatoes, bean products, seaweeds and mushrooms),. the number and weight of them used in each meal and also percentage of them for which GABA content could be calculated and were derived. Water used for cooking is not considered as food, but the soup stock is counted as one food. Statistical analysis. Data normality was checked and shown as average6SD for normal distribution and median (minimum–maximum value) for non-normal distribution. Spearman’s rank correlation coefficient was used for the relationship between the two variables of the non-normal distribution. Data were analyzed using SPSS Statistics version 24 (IBM Japan, Ltd., Tokyo). A p-value of ,0.05 was considered statistically significant. Results Table 1 shows the calculated values of energy and nutrient content and the data such as the number of foods of 30 meals sampled for each meal and one day total. The median percentage of total food weight and plant food weight for which GABA could be calculated were 49.3% and 73.1%, respectively. The median ratio of the number of foods for which GABA could be calculated to the total number of foods and plant foods were 40.3% and 58.7%, respectively. The median GABA analytical value was 67.3 mg/d and the calculated value was 30.0 mg/d. Figure 1 shows the relationship between the calcu-.
(3) 141. GABA Intake from Hospital Diet. Fig. 1. Relation between calculated and analyzed values of GABA (n530). Two meals with analytical values above 100 mg/meal (analytical value 105.2 and 152.2 mg for calculated value 5.4 and 17.0 mg) are not shown in the graph.. lated and analyzed values of GABA for 30 meals. Overall, the calculated values were lower than the analytical values, but Spearman’s rank coefficient correlation between the two variables was 0.618 (p,0.001). Discussion In this study, the intake of GABA from nutritionally controlled hospital diet was examined. The median analysis of GABA intake was 67.3 mg/d. The estimated GABA intake by calculation was about half of the analytical value. This is largely due to the lack of data that can be used to calculate GABA. However, there was a significant positive correlation between the calculated and analyzed values of GABA. In this study, in 2 of the 30 meal samples, the analytical value was much higher than the calculated value. The reason for this might be that both menus included a dish of yogurt or banana mixed with other fruits. GABA is produced from glutamate by the action of glutamate dehydrogenase (17). GABA may increase in cooking operations that meet the conditions for glutamate dehydrogenase to function without inactivation (16). If more knowledge about the increase or decrease in GABA amount due to cooking is accumulated, the estimation accuracy of GABA intake will be further improved. Currently, many foods with health claims including GABA are distributed in Japan. For people with mild hypertension, a significant decrease in blood pressure has been observed by consuming functional foods containing 10–12 mg/d of GABA for 12 wk (18). In this study, 67.3 mg/d of GABA can be taken from nutritionally controlled hospital food, which is several times. higher than the expected intake of GABA from functional foods. Eating a balanced diet may be more important than choosing functional foods to prevent high blood pressure. In this study, GABA intake from beverages such as tea were not measured. Since the types and amounts of drinks vary from person to person, it is necessary to estimate GABA intake from bevarages in consideration of them. In order to quantify the current state of GABA intake in Japan, the data on GABA amount especially for plant foods will be enriched and the knowledge of increase and decrease due to cooking will be accumulated, and it is necessary to estimate the amount of GABA in the diet of many free-living people. The limitation of this study is that meals were sampled in one hospital and the number of meals is small. GABA intake from nutritionally controlled diet was shown, and it was also shown to be higher than expected from functional foods. The result of this study will be useful for considering the role of functional foods as well as estimating GABA intake from daily diet. Authorship Research conception and design: SI, KT and HT; experiments: SI, KS, CN and KT; interpretation of the data: SI and HT; writing of the manuscript: SI, KT and HT. Disclosure state of COI No conflicts of interest to be declared. Acknowledgments We would like to thank Dr. Bert Griffith for useful discussions. This work was supported by a grant from commissioned project study, Ministry of Agriculture, Fishery and Forestry, Japan (JPJ005336). REFERENCES 1) The Japanese Society of Hypertension. 2019. The Japanese Society of Hypertension Guidelines for the Management of Hypertension 2019. Lifescience Co., Tokyo (in Japanese). 2) Umegaki K. 2019. Safety and effectiveness of food with health claims and its effective use. Jpn J Nutr Diet 77(3): 67–75 (in Japanese). 3) Fayed AE. 2015. Review article: Health benefits of some physiologically active ingredients and their suitability as yoghurt fortifiers. J Food Sci Technol 52(5): 2512–2521. 4) Briguglio M, Dell’Osso B, Panzica G, Malgaroli A, Banfi G, Zanaboni Dina C, Galentino R, Porta M. 2018. Dietary neurotransmitters: A narrative review on current knowledge. Nutrients 10(5): 591. 5) Science and Technology Agency. 2015. Standard Tables of Food Composition in Japan. 7th rev. ed. Daiichi Publishing Co., Tokyo (in Japanese). 6) Ren H, Hayashi T, Endo H, Watanabe E. 1993. Characteristics of Chinese and Korean soy and fish sauces in the basis of their free amino acid composition. Nippon Suisan Gakkaishi 59(11): 1929–1935 (in Japanese). 7) Kondo K, Toida J, Arikawa Y, Ohara T. 2005. Shoku nikuno Yuuriaminosan. Research report of Food Technol-.
(4) 142. 8). 9). 10). 11) 12). 13). Ito S et al. ogy Research Institute of Nagano Prefecture 33: 36–44 (in Japanese). Kiribuchi T. 1992. Studies on g-aminobutylic acid in fungi. Journal of Home Economics of Japan 43(2): 165– 168 (in Japanese). Hayakawa K, Ueno Y, Kawamura S, Taniguchi R, Oda K. 1997. Production of g-aminobutylic acid by lactic acid bacteria. Seibutsu-Kogaku Kaishi 75: 239–244 (in Japanese). Ohno K. 2010. Gamma-aminobutyric acid in citrus fruits. Functional ingredient analysis manual, Chiiki shikoku innovation kyougikai (in Japanese). Yokogoshi H. 2007. Sutoresu to GABA, p 112. The Shizuoka Shimbun Co., Shizuoka (in Japanese). Hayakawa K. 2005. Antihypertensive effect of novel fermented milk containing g-aminobutyric acid. Milk Science 54(3): 137–140 (in Japanese). Nakamura K, Nara K, Noguchi T, Ohshiro T, Koga H. 2006. Contenes of g-aminobutyric acid (GABA) in. 14). 15). 16). 17) 18). potatos and processed potato products. Nippon Shokuhin Kagaku Kogaku Kaishi 53(9): 514–517 (in Japanese). Abe T, Takeya K. 2005. Difference in g-aminobutyric acid content in vegetable soybean seeds. Nippon Shokuhin Kagaku Kogaku Kaishi 52(11): 545–549 (in Japanese). Sato E, Aoyagi Y, Sugahara T. 1985. Contents of free amino acids in mushrooms. Nippon Shokuhin Kogyo Gakkaishi 32(7): 509–521 (in Japanese). Ito H, Kikuzaki H, Ueno H. 2019. Effects of cooking method on free amino acid contents in vegetables. J Nutr Sci Vitaminol 65(3): 264–271. Roberts E, Frankel S. 1951. Glutamic acid decarboxylase in brain. J Biol Chem 188(2): 789–795. Inoue K, Shirai T, Ochiai H, Kasao M, Hayakawa K, Kimura M, Sansawa H. 2003. Blood-pressure-lowering effect of a novel fermented milk containing gamma-aminobutyric acid (GABA) in mild hypertensives. Eur J Clin Nutr 57(3): 490–495..
(5)
図
関連したドキュメント
H ernández , Positive and free boundary solutions to singular nonlinear elliptic problems with absorption; An overview and open problems, in: Proceedings of the Variational
In this, the first ever in-depth study of the econometric practice of nonaca- demic economists, I analyse the way economists in business and government currently approach
Keywords: Convex order ; Fréchet distribution ; Median ; Mittag-Leffler distribution ; Mittag- Leffler function ; Stable distribution ; Stochastic order.. AMS MSC 2010: Primary 60E05
In Section 3, we show that the clique- width is unbounded in any superfactorial class of graphs, and in Section 4, we prove that the clique-width is bounded in any hereditary
Keywords: continuous time random walk, Brownian motion, collision time, skew Young tableaux, tandem queue.. AMS 2000 Subject Classification: Primary:
Inside this class, we identify a new subclass of Liouvillian integrable systems, under suitable conditions such Liouvillian integrable systems can have at most one limit cycle, and
Then it follows immediately from a suitable version of “Hensel’s Lemma” [cf., e.g., the argument of [4], Lemma 2.1] that S may be obtained, as the notation suggests, as the m A
We have introduced this section in order to suggest how the rather sophis- ticated stability conditions from the linear cases with delay could be used in interaction with
