Roles of Nonalcoholic Fatty Liver Disease and Hyperuricemia in Lifestyle-related Diseases
8
0
0
全文
(2) Methods. Study design This retrospective cohort study was performed in accordance with the principles of the Declaration of Helsinki and was approved by the Ethics Committee of Tokyo Women’s Medical University (approval date: November 1, 2018; approval number: 4967 ). The study cohort was from among those who visited the Department of Complete Medical Check-up at Tokyo Women’s Medical University (Japan) between June 2016 and December 2017. Specifically, we included those who had a periodic check-up at the “human dry dock” (the Japanese health check-up system). Subjects with either hepatitis C or hepatitis B infections were excluded from our study. Services delivered at the human dry dock The periodic health check-up program at the human dry dock is comprehensive. It includes the following assessments: physical characteristics (height, body weight, and waist circumference), complete blood count, blood biochemistry, urinalysis, electrocardiography, abdominal ultrasonography, upper gastrointestinal tract barium meal or endoscopic examination, visual acuity test, tonometry, fundic examination (retinal photography), and hearing assessment. Details of the subjects’ medical histories and levels of alcohol consumption were obtained by interview with a doctor. Definition of insulin resistance Insulin resistance was defined using the homeostasis model assessment-insulin resistance (HOMA-IR) score, which was calculated as follows: {[fasting glucose (mg/ dL)×fasting insulin (μU/mL)]/405}. A score of ≥2.5 was the threshold for insulin resistance. Definition of risk factors We included the following eight potential risk factors: alcohol overuse (>20 g ethanol/day), hypertension (systolic blood pressure (SBP) ≥130 mmHg, diastolic blood pressure (DBP) ≥85 mmHg, and/or current drug treatment), elevated low-density lipoprotein cholesterol (LDL-C) (LDL-C ≥140 mg/dL and/or current drug treatment), hyperinsulinemia (serum insulin ≥13 μIU/ mL), metabolic syndrome (diagnosed using the 2005 guidelines of the Evaluation Committee on Diagnostic Criteria for Metabolic Syndrome of Japan)16 , hyperuricemia (uric acid >7 mg/dL and/or current drug treatment), impaired renal function (estimated glomerular filtration rate [eGFR] < 60 mL/min/ 1 . 73 m 2 ), and NAFLD (fatty liver in the absence of either hepatitis C or hepatitis B infection and without alcohol consumption >20 g ethanol/day). Moreover, metabolic syndrome diagnosis required the presence of central obesity and at least two of the following: hypertension, prior treatment for hypertension and dyslipidemia, prior treatment for dyslipidemia and impaired fasting glucose (IFG), or 10 ( 10 ). prior treatment for diabetes mellitus. Central obesity was defined as a waist circumference ≥85 cm for men and ≥90 cm for women; hypertension, as SBP ≥130 mmHg; dyslipidemia, as serum triglycerides ≥150 mg/ dL and/or high-density lipoprotein cholesterol (HDL-C) <40 mg/dL; and IFG, as glucose levels ≥110 mg/dL). Definition of fatty liver Fatty liver was confirmed by abdominal ultrasonography with findings of either high hepato-renal echo contrast, liver brightness, or deep attenuation. In this study, computerized tomography (CT) was not performed. In a previous study, ultrasonography enabled the diagnosis of fatty liver with high accuracy, using a total area of hepatic steatosis exceeding 20% 17 . CT and magnetic resonance imaging (MRI) only allow identification of moderate or severe fat accumulation, with the total area displaying hepatic steatosis exceeding approximately >30% 18 . Ultrasound is better than CT and MRI for simple diagnosis of hepatic steatosis 19 . Accordingly, we diagnosed fatty liver using ultrasonography in this study. Statistical analysis Statistical analysis was performed using IBM SPSS version 26.0 (IBM Corp., Armonk, NY). Continuous variables were expressed as means (standard deviation) per group. Statistical difference was determined by twosided Student’s t-tests (for equal variance) or Welch’s ttest (for unequal variance). Non-normally distributed variables were compared by the Mann–Whitney U test. Variables reported as proportions were compared using the chi-square test. The relationships between risk factors and NAFLD or hyperuricemia were examined by multivariate logistic regression analysis, reporting odds ratios (ORs). A p value <0.05 was considered statistically significant. Moreover, variables that were included into the models were based on the existing knowledge of risk factors for NAFLD or hyperuricemia and impaired renal function. The variables considered in the models were age, sex, metabolic syndrome, HOMA-IR, and impaired renal function for NAFLD. For hyperuricemia, the variables considered in the models were age, sex, metabolic syndrome, dyslipidemia, hyperinsulinemia, alcohol overuse, and impaired renal function.. Results. Study population We included 420 subjects. Of these, 294 were males aged 64 . 8 (standard deviation 12 . 0 ) years and 126 were females aged 64 . 2 (standard deviation 11 . 4 ) years. NAFLD and hyperuricemia were detected in 100 ( 23.8%) and 192 ( 45.7%) subjects, respectively. Overall, 25.5% of males and 19.8% of females had NAFLD, while 59.5% of males and 13.5% of females had hyperuricemia.. Ningen Dock International Vol.8 No.1 2021.
(3) Shiga, et al. : Roles of NAFLD and HU in Lifestyle-related Diseases prevalence. 50% 40% 30% Males. 20%. Females Males and females. 10%. 0%. age. Fig. 1. Age- and Sex-Specific Proportions of NAFLD NAFLD: nonalcoholic fatty liver disease. prevalence 80%. Males. 70%. Females. 60%. Males and females. 50% 40% 30%. 20% 10% 0%. 30~39 40~49 50~59 60~69 70~79 ≧80. age. Fig. 2. Age- and Sex-Specific Proportions of Hyperuricemia. Fig. 1 shows the age- and sex-specific rates of NAFLD. The prevalence in females tended to increase gradually with age, whereas the difference in agespecific rates was not remarkable in males. Fig. 2 shows the age- and sex-specific proportions of hyperuricemia. The prevalence in females tended to rise gradually with age after 50 years old, whereas the difference in agespecific proportion was not remarkable in males. In the study of Ozaki et al. 20 , serum uric acid level increased after menopause in females. Clinical characteristics and risk factors for NAFLD Table 1 shows the clinical characteristics of 100 subjects with NAFLD (NAFLD group) and 320 without NAFLD (non-NAFLD group). Notably, SBP, DBP, triglyceride, uric acid, fasting plasma glucose, HbA1c, fasting plasma insulin, HOMA-IR, and waist circumference were significantly higher whereas HDL-C was significantly lower in the NAFLD group than in the nonNAFLD group. To identify the risk factors that were significantly associated with NAFLD, we performed. a contingency table analysis between the NAFLD and non-NAFLD groups using multivariate logistic regression analysis. The analysis showed that HOMA-IR ≥2.5 (OR= 2.779 , p= 0.001 ), hyperuricemia (OR= 2.025, p= 0 . 013 ) , and metabolic syndrome ( OR= 1 . 949 , p=0.015 ) are statistically significant risk factors for NAFLD (Table 2 ). We further investigated which risk factors, including components of metabolic syndrome (i.e., central obesity and hypertension, central obesity and dyslipidemia, and central obesity and IFG), were significantly related to NAFLD. We performed a contingency table analysis between the NAFLD and non-NAFLD groups using multivariate logistic regression analysis. We found that, in addition to hyperuricemia (OR=2.145, p=0.007 ), central obesity and IFG (OR=2.039, p=0.017 ) are statistically significant risk factors for NAFLD (Table 3 ). Clinical characteristics and risk factors for hyperuricemia Table 4 shows the clinical characteristics of 192 subjects with hyperuricemia (hyperuricemia group) and 228 subjects without hyperuricemia (non-hyperuricemia group). Male sex, SBP, DBP, triglyceride, fasting plasma glucose, HbA1c, fasting plasma insulin, HOMA-IR, NAFLD, and waist circumference were significantly higher whereas HDL-C and eGFR were significantly lower in the hyperuricemia group than in the non-hyperuricemia group. To determine the risk factors that were significantly associated with hyperuricemia, we performed a contingency table analysis between the hyperuricemia and non-hyperuricemia groups using multivariate logistic regression. The analysis revealed that male sex (OR=7.375, p<0.0001 ), dyslipidemia ( high LDL-C )( OR= 1 . 714 , p= 0 . 030 ) , hyperinsu linemia (OR=3.552, p=0.038 ), NAFLD (OR=3.640, p<0.0001 ), eGFR <60 mL/min/1.73 m 2 (OR=4.454, p<0.0001 ), and alcohol overuse (OR=2.614, p=0.001 ) are statistically significant risk factors for hyperuricemia (Table 5 ). We further investigated the risk factors that were significantly related to hyperuricemia, including components of metabolic syndrome (i.e., central obesity and hypertension, central obesity and dyslipidemia (low HDL-C and/or high triglycerides), and central obesity and IFG). We performed a contingency table analysis between the hyperuricemia and non-hyperuricemia groups using multivariate logistic regression. Male sex (OR= 6 . 724 , p< 0 . 0001 ), NAFLD (OR= 3 . 632 , p<0.0001 ), eGFR <60 mL/min/1.73 m 2 (OR=4.677, p<0.0001 ), alcohol overuse (OR=2. 435, p=0.002 ), and the presence of central obesity and dyslipidemia (low HDL-C and/or high triglycerides)(OR=1. 825 , p=0.045 ) were statistically significant risk factors for hyperuricemia (Table 6 ).. Ningen Dock International Vol.8 No.1 2021. 11 ( 11 ).
(4) Table 1. Clinical Data of Subjects with or without NAFLD Characteristics Age Sex, male/female Systoric blood pressure (mmHg) Diastolic blood pressure (mmHg) Total cholesterol (mg/dL) LDL cholesterol (mg/dL) HDL cholesterol (mg/dL) Triglyceride (mg/dL) Uric acid (mg/dL) FPG (mg/dL) HbA1c (%) Fasting plasma insulin ( μ IU/mL) HOMA-IR eGFR Waist circumference (cm). Subjects with NAFLD Subjects without NAFLD Mean (Standard deviation) [Number] 64.2 ( 12.2 ) [100] 64.7 ( 11.7 ) [320] [75/25] [219/101] 129.6 ( 17.1 ) [100] 123.0 ( 17.5 ) [320] 78.5 ( 10.9 ) [100] 75.4 ( 11.7 ) [320] 199.4 ( 31.1 )[100] 203.5 ( 35.6 ) [320] 120.6 ( 26.6 ) [100] 116.9 ( 29.3 ) [320] 55.2 ( 12.7 ) [100] 66.2 ( 18.6 ) [320] 130.5 ( 67.8 ) [100] 111.6 ( 71.8 ) [320] 6.1 ( 1.3 ) [100] 5.6 ( 1.3 ) [320] 108.7 ( 16.7 ) [100] 104.7 ( 16.8 ) [320] 6.2 ( 0.7 ) [100] 5.9 ( 0.5 ) [320] 7.7 ( 4.6 ) [100] 5.0 ( 3.4 ) [320] 2.1 ( 1.4 ) [100] 1.3 ( 1.0 ) [320] 67.6 ( 14.2 ) [100] 68.2 ( 14.6 ) [320] 92.2 ( 8.4 ) [100] 84.9 ( 9.3 ) [320]. p value 0.718 0.197 0.001 0.017 0.310 0.253 <0.0001 0.021 0.001 0.037 <0.0001 <0.0001 <0.0001 0.748 <0.0001. Results are shown as mean (standard deviation). NAFLD: nonalcoholic fatty liver disease, LDL: low-density lipoprotein, HDL: high-density lipoprotein, FPG: fasting plasma glucose, HbA1c: hemoglobin A1c, HOMA-IR: homeostasis model assessment-insulin resistance, eGFR: estimated glomerular filtration rate.. Table 2. Multivariate Logistic Regression Analysis of Risk Factors for NAFLD Subjects with NAFLD Subjects without NAFLD Adjusted OR (n=100 ) (n=320 ) Number (%) Aging (over 60 years old) 67 ( 67.0 ) 210 ( 65.6 ) 1.121 Male 75 ( 75.0 ) 219 ( 68.4 ) 0.738 Female 25 ( 25.0 ) 101 ( 31.6 ) HOMA-IR ≥ 2.5 29 ( 29.0 ) 31 ( 9.7 ) 2.779 HU 60 ( 60.0 ) 132 ( 41.3 ) 2.025 eGFR<60 26 ( 26.0 ) 90 ( 28.1 ) 0.614 MetS 46 ( 46.0 ) 81 ( 25.3 ) 1.949 Characteristics. p value. 95% CI. 0.662–1.900 0.670 0.401–1.361 0.331 1.513–5.102 1.163–3.524 0.343–1.099 1.140–3.331. 0.001 0.013 0.101 0.015. NAFLD: nonalcoholic fatty liver disease, OR: odds ratio, CI: confidence interval, HOMA-IR: homeostasis model assessmentinsulin resistance, HU: hyperuricemia, eGFR: estimated glomerular filtration rate, MetS: metabolic syndrome.. Table 3. Further Multivariate Logistic Regression Analysis of Risk Factors for NAFLD Characteristics Aging (over 60 years old) Male Female HU eGFR<60 Central obesity and hypertension Central obesity and dyslipidemia (low HDL-C and/or high TG) Central obesity and IFG. Subjects with NAFLD Subjects without NAFLD Adjusted OR (n=100 ) (n=320 ) Number (%) 67 ( 67.0 ) 210 ( 65.6 ) 1.067 75 ( 75.0 ) 219 ( 68.4 ) 0.704 25 ( 25.0 ) 101 ( 31.6 ) 60 ( 60.0 ) 132 ( 41.3 ) 2.145 26 ( 26.0 ) 90 ( 28.1 ) 0.628 52 ( 52.0 ) 103 ( 32.2 ) 1.562. 95% CI. p value. 0.630–1.808 0.809 0.380–1.303 0.264 1.235–3.724 0.007 0.352–1.121 0.116 0.849–2.875 0.152. 48 ( 48.0 ). 95 ( 29.7 ). 1.249. 0.686–2.275 0.467. 34 ( 34.0 ). 49 ( 15.3 ). 2.039. 1.139–3.650 0.017. NAFLD: nonalcoholic fatty liver disease, OR: odds ratio, CI: confidence interval, HU: hyperuricemia, eGFR: estimated glomerular filtration rate, HDL-C: high-density lipoprotein cholesterol, TG: triglyceride, IFG: impaired fasting glucose.. Discussion. In this study, we investigated the relationship between NAFLD and hyperuricemia with regard to metabolic syndrome. Previous studies reported that insulin resistance results in abnormal glucose metabolism in both NAFLD 21 and liver cirrhosis 22 . Supporting these reports, our study confirmed that components 12 ( 12 ). of metabolic syndrome (central obesity and IFG) are statistically significant risk factors for NAFLD (Table 3 ). Furthermore, HOMA-IR level ≥2.5, which is used to indicate insulin resistance, was also a statistically significant risk factor for NAFLD. Insulin resistance in the liver inhibits the glycolytic pathway, activates the pentose phosphate cycle, and thus accelerates purine. Ningen Dock International Vol.8 No.1 2021.
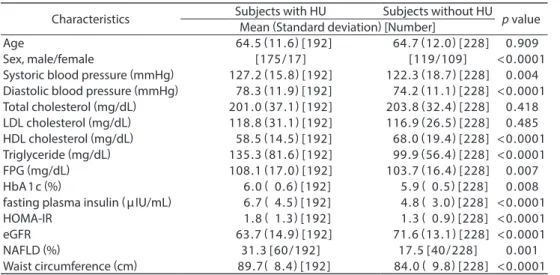
(5) Shiga, et al. : Roles of NAFLD and HU in Lifestyle-related Diseases Table 4. Clinical Data of Subjects with or without Hyperuricemia Characteristics Age Sex, male/female Systoric blood pressure (mmHg) Diastolic blood pressure (mmHg) Total cholesterol (mg/dL) LDL cholesterol (mg/dL) HDL cholesterol (mg/dL) Triglyceride (mg/dL) FPG (mg/dL) HbA1c (%) fasting plasma insulin ( μ IU/mL) HOMA-IR eGFR NAFLD (%) Waist circumference (cm). Subjects with HU Subjects without HU Mean (Standard deviation) [Number] 64.5 ( 11.6 ) [192] 64.7 ( 12.0 ) [228] [175/17] [119/109] 127.2 ( 15.8 ) [192] 122.3 ( 18.7 ) [228] 78.3 ( 11.9 ) [192] 74.2 ( 11.1 ) [228] 201.0 ( 37.1 ) [192] 203.8 ( 32.4 ) [228] 118.8 ( 31.1 ) [192] 116.9 ( 26.5 ) [228] 58.5 ( 14.5 ) [192] 68.0 ( 19.4 ) [228] 135.3 ( 81.6 ) [192] 99.9 ( 56.4 ) [228] 108.1 ( 17.0 ) [192] 103.7 ( 16.4 ) [228] 6.0 ( 0.6 ) [192] 5.9 ( 0.5 ) [228] 6.7 ( 4.5 ) [192] 4.8 ( 3.0 ) [228] 1.8 ( 1.3 ) [192] 1.3 ( 0.9 ) [228] 63.7 ( 14.9 ) [192] 71.6 ( 13.1 ) [228] 31.3 [60/192] 17.5 [40/228] 89.7 ( 8.4 ) [192] 84.0 ( 9.8 ) [228]. p value 0.909 <0.0001 0.004 <0.0001 0.418 0.485 <0.0001 <0.0001 0.007 0.008 <0.0001 <0.0001 <0.0001 0.001 <0.0001. Results are shown as mean (standard deviation). HU: hyperuricemia, LDL: low-density lipoprotein, HDL: highdensity lipoprotein, FPG: fasting plasma glucose, HbA 1 c: hemoglobin A 1 c, HOMA-IR: homeostasis model assessment-insulin resistance, eGFR: estimated glomerular filtration rate, NAFLD: nonalcoholic fatty liver disease.. Table 5. Multivariate Logistic Regression Analysis of Risk Factors for Hyperuricemia Subjects with HU Subjects without HU Adjusted OR (n=192 ) (n=228 ) Number (%) Aging (over 60 years old) 125 ( 65.1 ) 152 ( 66.7 ) 0.660 Male 175 ( 91.1 ) 119 ( 52.2 ) 7.375 Female 17 ( 8.9 ) 109 ( 47.8 ) Dyslipidemia (high LDL cholesterol) 121 ( 63.0 ) 109 ( 47.8 ) 1.714 Hyperinsulinemia 18 ( 9.4 ) 5 ( 2.2 ) 3.552 eGFR<60 76 ( 39.6 ) 40 ( 17.5 ) 4.454 MetS 83 ( 43.2 ) 44 ( 19.3 ) 1.195 NAFLD 60 ( 31.3 ) 40 ( 17.5 ) 3.640 Alcohol overuse 85 ( 44.3 ) 71 ( 31.1 ) 2.614 Characteristics. 95% CI. p value. 0.395–1.103 0.113 3.948–13.776 <0.0001 1.053–2.787 0.030 1.073–11.757 0.038 2.504–7.924 <0.0001 0.692–2.061 0.523 1.915–6.920 <0.0001 1.463–4.670 0.001. HU: hyperuricemia, OR: odds ratio, CI: confidence interval, LDL: low-density lipoprotein, eGFR: estimated glomerular filtration rate, MetS: metabolic syndrome, NAFLD: nonalcoholic fatty liver disease.. Table 6. Further Multivariate Logistic Regression Analysis of Risk Factors for Hyperuricemia Characteristics Aging (over 60 years old) Male Female eGFR<60 Central obesity and hypertension Central obesity and dyslipidemia (low HDL-C and/or high TG) Central obesity and IFG NAFLD Alcohol overuse. Subjects with HU Subjects without HU Adjusted OR (n=192 ) (n=228 ) Number (%) 125 ( 65.1 ) 152 ( 66.7 ) 0.651 119(52.2) 6.724 175(91.1) 17 ( 8.9 ) 109 ( 47.8 ) 76 ( 39.6 ) 40 ( 17.5 ) 4.677 96 ( 50.1 ) 59 ( 25.9 ) 1.021. 95% CI. p value. 0.390–1.085 0.100 3.618–12.497 <0.0001 2.624–8.335 <0.0001 0.554–1.880 0.947. 93 ( 48.4 ). 50 ( 21.9 ). 1.825. 1.014–3.284. 51 ( 26.6 ) 60 ( 31.3 ) 85 ( 44.3 ). 32 ( 14.0 ) 40 ( 17.5 ) 71 ( 31.1 ). 1.091 3.632 2.435. 0.592–2.011 0.781 1.914–6.891 <0.0001 1.369–4.332 0.002. 0.045. HU: hyperuricemia, OR: odds ratio, CI: confidence interval, eGFR: estimated glomerular filtration rate, HDL-C: high-density lipoprotein cholesterol, TG: triglyceride, IFG: impaired fasting glucose, NAFLD: nonalcoholic fatty liver disease.. synthesis and uric acid production via the liver 23,24 . Notably, insulin resistance in patients with metabolic syndrome induces compensatory hyperinsulinemia, which, in chronic cases, induces sodium reabsorption from the proximal convoluted tubules of the kidneys thereby. promoting uric acid reabsorption. Moreover, we found that central obesity and dyslipidemia (low HDL-C and/or high triglycerides), which are components of metabolic syndrome, and high LDL-C are statistically significant risk factors for hyperurice-. Ningen Dock International Vol.8 No.1 2021. 13 ( 13 ).
(6) mia (Table 5 and 6 ). Subjects with visceral obesity have been reported to show increased uric acid production and serum uric acid levels 25,26 . Visceral fat accumulation increases serum uric acid levels through the following mechanism: in subjects with visceral obesity, excessive free fatty acids in the portal vein stimulate the overproduction of very low-density lipoprotein, which in turn leads to hypertriglyceridemia. Hypertriglyceridemia activates the pentose phosphate cycle through the nicotinamide adenine dinucleotide phosphate pathway and consequently increases the production of uric acid 20, 27 . Hyperuricemia is a mediator of proinflammatory endocrine imbalance in the adipose tissue and thus is a potential underlying factor for dyslipidemia, inflammation, and subsequent atherogenesis 28 . A previous study showed a significant positive relationship between serum uric acid levels and triglyceride, total cholesterol, and LDL-C levels, with an inverse relationship with HDL-C 29 . Concurrent dyslipidemia and hyperuricemia have also been reported 30–32 . Furthermore, we also found that hyperuricemia has a statistically significant relationship with hyperinsulinemia (Table 5 ), which is consistent with the finding of Tanabe et al. 33 . Hyperuricemia and insulin resistance mutually amplify each other, and both are assumed to promote arteriosclerosis. In this study, we emphasize the need for early prevention of hyperuricemia, dyslipidemia, central obesity (visceral obesity), and hyperinsulinemia with both medication and lifestyle modification (healthy diet, exercise, and restricted drinking) to reduce the incidence of associated arteriosclerotic diseases. Renal dysfunction was another risk factor associated with hyperuricemia (Table 5 and 6 ), which is an interesting finding given the recent evidence that uric acid is a risk factor for renal dysfunction 34 . Notably, both hyperuricemia and gout have renal dysfunction and renal stone development as complications. Some studies have shown that uric acid-lowering therapies in patients with both hyperuricemia and renal dysfunction could improve renal function 35–38 . Furthermore, we showed that the prevalence of hyperuricemia among females tended to increase gradually after the age of 50 years (Fig. 2 ). Urate resorptive transporters are important for uric acid reabsorption and urate transporter 1 is suppressed by estrogen. Thus, increased serum urate levels in postmenopausal females in our study possibly reflected the change in renal urate elimination associated with loss of female hormones 39 . In addition, we also showed that the NAFLD prevalence among females tended to rise gradually with age, whereas the rate of NAFLD in men remained almost unchanged. These results suggest an influence of female hormones on fatty liver development. Estrogen sup14 ( 14 ). presses visceral fat accumulation and increases subcutaneous fat accumulation 40 . Hence, a decrease in estrogen activity may promote visceral fat accumulation, thereby resulting in fatty liver development 41 . Based on our results, hyperuricemia was a significant risk factor for NAFLD (Table 2 and 3 ), which is consistent with the available clinical evidence suggesting that hyperuricemia is significantly related to NAFLD. Lombardi et al. 42 reported that serum uric acid levels mainly contribute to NAFLD pathogenesis through insulin resistance 43 , production of radical oxygen species 44 , and activation of the Nod-like receptor pyrin domain-containing protein 3 inflammasome 45–47 . Hyperuricemia may cause insulin resistance by reducing endothelial nitric oxide bioavailability 43 . Additionally, uric acid may be produced by fructose metabolism and may induce hepatic steatosis in the liver through mitochondrial oxidative stress 48–51 . Uric acid is a strong environmental oxidant in metabolic syndrome, and hyperuricemia could stimulate nicotinamide adenine dinucleotide phosphate oxidase and directly contribute to NAFLD pathogenesis 52 . Generally, serum uric acid could regulate lipid production and facilitate the onset of metabolic disorders and NAFLD through multifaceted pathways 53 . Our data further indicated that NAFLD is an independent risk factor for hyperuricemia. However, the specific NAFLD pathogenesis inducing high serum uric acid levels remains to be clearly established. Nevertheless, inflammatory cells may infiltrate hepatic and fatty tissues, and subsequently nucleic acids may be released from hepatocytes undergoing apoptosis, which in turn produces an environment that is conducive to hyperuricemia development 54 . Hyperuricemia and NAFLD are related to one another and either of the two is related to metabolic syndrome, insulin resistance, dyslipidemia, renal dysfunction, and various lifestyle factors. On this basis, it is plausible that we should aim to treat these conditions with both medication and lifestyle advice.. Conclusion. In conclusion, hyperuricemia and NAFLD are related and both are associated with metabolic syndrome and other lifestyle-related diseases. Thus, an effective treatment of NAFLD and hyperuricemia requires both medical therapy and lifestyle changes.. Conflict of Interest. The authors have no conflict of interest to declare.. References. 1. Donati G, Stagni B, Piscaglia F, et al.: Increased prevalence of fatty liver in arterial hypertensive patients with normal. Ningen Dock International Vol.8 No.1 2021.
(7) Shiga, et al. : Roles of NAFLD and HU in Lifestyle-related Diseases. 2.. 3.. 4. 5.. 6.. 7. 8. 9.. 10.. 11.. 12.. 13. 14. 15. 16. 17. 18.. liver enzymes: role of insulin resistance. Gut 2004 ; 53 : 1020–1023. Fan JG, Saibara T, Chitturi S, et al.: Asia-Pacific Working Party for NAFLD. What are the risk factors and settings for non-alcoholic fatty liver disease in Asia-Pacific? J Gastroenterol Hepatol 2007; 22: 794–800. Hashimoto E, Tokushige K, Ludwig J: Diagnosis and classification of non-alcoholic fatty liver disease and nonalcoholic steatohepatitis: current concepts and remaining challenges. Hepatol Res 2015; 45: 20–28. Hamaguchi M, Kojima T, Takeda N, et al.: The metabolic syndrome as a predictor of nonalcoholic fatty liver disease. Ann Intern Med 2005; 143: 722–728. Omagari K, Kadokawa Y, Masuda J, et al.: Fatty liver in nonalcoholic non-overweight Japanese adults: incidence and clinical characteristics. J Gastroenterol Hepatol 2002; 17: 1098–1105. Eguchi Y, Hyogo H, Ono M, et al.: Prevalence and associated metabolic factors of nonalcoholic fatty liver disease in the general population from 2009 to 2010 in Japan: a multicenter large retrospective study. J Gastroenterol 2012; 47: 586–595. Day CP, James O: Steatohepatitis: a tale of two “ hits ”. Gastroenterology 1998; 114: 842–845. Angulo P: Nonalcoholic fatty liver disease. N Engl J Med 2002; 346: 1221–1231. Sargin M, Uygur-Bayramiçli O, Sargin H, et al.: Association of nonalcoholic fatty liver disease with insulin resistance. Is OGTT indicated in nonalcoholic fatty liver disease? J Clin Gastroenterol 2003; 37: 399–402. Lee JH: Prevalence of hyperuricemia and its association with metabolic syndrome and cardiometabolic risk factors in Korean children and adolescents: analysis based on the 2016 – 2017 Korea National Health and Nutrition Examination Survey. Korean J Pediatr 2019; 62: 317–323. López-Suárez A, Elvira-González J, Bascuñana-Quirell A, et al.: Serum urate levels and urinary uric acid excretion in subjects with metabolic syndrome. Med Clin (Barc). 2006; 126: 321–324. (in Spanish) Strazzullo P, Barbato A, Galletti F, et al.: Abnormalities of renal sodium handling in the metabolic syndrome. Results of the Olivetti Heart Study. J Hypertens 2006; 24: 1633– 1639. Puig JG, Ruilope LM: Uric acid as a cardiovascular risk factor in arterial hypertension. J Hypertens 1999; 17: 869– 872. Strazzullo P, Puig JG: Uric acid and oxidative stress: relative impact on cardiovascular risk. Nutr Metab Cardiovasc Dis 2007; 17: 409–414. Puig JG, Martínez MA: Hyperuricemia, gout and the metabolic syndrome. Curr Opin Rheumatol 2008; 20: 187– 191. Matsuzawa Y: Metabolic syndrome-definition and diagnostic criteria in Japan. J Atheroscler Thromb 2005; 12: 301. Dasarathy S, Dasarathy J, Khiyami A, et al.: Validity of real time ultrasound in the diagnosis of hepatic steatosis: a prospective study. J Hepatol 2009; 51: 1061–1067. Saadeh S, Younossi ZM, Remer EM, et al.: The utility of radiological imaging in nonalcoholic fatty liver disease. Gastroenterology 2002; 123: 745–750.. 19. Atarashi T: Fatty liver in the medical check-ups. Recent topics. Ningen Dock 2017; 32: 7–16. (in Japanese) 20. Ozaki S, Atarashi K, Minami M, et al.: Effects of aging and body weight changes on serum uric acid. Ningen Dock 2008; 22: 43–48. 21. Utzschneider KM, Kahn SE: Review: the role of insulin resistance in nonalcoholic fatty liver disease. J Clin Endocrinol Metab 2006; 91: 4753–4761. 22. Selberg O, Burchert W, J vd Hoff, et al.: Insulin resistance in liver cirrhosis. Positron-emission tomography scan analysis of skeletal muscle glucose metabolism. J Clin Invest 1993; 91: 1897–1902. 23. Matsuura F, Yamashita S, Nakamura T, et al.: Effect of visceral fat accumulation on uric acid metabolism in male obese subjects: visceral fat obesity is linked more closely to overproduction of uric acid than subcutaneous fat obesity. Metabolism 1998; 47: 929–933. 24. Masuzaki H, Nakamura H, Ikema T: Pathophysiology and clinical implication of asymptomatic hyperuricemia in metabolic syndrome. The Bone 2012 ; 26 : 317 –321. (in Japanese) 25. Matsuura F, Yamashita S, Nakamura T, et al.: Effect of visceral fat accumulation on uric acid metabolism in male obese subjects: visceral fat obesity is linked more closely to overproduction of uric acid than subcutaneous fat obesity. Metabolism 1998; 47: 929–933. 26. Takahashi S, Yamamoto T, Tsutsumi Z, et al.: Close correlation between visceral fat accumulation and uric acid metabolism in healthy men. Metabolism 1997; 46: 1162– 1165. 27. Fabregat I, Revilla E, Machado A: Short-term control of the pentose phosphate cycle by insulin could be modulated by the NADPH/NADP ratio in rat adipocytes and hepatocytes. Biochem Biophys Res Commun 1987; 146: 920–925. 28. Baldwin W, McRae S, Marek G, et al.: Hyperuricemia as a mediator of the proinflammatory endocrine imbalance in the adipose tissue in a murine model of the metabolic syndrome. Diabetes 2011; 60: 1258–1269. 29. Ali N, Rahman S, Islam S, et al.: The relationship between serum uric acid and lipid profile in Bangladeshi adults. BMC Cardiovasc Disord 2019; 19: 42. 30. Lippi G, Montagnana M, Luca Salvagno G, et al.: Epidemiological association between uric acid concentration in plasma, lipoprotein(a), and the traditional lipid profile. Clin Cardiol 2010; 33: E76–E80. 31. Sarmah D, Sharma B: A correlative study of uric acid with lipid profile. Asian J Med Sci 2013; 4: 8–14. 32. Peng TC, Wang CC, Kao TW, et al.: Relationship between hyperuricemia and lipid profiles in US adults. Biomed Res Int 2015; 2015:127596. 33. Tanabe M, Arase Y, Tsuji H, et al.: Relationship between hyperuricemia and hyperinsulinemia. Ningen Dock 2012; 27: 603–610. (in Japanese) 34. Nakagawa T: Chronic kidney disease and hyperuricemia. The Medical Frontline 2016; 71: 2421–2426. (in Japanese) 35. Perez-Ruiz F, Calabozo M, Fernandez-Lopez MJ, et al.: Treatment of chronic gout in patients with renal function impairment an open, randomized, actively controlled study. J Clin Rheumatol 1999; 5: 49–55. 36. Tarng DC, Lin HY, Shyong ML, et al.: Renal function in gout. Ningen Dock International Vol.8 No.1 2021. 15 ( 15 ).
(8) patients. Am J Nephrol 1995; 15: 31–37. 37. Perez-Ruiz F, Calabozo M, Herrero-Beites AM, et al.: Improvement of renal function in patients with chronic gout after proper control of hyperuricemia and gouty bouts. Nephron 2000; 86: 287–291. 38. Whelton A, Macdonald PA, Zhao L, et al.: Renal function in gout: long-term treatment effects of febuxostat. J Clin Rheumatol 2011; 17: 7–13. 39. Takiue Y, Hosoyamada M, Kimura M, et al.: The effect of female hormones upon urate transport systems in the mouse kidney. Nucleosides Nucleotides Nucleic Acids 2011; 30: 113–119. 40. Yoshida S, Inadera H, Ishikawa Y, et al.: Endocrine disorders and body fat distribution. Int J Obes 1991; Suppl 2: 37–40. 41. Kojima S, Watanabe N, Numata M, et al.: Increase in the prevalence of fatty liver in Japan over the past 12 years: analysis of clinical background. J Gastroenterol 2003; 38: 954–961. 42. Lombardi R, Pisano G, Fargion S: Role of serum uric acid and ferritin in the development and progression of NAFLD. Int J Mol Sci 2016; 17: 548. 43. Li C, Hsieh MC, Chang SJ: Metabolic syndrome, diabetes, and hyperuricemia. Curr Opin Rheumatol 2013; 25: 210– 216. 44. Zhu Y, Hu Y, Huang T, et al.: High uric acid directly inhibits insulin signalling and induces insulin resistance. Biochem Biophys Res Commun 2014; 447: 707–714. 45. Vandanmagsar B, Youm YH, Ravussin A, et al.: The NLRP3 inflammasome instigates obesity-induced inflammation and insulin resistance. Nat Med 2011; 17: 179–188. 46. Yang C, Yang S, Feng C, et al.: Associations of hyperuricemia and obesity with remission of nonalcoholic fatty liver disease among Chinese men: a retrospective cohort study. PLoS One. 16 ( 16 ). 2018; 13: e0192396. 47. Yang C, Yang S, Xu W, et al.: Association between the hyperuricemia and nonalcoholic fatty liver disease risk in a Chinese population: a retrospective cohort study. PLoS One 2017; 12: e0177249. 48. Kohno H, Katoh S, Ohkubo Y, et al.: Inhibition by sodium citrate on 67 Ga adsorption to various materials. Radioisotopes 1990; 39: 20–23. 49. Ackerman Z, Oron-Herman M, Grozovski M, et al.: Fructose-induced fatty liver disease: hepatic effects of blood pressure and plasma triglyceride reduction. Hypertension 2005; 45: 1012–1018. 50. Wan X, Xu C, Lin Y, et al.: Uric acid regulates hepatic steatosis and insulin resistance through the NLRP 3 inflammasome-dependent mechanism. J Hepatol 2016; 64: 925–932. 51. Lanaspa MA, Sanchez-Lozada LG, Cicerchi C, et al.: Uric acid stimulates fructokinase and accelerates fructose metabolism in the development of fatty liver. PLoS One 2012; 7: e47948. 52. Liu J, Xu C, Ying L, et al.: Relationship of serum uric acid level with non-alcoholic fatty liver disease and its inflammation progression in non-obese adults. Hepatol Res 2017; 47: E104–E112. 53. Zheng X, Gong L, Luo R, et al.: Serum uric acid and nonalcoholic fatty liver disease in non-obesity Chinese adults. Lipids Health Dis 2017; 16: 202. 54. Keyama S, Nishihara T: Hyperuricemia and non-alcoholic fatty liver (NAFL). Hyperuricemia and Gout 2017; 25: 184– 187. (in Japanese) (Received November 6, 2019 ; Accepted March 5, 2020). Ningen Dock International Vol.8 No.1 2021.
(9)
図


関連したドキュメント
This research was an observational cohort study under routine healthcare; it did not specify what inter- ventions, such as medication or patient guidance, were to be used during
To confirm the relationship between the fall risk assess- ment items and risk factors assumed in this study (to sta- tistically confirm component items of each risk factor),
Methods: Organ-specific IR in the liver (hepatic glucose production (HGP)6 fasting plasma insulin (FPI) and suppression of HGP by insulin [%HGP]), skeletal muscle
201 Tl distribution inhibiting the Sol antigravitational activation. However factors other than muscle activity may be involved in low blood perfusion seen in Sol of the U3w group.
The effect of hyperbaric oxygen treatment (HBOT) was examined using MSG mice, which are an animal model of obesity, hyperlipidemia, diabetes, and nonalcoholic fatty liver
Reference mortgage portfolio Selected, RMBS structured credit reference portfolio risk, market valuation, liquidity risk, operational misselling, SIB issues risk, tranching
The specific risk types related to our study are intrinsic, reserve and depository risk that are associated with the cumulative cost of the bank provisioning strategy, reserve
The only thing left to observe that (−) ∨ is a functor from the ordinary category of cartesian (respectively, cocartesian) fibrations to the ordinary category of cocartesian
