www.astesj.com 105
An Electroencephalogram Analysis Method to Detect Preference Patterns Using Gray Association
Degrees and Support Vector Machines
Shin-ichi Ito*, Momoyo Ito, Minoru Fukumi
Department of Science and Technology, Faculty of Science and Technology, Tokushima University, 770-8506, Japan
A R T I C L E I N F O A B S T R A C T
Article history:
Received: 08 August, 2018 Accepted: 14 September, 2018 Online: 22 September, 2018
This paper introduces an electroencephalogram (EEG) analysis method to detect preferences for particular sounds. Our study aims to create novel brain–computer interfaces (BMIs) to control human mental (NBMICM), which are used to detect human mental conditions i.e., preferences, thinking, and consciousness, choose stimuli to control these mental conditions, and evaluate these choices. It is important to detect the preferences on stimuli. If the stimuli related to the preference can be detected, the NBCIMC can provide stimuli to the user based on their emotions by detecting their favorite stimuli. The proposed method adopted EEG recording technique, extraction techniques of EEG features and detection methods of preferences. EEG recording employs a simple electroencephalograph, for which the measurement position is the left frontal lobe (Fp1) of the brain. We assume that the differences of the EEG activities on the patterns of preference are expressed in the association between the changes of the power spectra on each frequency band of the EEG. To calculate the association, we employ the gray theory model. The EEG feature is extracted by calculating the gray association degree, then, the preferences are detect using a support vector machine (SVM). Experiments are conducted to test the effectiveness of this method, which is validated by a mean accuracy rate >88% on the favorite sound detection. These results suggest that the detection of subject’s favorite sounds becomes easy when the EEG signals are analyzed while the gray associate degrees are used as the EEG feature and the SVM is used as the classifier.
Keywords:
Electroencephalogram Preference
Favorite sounds
Simple electroencephalography Gray association degree Support vector machine
1. Introduction
This paper is an extension of a paper presented at the 2018 International Conference on Electronic, Information, and Communication (ICEIC), 2018 [1]. This paper discusses the detection of human mental state conditions, proposes a method for detecting patterns of human preferences, and contains additional discussions on comparative methods.
Recently, electroencephalogram (EEG)-based interfaces (brain–computer interfaces (BCI) and/or BMI) have gained considerable research interest in many fields. This study aims to create new BMIs to control human mental (NBMICM), which are used to detect human mental conditions e.g., preferences, thinking, consciousness, choose stimuli for controlling these mental conditions, and evaluate these choices. It is important to detect the preferences on stimuli. If the stimuli related to the preference can
be detected, the NBCIMC can provide stimuli to the user based on their emotions by detecting their favorite stimuli.
There are any approaches to analyze and detect the human preferences in previous studies. Sawata et. al. proposed the method to detect the individual favorite music by calculating the audio features of EEG signals during listening to the music [2]. In [3], the author analyzed the differences of the relationship between the ethnic groups and music preferences by detecting the preference on music using EEG signals and their analyses. In [4], the authors analyzed the relationship between the haptic preference and the Gamma EEG to detect the features of the EEG signals. However, these previous studies employed the electroencephalograph that had many electrodes to record the EEG and it may be difficult to use the interface using the EEG on daily basis [5]. This paper used a simple device that has a single dry-type electrode. The sensing position is on the left lobe. The prefrontal cortex activities are changes when a human mental state is changed [6,7], therefore, EEG activities in the prefrontal pole are variable. Furthermore, the
ASTESJ
ISSN: 2415-6698
*Shin-ichi Ito, 2-1 Minami-josanjima Tokushima Japan, +81886569858 & Email: s.ito@tokushima-u.ac.jp
Advances in Science, Technology and Engineering Systems Journal Vol. 3, No. 5, 105-108 (2018) www.astesj.com
S. Ito et al. / Advances in Science, Technology and Engineering Systems Journal Vol. 3, No. 5, 105-108 (2018)
www.astesj.com 106
EEGs of the frontal cortex activities vary from person to person [8,9]. We propose a method using single-point sensing to analyze EEGs and mitigate the adverse effects of such individual differences.
To analyze EEG activities, there are numerous approaches [10]. In [3], [4], the authors calculated the power spectrum of EEG signals to extract the features. In [11], [12], the authors employed principal component analysis for extracting EEG features [11,12]. In [13], the authors used independent component analysis to extract the features. Then, In [13,14], the researchers employed k-nearest neighbor (kNN) to detect and/or classify the EEG features. Blankertz et. al. used linear discriminant analysis (LDA) as classifier [15]. In [12], the researcher employ artificial neural networks (ANN) to classify the EEG signals. In [16], the author used self-organizing map (SOM) to recognize the human emotions. In [2], [11], [17] the authors employed support vector machine (SVM) to analyze human preference and EEG signals, respectively.
Here, we assumed that relationships among the power spectra of the frequency bands become unique when creating the preferences on stimuli and different on each preference. This paper employed the gray associate degree calculation technique [14,18] to compute the relationships. Also, the gray associate degree calculation technique can reduce the noise signals in the EEG signals because of one of statistical processing models. The SVM classifier was employed to detect the preferences because the previous studies had good results to detect the preference using the SVM. We were able to detect the subject’s preference patterns by analyzing the EEG activities during listening to certain sounds. If the stimuli are sounds and the favorite sounds are detected by analyzing the EEG signals, the NBCIMC can give user healing sounds to be comfortable blanket by detecting the favorite sounds. Finally, we conducted experiments using real EEG data for testing the effectiveness of the proposed method.
2. Proposed method
The proposed method adopted EEG recording technique, extraction techniques of EEG features and detection methods of preferences, as illustrated in Figure 1.
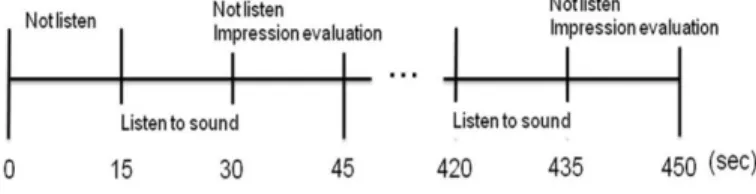
MindTune (MT) was used to record the EEG signals. This device has a dry-type sensor and a few electrodes installed in a pair of headphones. For the EEG recordings, the left ear and Fp1 in the international 10-20 system are reference and exploring electrodes, respectively (Figure 2). The timetable of each EEG recording was 15 seconds (no listening) and 15 seconds (listening to sound) as a set, as shown in Figure 3. The recorded EEG signals were transformed into the power spectra using a fast Fourier transform. Then, the power spectra on each frequency band were based on rhythm of brain activities. This paper divided into four frequency bands; theta, low-alpha, high-alpha and beta. The range of frequency bands are 4–7Hz, 8–9Hz, 10–12Hz and 13–24Hz, respectively. After the EEG recording, the subject completed an easy questionnaire on the preference evaluation of the sounds. The preference patterns were based on the responses to the questionnaire, of which the criterion and the preference patterns (indicated in parentheses) were based on whether the subject liked
Figure 1: Procedure of the proposed method.
Figure 2: International 10-20 system. Reference electrode is at left earlobe (A1) and exploring electrode is at left prefrontal pole (Fp1).
Figure 3: Timetable of each EEG recording.
(FavoriteSound), disliked (DislikeSound), or felt neutral toward, i.e., neither liked nor disliked (Other), a particular sound.
The gray associate degree was calculated to extract the EEG features based on the time variations of the power spectra on each frequency band of the EEG because we assumed that the differences of the EEG activities on the preference patterns are expressed in the association between the changes of the power spectra. The eigenvectors were calculated to extract the gray association degree from the gray relationship coefficients. We regarded the eigenvector of the greatest eigenvalue as the EEG feature. The matrices of the discrete time series data of the power spectra of the EEG frequency bands (EEG) and the gray relational coefficient (GRC) are defined as follows:
S. Ito et al. / Advances in Science, Technology and Engineering Systems Journal Vol. 3, No. 5, 105-108 (2018)
www.astesj.com 107
Figure 4: Classifier for detecting preference patterns using the SVM.
) ( ) 2 ( ) 1 ( ) ( ) 2 ( ) 1 ( ) ( ) 2 ( ) 1 ( ) ( ) 2 ( ) 1 ( T EEG EEG EEG T EEG EEG EEG T EEG EEG EEG T EEG EEG EEG EEG high high high low low low (1) 44 41 14 11 GRC (2) subject to T k ij ij R k T 1 ( ) 1 .
where EEG and T denote the power spectra and the maximum time, respectively. R is the gray relational coefficient. i and j
are the frequency bands. R is defined as
. max . max . min ) ( k R ij ij subject to ) ( ) ( . max , ) ( ) ( . min . max . min . max . min k EEG k EEG k EEG k EEG j i k i j j i k i j
where and ij indicate the distinguishing coefficient ([0,1])
and EEGi(k)EEGj(k) , respectively. EEGi(k) and EEGj(k)
denote the reference and comparison matrices, respectively. In preference detection, the kernel SVM classifier (shown in Figure 4) using the RBF kernel function was employed to detect the preference patterns because the SVM classifier was employed to detect and/or classify the EEG features in previous studies [2,11,17]. The previous studies could obtain good results using the SVM classifier. Then, this paper employed a one-versus-rest strategy for detecting the preferences. An N -fold cross-validation method was used for testing. Finally, this paper calculated the mean accuracy rate for the preference detection (MeanAc ) to confirm the effectiveness of the proposed method:
CrrectNumSampleNum N
MeanAc 1 /
where CorrectNum is the total number of correct answers
SampleNum means the total sample number.
3. Experiments
The subjects were four males (average age: 22.5 years) and one female (age: 22 years). The EEG device was positioned on the forehead of each subject. The EEG was recorded more than once in the laboratory with ongoing background noise. The subjects listened to 15 kinds of the sounds in an experiment. The sounds comprised window bells sound, helicopter noise, fire engine , grade crossing, scotch tape, cicada buzz, bush warbler buzz, mosquito, roar of waves, soda water, unwrapping the paper, fireworks, train noise, frictional noise of styrene foams and drill noise, respectively. The experiments were repeated five times for each subject, producing a total of 375 sounds that were played. Thus, T and for the EEG feature extraction were 15 and 0.5,
respectively, while C and for the kernel SVM were 25 and 12
2 , respectively. Then, the number of N for cross validation
was 5.
Table 1 shows the experimental results for the means and standard deviations of the accuracy rates of the detections of FavoriteSound (Favorite), DislikeSound (Dislike), and Other. The comparative methods, PCA, and the power spectra were used to extract the feature. The nearest neighbor (1NN) method was used as classifier to detect the preferences. The EEG features of the comparative methods were shared by the proposed method. Gray, PCA, and Freq were the gray association degrees, which were the results of the PCA and the power spectra of the EEG (Equation 1), respectively, as the EEG features. SVM and kNN were the classifiers used by SVM and 1NN, respectively, for detecting the preference patterns.
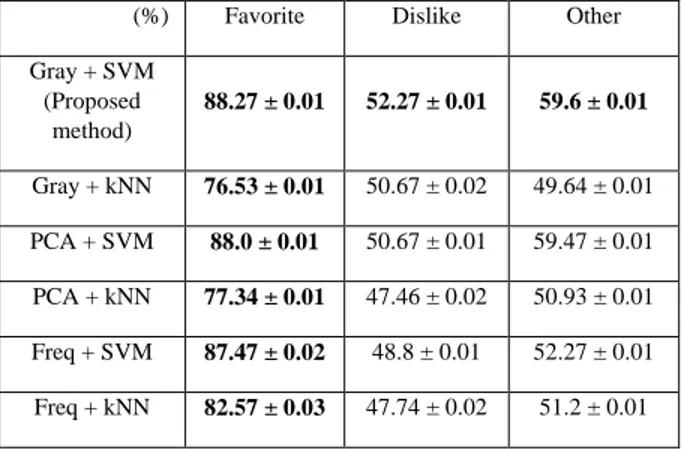
For all methods (Gray + kNN, PCA + SVM, PCA + kNN, Freq + SVM, and Freq + kNN) other than our proposed method, the mean detection accuracies of FavoriteSound were the highest with accuracies of 88.27, 76.53, 88, 77.34, 87.47 and 82.57, respectively. Using our proposed method (Gray + SVM), the mean detection accuracies of FavoriteSound, DislikeSound, and Other were the highest with accuracies of 88.27, 52.27, and 59.6, respectively, as compared with the comparative methods (Gray + kNN, PCA + SVM, PCA + kNN, Freq + SVM, and Freq + kNN). Moreover, the standard deviations of the detection accuracies of
Table 1: Means and standard deviations of the accuracy rates of detections of FavoriteSound, DislikeSound, and Other.
(%) Favorite Dislike Other Gray + SVM (Proposed method) 88.27 ± 0.01 52.27 ± 0.01 59.6 ± 0.01 Gray + kNN 76.53 ± 0.01 50.67 ± 0.02 49.64 ± 0.01 PCA + SVM 88.0 ± 0.01 50.67 ± 0.01 59.47 ± 0.01 PCA + kNN 77.34 ± 0.01 47.46 ± 0.02 50.93 ± 0.01 Freq + SVM 87.47 ± 0.02 48.8 ± 0.01 52.27 ± 0.01 Freq + kNN 82.57 ± 0.03 47.74 ± 0.02 51.2 ± 0.01
S. Ito et al. / Advances in Science, Technology and Engineering Systems Journal Vol. 3, No. 5, 105-108 (2018)
www.astesj.com 108
Favorite, Dislike, and Other were 0.03, 0.02, and 0.01, respectively. The mean detection accuracies of Dislike and Other were 60% or less.
4. Discussions
Using all methods with accuracies of 76.53% or more, we confirmed that the mean detection accuracies of FavoriteSound were the highest. These results suggest that the favorite stimuli are detected by analyzing the left frontal cortex activities because the activities of the left frontal cortex on favorite stimuli become unique. Bajoulvand et. al. showed that frontal cortex activities had a close relation to human preference because the sensing position was frontal lobe and folk music preference was analyzed based on EEG analysis [3]. Therefore, this result shows the validity of our consideration.
We confirmed that the mean detection accuracies of all preferences obtained by the proposed method were higher than those obtained by the comparative methods. These results suggest that the relationships among EEG frequency bands become unique when creating the preferences on stimuli and they are different on each preference. Therefore, the detection of a subject’s favorite sounds becomes easy when the EEG signals are analyzed while the gray associate degrees are used as the EEG feature and the SVM is used as the classifier. Sawata et. al. showed that favorite music was detected using SVM with mean accuracies of 83.6% or more, although 12 channels were used to record the EEG signals [2]. Therefore, this result shows the validity of our consideration.
The standard deviations of the detection accuracies for all methods were 0.03 or less, which suggest that the EEG signals and the standard deviations of the detection accuracies became high when the distributions of the extracted EEG features and the distributions related to each preference pattern were stable and the left frontal cortex activities related to the preference were widely varied.
The means of the detection accuracies of Dislike and Other were 60% or less, which were substantially lower than for FavoriteSound. These results suggest that detection is difficult for negative stimuli, such as DislikeSound, and borderline cases, such as Other, when the left frontal pole is the sensing position for the EEG analysis. If responses to negative stimuli and/or borderline case are detected, the sensing positions must be changed.
5. Conclusions
This paper introduced an EEG analysis method to detect human preferences. The proposed method adopted EEG recording technique, extraction techniques of EEG features and detection methods of preferences. In EEG measurement, the sensing point was Fp1 (the left frontal lobe). The gray association degree was used to extract the EEG feature and an SVM was used to detect the preferences of humans for particular sounds. In order to show the effectiveness of the proposed method, experiments were conducted with real EEG data. Using all comparative methods with accuracies of 76.53% or more, the mean detection accuracies on FavoriteSound were confirmed to be the highest while the proposed method produced higher accuracies for FavoriteSound, DislikeSound, and Other. These results suggest that the detection of subject’s favorite sounds becomes easy when the EEG signals are analyzed while the gray associate degrees are used as the EEG
feature and the SVM is used as the classifier. However, we confirmed that the detection accuracies of Dislike and Other were 60% or less, which were substantially lower than the results for the detections of FavoriteSound. These results suggest that the detection of negative stimuli, such as DislikeSound, and borderline cases, such as Other, are difficult when the sensing position for the EEG analysis is the left frontal pole.
For future research, we will change the sensing positions to detect other preferences, such as Dislike and Other.
Acknowledgment
This work was partly supported by JSPS KAKENHI Grant Number JP17K12768.
References
[1] S. Ito, M. Ito, M. Fukumi, “An Electroencephalogram Analysis Method to Detect Preference Using Gray Association Degree” in Proc. of the 17th International Conference on Electronics, Information, and Communication
(ICEIC) 2018, Honolulu, 2018.
http://dx.doi.org/10.23919/ELINFOCOM.2018.8330622
[2] R. Sawata, T. Ogawa, M. Haseyama, “Human-centered favorite music estimation: EEG-based extraction of audio features reflecting individual preference” Proc. of 2015 IEEE International Conference on Digital Signal Processing, 818-822, 2015.
[3] A. Bajoulvand, R. Z. Marandi, M. R. Daliri, S. H. Sabzpoushan, “Analysis of folk music preference of people from different ethnic groups using kernel-based methods on EEG signals” Applied Mathematics and Computation, 307, 62-70, 2017.
[4] W.Park, D.-H. Kim, S.-P. Kim, J.-H. Lee, L. Kim, “Gamma EEG Correlates of Haptic Preferences for a Dial Interface” IEEE Access, 6, 22324-22331, 2018.
[5] Y. Wang, X. Gao, B. Hong, C. Jia, S. Gao, “Brain–Computer Interfaces Based on Visual Evoked Potentials” IEEE Eng Med Biol Mag., 27(5), 64-71, 2008. [6] R. J. Davison, “Anterior Cerebral Asymmetry and the Nature of Emotion”
Brain Cog., 20(1), 125–151, 1995.
[7] R. J. Davison, “Anterior Electrophysiological Asymmetries, Emotion, and Depression: Conceptual and Methodological Conundrums” Psychophysiology, 35(5), 607–614, 1998.
[8] J. B. Allen, “Issues and Assumptions on the Road from Raw Signals to Metrics of Frontal EEG Asymmetry in Emotion” Biol Psychol., 67(1–2), 183– 218, 2004. http://dx.doi.org/10.1016/j.biopsycho.2004.03.007
[9] J. A. Coan, J. B. Allen, P. E. Mcknight, “A Capability Model of Individual Differences in Frontal EEG Asymmetry” Biol Psychol., 72(2), 198–207, 2006. http://dx.doi.org/10.1016/j.biopsycho.2005.10.003
[10] F. Lotte, M. Congedo, F. Lecuyer, B. Arnaldi, “A Review of Classification Algorithms for EEG-based Brain-Computer Interfaces” J. Neural Eng., 4(2), R1–R13, 2007. http://dx.doi.org/10.1088/1741-2560/4/2/R01
[11] H. Lee, S. Choi, “PCA+HMM+SVM for EEG Pattern Classification” Proc. 7th Int. Symp. on Signal Processing and its Application, 1, 541–544, 2003. [12] T. Hoya, G. Hori, H. Bakardjian, S. Nishimura, T. Suzuki, Y. Miyawaki, A.
Funase, J. Cao, “Classification of Single-trial EEG Signals by a Combined Principal + Independent Component Analysis and Probabilistic Neural Network Approach, Proc. ICA2003, 197, 197–202, 2003.
[13] J. F. Borisoff, S. G. Mason, A. Bashashati, G. E. Birch, “Brain-Computer Interface Design for Asynchronous Control Applications: Improvements to the LF-ASD Asynchronous Brain Switch” IEEE Trans. Biomed. Eng., 51(6), 985–992, 2004. http://dx.doi.org/10.1109/TBME.2004.827078
[14] S. Ito, M. Ito, K. Sato, S. Fujisawa, M. Fukumi, “Preference Classification Method Using EEG Analysis Based on Gray Theory and Personality Analysis” OJCSIT, 4(3), 276–280, 2014.
[15] B. Blankertz, G. Curio, K. R. Muller, “Classifying Single Trial EEG: Towards Brain–Computer Interfacing” Adv. Neural Inf. Process. Syst., NIPS 01, 14, 157–164, 2002.
[16] R. Khorsrowabadi, C. Q. Hiok, A. Watab, K. A. Kai, “EEG-based Emotion Recognition Using Self-Organizing Map for Boundary Detection” Proc. of ICPR, 4242–4245, 2010.
[17] T. Felzer, B. Freisieben, “Analyzing EEG Signals Using the Probability Estimating Guarded Neural Classifier” IEEE Trans. Neural Syst. Rehabil. Eng., 11(4), 361–371, 2003.