Doctoral Thesis
Operando XAFS Investigation on Redox Reactions
of Cobalt Catalyst Supported on Silica
September 2016
Doctoral Program in Advanced Life Sciences
Graduate School of Life Sciences
Ritsumeikan University
Doctoral Thesis Reviewed
By Ritsumeikan University
Operando XAFS Investigation on Redox Reactions
of Cobalt Catalyst Supported on Silica
(
シリカ担持コバルト触媒の酸化還元反応
におけるオペランド
XAFS
解析
)
September 2016
2016
年
9
月
Doctoral Program in Advanced Life Sciences
Graduate School of Life Sciences
Ritsumeikan University
立命館大学大学院生命科学研究科
生命科学専攻博士課程後期課程
CHOTIWAN Siwaruk
チョティワン シワルク
Supervisor : Professor INADA Yasuhiro
i
TABLE OF CONTENTS
Page
Table of contents i
List of figures iii
List of tables viii
Chapter 1. Introduction 1
1.1. Catalysis 1
1.2. Cobalt-based catalyst 2
1.3. Supporting silica 4
1.4. Catalyst preparation 5
1.5. X-ray absorption spectroscopy 6
1.6. Research purpose 10
Chapter 2. Experimental 12
2.1. Catalyst preparation 12
2.2. X-ray diffraction (XRD) 12
2.3. N2 adsorption-desorption measurement 13
2.4. Transmission electron microscopy (TEM) 13
2.5. X-ray absorption fine structure (XAFS) measurements and data analysis
13
ii
TABLE OF CONTENTS (Continued)
Page
Chapter 3. Results and discussion 18
3.1. Characterization of prepared Co Catalysts 18
3.2. Particle size of supported metallic Co Species 29
3.3. Reduction process of SiO2-supported Co species 32
3.3.1. Chemical state conversion at elevated temperature 32
3.3.2. Local structure at elevated temperature 39
3.3.3. Dynamic process of reduction 52
3.4. Oxidation process of SiO2-supported Co species 55
3.4.1. Chemical state conversion at elevated temperature 55
3.4.2. Local structure at elevated temperature 61
3.4.3. Dynamic process of oxidation 68
3.5. Redox characteristics of small Co particles supported on silica 73
Chapter 4. Conclusions 77
References 79
List of publications 86
iii
LIST OF FIGURES
Page Fig. 1 Co K edge XAFS spectrum of Co foil including the XANES and
EXAFS regions
8
Fig. 2 Schematic diagram of a time-resolved dispersive XAFS instrument 9
Fig. 3 The schematic diagram of the gas flow system for in-situ XAFS measurements
15
Fig. 4 The XRD patterns of supporting SiO2, calcined catalyst, reduced
catalyst, and re-oxidized catalyst for Co/SIO
19
Fig. 5 The XRD patterns of supporting SiO2, calcined catalyst, reduced
catalyst, and re-oxidized catalyst for Co/SIO-CA
20
Fig. 6 The N2 adsorption-desorption isotherm for pure silica 21
Fig. 7 The N2 adsorption-desorption isotherm for Co/SIO 22
Fig. 8 The N2 adsorption-desorption isotherm for Co/SIO-CA 22
Fig. 9 XANES spectra for calcined catalysts compared with reference compounds
23 Fig. 10 EXAFS oscillation and Fourier transform functions for calcined Co
catalysts compared with reference compounds
24 Fig. 11 XANES spectra for reduced catalyst compared with reference
compounds
25 Fig. 12 EXAFS oscillation and Fourier transform functions for reduced Co
catalysts compared with reference compounds
iv
LIST OF FIGURES (Continued)
Page
Fig. 13 XANES spectra, k3-weighted EXAFS oscillation, and Fourier
transform function for re-oxidized catalysts compared with reference compounds
28
Fig. 14 TEM image for the reduced Co/SIO catalyst 30
Fig. 15 TEM image for the reduced Co/SIO-CA catalyst 30
Fig. 16 Particle size distribution estimated from TEM images for the reduced Co/SIO catalyst
31 Fig. 17 Particle size distribution estimated from TEM images for the
reduced Co/SIO-CA catalyst
31
Fig. 18 XANES spectral change during the TPR process of Co/SIO 33
Fig. 19 XANES spectral change during the TPR process of Co/SIO-CA 33
Fig. 20 Composition change as a function of temperature for component
species, Co0, CoO, and Co3O4 during the TPR process of Co/SIO
35 Fig. 21 Composition change as a function of temperature for component
species, Co0, CoO, and Co3O4 during the TPR process of Co/SIO-CA
35 Fig. 22 The spectral reproducibility by the linear combination fitting at
436 °C of Co/SIO during the TPR process
36 Fig. 23 The spectral reproducibility by the linear combination fitting at
439 °C of Co/SIO-CA during the TPR process
v
LIST OF FIGURES (Continued)
Page Fig. 24 The spectral reproducibility by the linear combination fitting at
900 °C of Co/SIO-CA during the TPR process
37
Fig. 25 Composition of component Co species, Co3O4, CoO, and Co0, as a
fuction of temperature during reduction by H2 for Co/SIO and Co/SIO-CA
38
Fig. 26 The k3-weighted EXAFS oscillation functions (k3χ(k)) during the
TPR process for Co/SIO and Co/SIO-CA
40 Fig. 27 Fourier transform functions during the TPR process for Co/SIO and
Co/SIO-CA catalysts
41
Fig. 28 The N value for Co–O in Co3O4 and Co–Co in Co0 plotted versus
temperature during the TPR process of Co/SIO and Co/SIO-CA
51
Fig. 29 XANES spectral change for Co/SIO at 600 oC after a rapid exposure
of H2 (6.5 kPa)
53 Fig. 30 X-ray absorbance change at 7725 eV for Co/SIO as a function of
time after the injection of H2 gas (6.5 kPa)
53 Fig. 31 XANES spectra for Co/SIO measured at 0, 1, and 14 s after a rapid
exposure of H2 (6.5 kPa) compare with those of Co foil, CoO, and Co3O4
reference compounds
54
Fig. 32 XANES spectral change during the TPO process of Co/SIO 55
vi
LIST OF FIGURES (Continued)
Page Fig. 34 Composition change as a function of temperature for component
species, Co0, CoO, and Co3O4 during the TPO process of Co/SIO
58 Fig. 35 Composition change as a function of temperature for component
species, Co0, CoO, and Co3O4 during the TPO process of Co/SIO-CA
58
Fig. 36 Composition of component Co species, Co3O4, CoO, and Co0, as a
fuction of temperature during oxidation by O2 for Co/SIO and Co/SIO-CA
60
Fig. 37 The k3-weighted EXAFS oscillation functions (k3χ(k)) during the
TPO process for Co/SIO and Co/SIO-CA
61 Fig. 38 Fourier transform functions during the TPO process for Co/SIO and Co/SIO-CA catalysts
62
Fig. 39 XANES spectral change for Co/SIO at 600 oC after a rapid exposure
of O2 (1.8 kPa)
68 Fig. 40 The X-ray absorbance change for Co/SIO at 7721 eV as a function
of time at 600 °C under 1.8 kPa of O2
69
Fig. 41 XANES spectral change for Co/SIO at 600 oC after a rapid exposure
of O2 (1.8 kPa) in the time region from 0 to 0.5 s, from 0.5 to 1.7 s, and
from 1.7 s to 5 s
70
Fig. 42 The difference XANES spectrum between at 0 s and 0.5 s and that between Co foil and the supported Co species measured at 0 s
vii
LIST OF FIGURES (Continued)
Page
Fig. 43 The reaction model for the oxidation processes from Co0 to Co3O4 via
the CoO intermediate
72 Fig. 44 Reduction behavior at elevated temperature for Co/SIO and
Co/SIO-CA
74 Fig. 45 Oxidation behavior at elevated temperature for Co/SIO and
Co/SIO-CA
viii
LIST OF TABLES
Page
Table 1 Co K edge XAFS condition 14
Table 2 The optimized structure parameters for Co/SIO during the TPR process
44 Table 3 The optimized structure parameters for Co/SIO-CA during the TPR process
47 Table 4 The optimized structure parameters for Co/SIO during the TPO
process
63 Table 5 The optimized structure parameters for Co/SIO-CA during the TPO process
1
Chapter 1. INTRODUCTION 1.1. Catalysis
Catalysis is a phenomenon to accelerate a chemical reaction by the existence of a small amount of catalyst material in the reaction system. Only the reaction rate is enhanced by the catalysis function without any change for the chemical equilibrium of the reaction [1-4]. Generally, the catalyst has the limited lifetime due to its catalysis deactivation. Thus, solving problem on catalysis deactivation is a major challenge in catalysis chemistry.
Catalysts are mainly divided into two main groups, the homogeneous and heterogeneous catalyst. The homogeneous catalysts are present in the same phase as the reactants and products, and are generally simple molecules or ions such as acids and bases
(HF, H2SO4, NaOH), metal ions (Mn2+, Cu2+), complex molecules, organometallic
complexes, enzymes, and so on [1,3-5]. For example, the transesterification reaction for the biodiesel production is catalyzed by using NaOH or KOH, the ethylene oxidation is
catalyzed by the Wacker process using the PdCl2–CuCl2 catalyst, and the isomerization
of olefin is catalyzed by metal complexes [1,4,6-11].
The active species of the heterogeneous catalyst is present in the different phase from the reactants and products. Such catalysts are usually inorganic solids, such as metal and metal oxide, and the reactants and products are gaseous or liquid materials. The heterogeneous catalysts have advantage for the easy separation of the added catalyst from the products. The heterogeneous catalysts are widely used in many areas of the chemical and engineering industries. For example, the dehydrogenation of formic acid produces carbon dioxide and hydrogen over various metal catalysts, the Fe species is widely used
2
for the ammonia synthesis, the ammonia oxidation is catalyzed by the Pt−Rh bimetallic catalyst, the Fischer–Tropsch synthesis using the Fe or Co species produced useful hydrocarbons from the syngas, the Ni catalyst is used for the methane production, the methanol synthesis is accelerated by the Cu catalyst, the petroleum refining process is catalyzed by the Pt or Re species by the naphtha reforming reaction, the catalytic cracking of gaseous oil is enhanced by the zeolite catalyst, the first-row early transition metal
oxides such as Cr2O3 and V2O5 are useful catalysts for the dehydrogenation of alkane,
and the photocatalytic processes are catalyzed by TiO2 and ZnO [12-15].
Catalysis reaction is a fundamental technique in the chemical industry, and has been widely used for the purpose of many technology developments, especially, for the alternative renewable energy production to prepare against the increasing energy demand of humankind and to diminish the use of limited natural resources. Therefore, catalyst developments to improve and enhance the efficiency are very important for the future society.
1.2. Cobalt-based catalyst
Cobalt-based catalysts are widely used to produce clean alternative energy sources by a variety of catalytic reactions, such as ethanol steam reforming, which is the most cost-effective and efficient technology for the hydrogen production from renewable sources [16-21]. The main reaction involved in the process is given by eq. (1).
CH3CH2OH + 3 H2O → 2 CO2 + 6 H2 (1)
A broad range of the catalytic systems have been developed to improve the activity by changing the active metal elements, such as Rh, Pt, Pd, Ru, and Re, and these elements show high activities in a wide temperature range and at high space velocities of
3
the reactant gas. These metal elements are however fairly rare, and the numerous studies including more common metal elements, such as Ni, Cu, Zn, Fe, and Co, have revealed that the oxide supported Co catalyst shows a high C–C bond cleavage activity for the ethanol steam reforming process [22,23].
Fischer–Tropsch synthesis is a catalytic process that converts a syngas, a mixture
of carbon monoxide (CO) and hydrogen (H2), to clean liquid fuels. The main reaction
involved in the Fischer–Tropsch synthesis is expressed by eq. (2).
n CO + 2n H2 → –(CH2)n– + n H2O ΔH˚ = –165 kJ mol–1 (2)
Franz Fischer and Hans Tropsch have established this process since 1920’s. The Fischer– Tropsch synthesis could produce a wide range of hydrocarbons such as light hydrocarbons, gasoline, diesel fuel, and wax, and thus it is quite useful to reduce the consumption of crude oil [24-26].
The supported metallic Co species is the optimal choice for carrying out the Fischer–Tropsch synthesis at low temperature because of its high activity for the selective paraffin production with the diminished water-gas-shift activity, which is a side reaction [27-32]. It is known that the catalytic performance strongly depends on the number of active site on the Co particles, and that the number is correlated with the particle size [31-34]. The actual catalyst usually consists of the metallic Co particles supported on an oxide
supporting material. The oxide support, such as SiO2 and Al2O3, with high surface area is
utilized to prepare the Co catalyst for the Fischer–Tropsch synthesis in order to achieve the high dispersion of the Co species [31,35]. Moreover, the Co-based catalysts also show the catalysis activity for the other reactions, for example, the hydrogenation, the hydrodesulfurization, the oxidation of CO, and water oxidation [36-40].
4 1.3. Supporting silica
The supporting material has an important role on the catalytic performance for the heterogeneous catalysts. The particle morphology and the atomic structure of the supporting material largely contribute to the dispersion, the particle size, and the reactivity of the supported active species, and they directly affect to the catalytic performance. The principal function of the supporting material is to disperse and stabilize the active metal species under the operating conditions.
In the case of the Co catalysts, the standard supporting material includes Al2O3,
SiO2, and TiO2, and the porous morphology of the material is known to contribute to the
dispersion of the supported Co species [41]. It has also reported that the interaction
strength between the Co species and the supporting material is in the order of SiO2 < TiO2
< Al2O3. Because of the weak interaction of SiO2, it is the most widely used as the
supporting material for the Co catalyst. The weak interaction can contribute to the high dispersion, the low reduction temperature, and the high catalytic activity [42,43].
Silica is one of the common supporting materials used in many metal catalysts, and it has good properties including the high surface area, the porosity, the stability, and weak interaction with the metal species [44]. However, the weak interaction between the
Co and SiO2 particles tends to increase the reducibility of the Co precursor and to promote
the agglomeration of the supported Co particles, reducing the dispersion of the Co species and thus the numbers of active site [45]. Thus, the achievement of high Co dispersion and the formation of small active Co species are the major challenge in the design of the Co
5 1.4. Catalyst preparation
The Co catalysts are typically prepared by the impregnation method, which is the most frequently used method to prepare the heterogeneous catalysts due to its simplicity, cost efficiency, and limited waste production [46,47]. In the attempts to develop more active catalysts with the improved performance, an accepted procedure is to enhance the dispersion of the Co species by decreasing the average particle size [48].
In one of the efforts to achieve the high dispersion of the supported metal particles, a chelating agent that includes citric acid (CA) is added during the impregnation process [49-52]. The CA molecules interact with the active metal components of the catalyst in the precursor solution and remain at least in the dried catalyst powder. This interaction can improve the dispersion of the supported metal species and also prevent the aggregation of the metal particles during the catalysis reaction [53]. However, small Co particles in highly dispersed catalysts have interacted strongly with the surface of the oxide support during the thermal activation treatment, which appears to affect the catalytic performance [51,54,55].
A suspension of the supporting powder material in a precursor solution of the active material is dried and calcined during the catalyst preparation process to give the heterogeneous catalyst. The dissolved chemical species of the active metal element in the precursor solution may affect to the chemical state and then the particle size of the supported metal species after the calcination. The calcined catalysts are subjected to reduce to generate the active metallic species prior to use in the catalysis reaction. Thus, the understanding of the chemical state and its conversion during the preparation and the treatment conditions is necessary to clarify the active chemical species. In addition, the evaluation of the chemical state under the operating condition is also crucial to know the
6
actual active species for the catalysis reaction. In the case of the Co-based catalysts, the
Co(0) species is normally the active phase in the catalysis reactions. Changing the
chemical state of the active Co species causes the degradation of its catalytic performance. Therefore, the direct characterization and structure determination of the active Co species under the reaction gas conditions are imperative for the stable utilization of the catalysis process [56].
The redox reactions of the supported Co species are rational processes for understanding and improving the efficiency of the Co catalyst. Because the chemical state of the Co species is easily changed under a reactive gas atmosphere at elevated temperature, the in-situ evaluation is important for understanding the species formed. Furthermore, acquiring knowledge about the reduction and oxidation temperature of the supported Co species is useful for determining the actual active species for the catalytic reaction. Such an evaluation of the redox behavior of the supported Co species with different particle size can contribute to attaining a rational understanding of the major effects of temperature variation on the redox reaction, and can provide the information for the strategic preparation and stable utilization of the Co catalyst.
1.5. X-ray absorption spectroscopy
Synchrotron-based X-ray absorption spectroscopy is known to be useful for the in-situ analysis of supported metal species. X-ray absorption fine structure (XAFS) technique provides information about the local structure and the chemical state of a selected element, and it can be operated under various environments including the actual reaction conditions under high temperatures, variable pressures, and various gas atmospheres. The available electronic state and the local structure for the supported metal
7
species are important for understanding the catalytic properties. In addition, in-situ XAFS measurements provide quantitative information about the supported phase during the catalyst preparation, activation, and operation processes [56-60].
XAFS measurements for the Co catalysts are typically conducted at K edge of cobalt (7709 eV). A typical example of the XAFS spectrum was given in Fig. 1, and it is divided into two regions including the X-ray absorption near edge structure (XANES) and the extended X-ray absorption fine structure (EXAFS). The XANES region is ascribed by the electron transition from the inner core to the valence orbital, and thus it includes the information about the oxidation state of the target atom. The EXAFS region provides the local structure information around the X-ray absorbing atom within the distance range less than 0.7 nm, including the radial distance from the target atom to the neighboring atoms, the coordination number, and the Debye–Waller factor to describe the disorder of the scattering atoms [61,62].
8
Fig. 1. Co K edge XAFS spectrum of Co foil including the XANES and EXAFS regions. In addition, the time-resolved dispersive XAFS (DXAFS) technique is very powerful to analyze the chemical state conversion of metal species under real reaction conditions [56,63-67,69-71]. In particular, the DXAFS technique can follow the time resolution of the order of millisecond. The DXAFS instrument is generally composed of a bent crystal and the position-sensitive detector. A schematic diagram of the DXAFS instrument is shown in Fig. 2. A white X-ray beam is irradiated to the polychromator at a given incident angle, and the diffracted X-rays have different energies depending on the incident angle to the bent crystal surface. These polychromatic X-rays are focused and then diverged towards the position sensitive detector, where the element position of the detector is correlated to the X-ray energy.
The main advantage of the DXAFS technique is that the whole XAFS spectrum can be collected simultaneously without any mechanical motions of the instrument, and
-0.2
0.0
0.2
0.4
0.6
0.8
1.0
1.2
1.4
7.2 7.4 7.6 7.8 8.0 8.2 8.4 8.6 8.8
Ab
so
rb
an
ce
E / keV
XANES EXAFS9
thus this technique is especially useful for real time measurements. The DXAFS technique is suitable for in-situ time-resolved measurements, and is very useful for the study of dynamic changes in the chemical state of the supported metal catalysts [63-71].
10 1.6. Research purpose
The chemical state analysis of the supported Co species is the most essential to understand their property and activity. The chemical state is drastically changed during the impregnation, calcination, reduction, and catalysis reaction processes. The chemical reactions of the Co species in the solid phase with the reactant molecule in the gas phase occur at the solid–gas interface. The calcination process is normally carried out in air, and thus the oxidation reaction may occur for the supported Co species. When the reaction gas molecules with the oxidizing ability are exposed to the supported Co species under the catalysis reaction conditions, the reduced Co species is potentially oxidized. The temperature-programmed oxidation (TPO) process, in which the Co catalyst is treated under the oxidative gas flow by increasing the temperature, becomes the model process for the oxidation reactions that the supported Co species experience. Because the metallic Co species is usually the catalytically active species, the supported Co species is
preliminary treated under the H2 gas flow at elevated temperatures. The Co oxide catalysts
may be reduced when it is used under the reductive gas environment. The temperature-programmed reduction (TPR) process, in which the Co catalyst is treated under the reductive gas flow by varying the temperature, is the model process for such reduction reactions. The evaluation of the chemical state conversion for the supported Co species during the TPO and TPR processes is quite important to prepare and to use the effective active species for the target catalysis reaction.
This research focuses on the chemical state clarification for the SiO2-supported
Co species under the reactive gas conditions. The Co catalysts were prepared by the impregnation method and were characterized by the X-ray diffraction (XRD) and XAFS methods. The particle size was evaluated by the transmission electron microscopy (TEM).
11
The in-situ XAFS measurements were carried out to assess the redox behavior of the supported Co species during the TPR and TPO processes. The dynamic changeover of the chemical state was studied by the time-resolved DXAFS technique. In order to evaluate the particle size effect of the supported Co species on the redox reactions, two Co catalysts with the different particle sizes were used in this study. One was prepared by the conventional impregnation method, and the particle size was large with the wide size distribution. The other smaller particle of the supported Co species was prepared by the impregnation method with the addition of an organic additive into the precursor solution of Co [51,55,72-74]. The observed difference in the redox temperature will be
discussed by considering the interaction between the supporting SiO2 and the supported
12
Chapter 2. EXPERIMENTAL 2.1. Catalyst preparation
Two silica-supported Co catalysts were prepared by the impregnation method.
The powder of SiO2 (Fuji Silysia Chemical Co., Ltd.) with the specific surface area of
192 m2/g was used for the supporting material, which was distributed by the Catalysis
Society of Japan. The SiO2 powder was suspended in an aqueous solution of
Co(NO3)2∙6H2O, and the suspension was dried at 80 oC for 24 h. The obtained powder
was ground and calcined at 600 oC in air for 2 h. The catalyst prepared by this procedure
is referred as Co/SIO. The other silica-supported Co catalyst was synthesized by the
impregnation method using a solution of Co(NO3)2・6H2O, in which an equivalent amount
of citric acid (CA) coexisted. After the impregnation, the catalyst precursor was dried at
80 oC for 48 h and calcined at 700 oC in air for 2 h. The obtained catalyst is referred as
Co/SIO-CA. The Co loading was set to be 10 wt.% for both samples. 2.2. X-ray diffraction (XRD)
The powder XRD measurements were performed using an Ultima IV diffractometer (Rigaku Co., Ltd.) equipped with a linear detector using the Cu K
radiation (λ = 1.5418 Å). The diffraction intensities were recorded over the 2 range from
10o to 70o. The diffraction patterns were recorded at the angle step of 0.02° with the scan
speed of 5 point per second.
The crystallite size of the Co particle based on the broadening of the XRD line was estimated by using Scherrer’s equation as given in eq. (3).
13
where d is the average crystallite size, K is the Scherrer constant (0.9), is the wave
length of X-ray, is the full width at half maximum (FWHM) of the diffraction line, and
is the diffraction angle. The crystallite size for both Co catalysts was determined from
the (311) diffraction line of Co3O4 and from the (111) diffraction line of Co0.
2.3. N2 adsorption-desorption measurement
Specific surface area and the pore volume of calcined samples and silica support
were measured by means of the BET method. The N2 adsorption-desorption isotherms
were measured at –196 oC using a BELSORP-mini II instrument (MicrotracBEL Co.,
Ltd.).
2.4. Transmission electron microscopy (TEM)
The TEM observations were carried out with a JEOL2010 microscope (JEOL Co., Ltd.) for the Co catalysts after the reduction treatment. The calcined samples were
reduced at 750 oC and 900 oC for Co/SIO and Co/SIO-CA, respectively, under the diluted
H2 flow (10 vol.% balanced by He) with a flow rate of 200 cm3/min. The powders were
suspended into ethanol and diffused with ultrasonic waves for a few minutes. 2.5. X-ray absorption fine structure (XAFS) measurements and data analysis
The in-situ XAFS measurements were performed at BL-9C beamline of the Photon Factory (High Energy Accelerator Research Organization, Japan) using a Si(111) double-crystal monochromator at the Co K edge in transmission mode. The XAFS measurement conditions are summarized in Table 1. The parallelism of the double crystal monochromator was detuned to remove higher-order reflections. The suitable amount (20
14
mg) of the Co catalyst was estimated by calculating the absorption edge jump to become about 1.0, and the sample powder was putted into the flow-type XAFS cell [75].
The diluted H2 gas (10 vol.% balanced by He, total 200 cm3/min) was first
flowed through the sample powder, and the sample was heated to 750 oC for Co/SIO and
900 oC for Co/SIO-CA with the heating rate of 10 oC/min. The XAFS spectra were
repeatedly recorded with the time interval of 2 min during the TPR process. The measurement time for one spectrum was 1 min. After the TPR process, the reduced
sample was cooled to room temperature by keeping the H2 gas flow. The flow gas was
then switched to the diluted O2 (10 vol.% balanced by He, total 200 cm3/min), and the
sample was reheated to 600 oC and 700 oC for Co/SIO and Co/SIO-CA catalyst,
respectively, with the heating rate of 10 oC/min. The XAFS measurements were also
performed during the TPO process. The gas-flow system shown in Fig. 3 was used to change the flowing gas environment.
Table 1. Co K edge XAFS condition.
Monochromator Si(111)
Detector (ionization chamber) I0 : N2 (100%)
I : N2 (75%) + Ar (25%)
Slit size 1 mm(V) and 1 mm(H)
Energy range 7204.5 – 8809.5 eV
Scanning times 60 s
15
Fig. 3. The schematic diagram of the gas flow system for in-situ XAFS measurements.
The observed XAFS spectra were processed using the Athena software [76,77]. The background-subtracted and the edge-jump normalized XANES spectrum was used for analyzing the composition of the Co species on the basis of the linear combination approximation expressed by eq. (4),
( ) = ∑ ( ) (4)
where s is the observed XANES spectrum and i is that of a reference compound i with
the composition ai. The bulk samples, Co metal, CoO, and Co3O4 were used as the
reference compounds.
The Fourier transformation was applied to the k3-weighted EXAFS oscillation
function χ(k). The structure parameters were determined by the curve fitting procedure to the Fourier transformed data in the R range from 1.0 to 3.0 Å. The coordination number N, the average interatomic distance R between the absorbing Co and scattering atoms, and
16
the Debye–Waller factor σ were determined by applying a non-linear least-squares fitting procedure in the R space using the theoretical EXAFS function as given in eq. (5) [59],
( ) = ∑ ( )sin 2 + ( ) − , exp −2 − ( ) (5)
where S02, Fj(k), δj(k), and λj(k) denote the total dumping factor, the effective scattering
amplitude, the total phase shift, and the mean free path of the photoelectron, respectively,
and the third cumulant term C3,j is included to describe the non-Gaussian interatomic
potential. The values of Fj(k), δj(k), and λj(k) were calculated for the Co3O4, CoO, and Co
metal reference compounds by using FEFF8 code [78,79]. The S02 value was estimated
by fitting eq (5) to the measured EXAFS data of the reference compounds, and the S02
value was fixed for the analysis of the Co catalysts.
2.6. Time-resolved dispersive XAFS (DXAFS) measurements
The dynamic changeover of the chemical state was studied by the time-resolved DXAFS technique at the NW2A beamline of PF-AR (KEK, Japan). The Si(111) bent
crystal was used as a polychromator with the bending radius (Rb) of 2.0 m. A photodiode
array (S3904-1024F, Hamamatsu Photonics Co., Ltd.) was used as the position-sensitive linear detector together with a phosphor plate of CsI:Tl (thickness: 50 m) to convert X-ray to visible light. The Rh-coated band mirror (2.8 mrad) was used to vertically focus the white X-ray and the Rh-coated double-mirror system (5.5 mrad) was used to remove the higher energy component in the white X-ray.
The Co catalyst was set in a batch-type DXAFS cell [66] and the sample was
heated to 600 °C at 20 °C/min. The reaction gas (pure H2 at 6.5 kPa for reduction of Co
17
cell after the evacuation to start the reaction. The time-resolved spectra were recorded with the time resolution of 10 ms.
18
Chapter 3. RESULTS AND DISCUSSION 3.1. Characterization of prepared Co catalysts
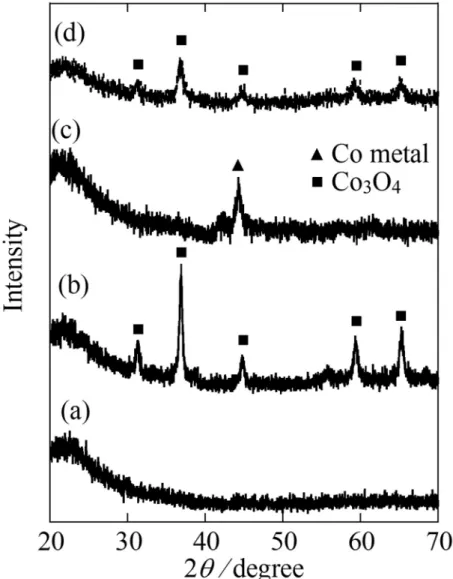
The XRD patterns of Co/SIO and Co/SIO-CA are shown in Figs. 4 and 5,
respectively. For Co/SIO, the diffraction peaks at 2θ = 31.3, 36.9, 45.1, 59.4, and 65.4o
clearly indicated the Co3O4 crystalline phase present after the calcination at 600 oC in
consistent with the previous reports [80,81]. Similarly, for Co/SIO-CA, the diffraction
peak at 2θ value of 36.9o clarified the formation of Co3O4 after the calcination at 700 oC.
After the reduction treatment, the XRD patterns of both catalysts showed a peak at 44.2o,
which was characteristic to the metallic Co phase. When the reduced samples were
oxidized by the exposure of O2 at 600 oC for Co/SIO and 700 oC for Co/SIO-CA, the
XRD patterns were changed to those of Co3O4 and were almost in accordance with those
of the calcined samples. The crystallite size calculated using the Scherrer’s equation for oxidized Co/SIO-CA (9 nm) was found to be smaller than that of Co/SIO (28 nm). Moreover, the corresponding value for the reduced sample remained small for Co/SIO-CA (10 nm) compared with that of Co/SIO sample (25 nm). The results suggested that the small Co particle was generated by the addition of citric acid in the impregnation process.
19
Fig. 4. The XRD patterns of supporting SiO2 (a), calcined catalyst (b), reduced catalyst
20
Fig. 5. The XRD patterns of supporting SiO2 (a), calcined catalyst (b), reduced catalyst
21
The N2 adsorption-desorption isotherms for silica support, Co/SIO, and
CoSIO-CA are shown in Figs. 6, 7, and 8, respectively. The isotherms of two Co catalysts after the calcination were close to that of pure silica. The determined values of the specific
surface area were 146 m2/g for Co/SIO and 158 m2/g for Co/SIO-CA, and were close to
that of silica (164 m2/g). These results indicated that the surface porosity of two catalysts
was not changed from the original silica after the calcination process.
Fig. 6. The N2 adsorption-desorption isotherm for pure silica.
0 100 200 300 400 500 600 700 0.0 0.2 0.4 0.6 0.8 1.0 1.2 Va / cm 3 (S TP ) g -1 P/ P0
22
Fig. 7. The N2 adsorption-desorption isotherm for Co/SIO.
Fig. 8. The N2 adsorption-desorption isotherm for Co/SIO-CA.
0 100 200 300 400 500 0.0 0.2 0.4 0.6 0.8 1.0 1.2 Va / cm 3 (S TP ) g -1 P/ P0 0 100 200 300 400 500 0.0 0.2 0.4 0.6 0.8 1.0 1.2 Va / cm 3 (S TP ) g -1 P/ P0
23
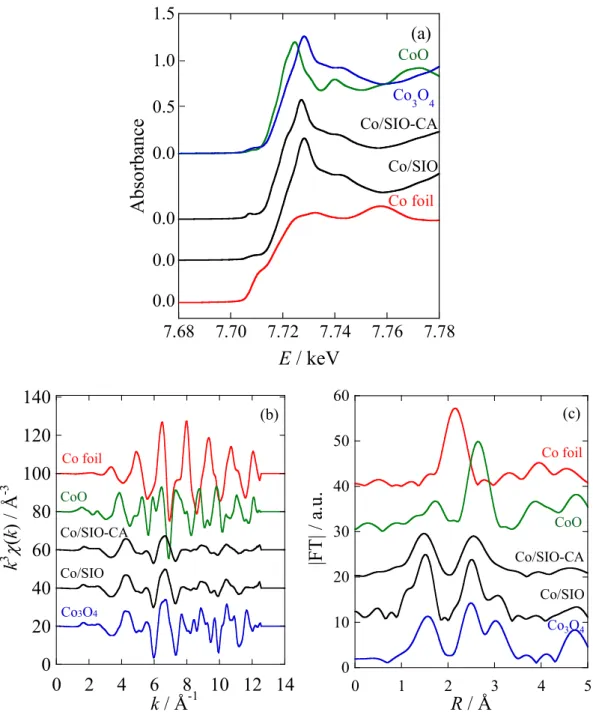
XANES spectra for the calcined catalysts were compared in Fig. 9 with all
relevant reference compounds, Co3O4, CoO, and Co foil. The observed XANES spectra
of the Co catalysts were almost in agreement with that of Co3O4, and thus the calcination
process under the air converted the impregnated Co species to the Co3O4 particle. The
formation of Co3O4, which is in accordance with the XRD results, and no contamination
by the other Co species have been demonstrated by the XANES spectra.
The white line peak of Co/SIO-CA at 7726 eV was slightly shifted to the lower energy relative to that of Co/SIO at 7728 eV. This may be affected by the particle size of
the supported Co3O4 species, as discussed below.
Fig. 9. XANES spectra for calcined catalysts compared with reference compounds.
7.68 7.70 7.72 7.74 7.76 7.78
Co foil Co3O4 CoO Co/SIO Co/SIO-CAA
bs
or
ba
nc
e
E / keV
0.0
0.0
0.0
1.0
1.5
0.0
0.5
24
The observed EXAFS oscillation functions (k3χ(k)) and their Fourier transform
functions are shown in Fig. 10 for two calcined Co catalysts by comparing with those of
reference compounds, Co3O4, CoO, and Co foil. The Fourier transforms were found to be
the same as that of Co3O4, which was characterized by three interaction peaks at 1.56,
2.54, and 3.01 Å, corresponding to the nearest neighboring Co–O interaction, the next nearest Co–O–Co interaction, and the triple scattering Co–O–Co–O interaction, respectively, in the spinel structure [82]. The results confirmed that the supported Co
species was quantitatively changed to Co3O4 during the calcination process.
Fig. 10. EXAFS oscillation (k3χ(k)) (left) and Fourier transform (right) functions for
calcined Co catalysts compared with reference compounds.
0 20 40 60 80 100 120 140 0 2 4 6 8 10 12 14 Co foil Co3O4 CoO Co/SIO Co/SIO-CA k / Å-1 k 3
(k ) / Å -3 0 10 20 30 40 50 60 0 1 2 3 4 5 |F T| / a.u . R / Å Co foil Co3O4 CoO Co/SIO Co/SIO-CA25
The XANES spectra of the Co catalysts after the reduction process in H2 were
compared with the reference compounds in Fig. 11. For Co/SIO, the XANES spectrum was closed to that of Co foil, indicating that the treatment of the calcined Co/SIO catalyst
under H2 at 750 oC converted the supported Co3O4 species to metallic Co species. In
contrast, in the case of Co/SIO-CA, a drastically different XANES spectrum was observed after the reduction. The white line peak is similar to that of CoO, and thus the incomplete reduction and the existence of remaining CoO species were suggested.
Fig. 11. XANES spectra for reduced catalyst compared with reference compounds.
7.68 7.70 7.72 7.74 7.76 7.78
Co foil Co3O4 CoO Co/SIO Co/SIO-CAAb
so
rb
an
ce
E / keV
0.0
0.0
0.0
1.0
1.5
0.0
0.5
26
In Fig. 12, are shown the k3-weighted EXAFS oscillations and their Fourier
transform functions. The k3χ(k) and Fourier transform of Co/SIO were consistent with
those of Co foil, and thus the quantitative reduction to metallic Co was confirmed as observed by the XANES spectrum. The main peak of the Fourier transform function of Co/SIO-CA was slightly broadened and the shoulder position at the longer distance side was closed to the main peak of CoO at 2.63 Å. It is implied that the small particles of the Co species existed in Co/SIO-CA tends to resist reducing from CoO to metallic Co.
Fig. 12. EXAFS oscillation (k3χ(k)) (left) and Fourier transform (right) functions for
reduced Co catalysts compared with reference compounds.
0 20 40 60 80 100 120 0 2 4 6 8 10 12 14 k / Å-1 Co foil Co3O4 CoO Co/SIO Co/SIO-CA k 3
(k ) / Å -3 0 10 20 30 40 50 60 0 1 2 3 4 5 |F T| / a.u . R / Å Co foil Co3O4 CoO Co/SIO Co/SIO-CA27
The XANES spectra, the k3χ(k) functions, and the Fourier transforms for the
re-oxidized Co catalysts are compared with those of reference compounds in Fig. 13. All
data indicated that the supported Co species was converted to Co3O4. The reversible
reduction/oxidation between Co3O4 and Co0 via CoO is found to proceed on SiO2, and
28
Fig. 13. XANES spectra (a), k3-weighted EXAFS oscillation (b), and Fourier transform
function (c) for re-oxidized catalysts compared with reference compounds. 7.68 7.70 7.72 7.74 7.76 7.78 Co foil Co3O4 CoO Co/SIO Co/SIO-CA Ab so rb an ce E / keV 0.0 0.0 0.0 0.0 (a) 1.0 1.5 0.5 0 20 40 60 80 100 120 140 0 2 4 6 8 10 12 14 Co foil Co3O4 CoO Co/SIO Co/SIO-CA k / Å-1 k 3
(k ) / Å -3 (b) 0 10 20 30 40 50 60 0 1 2 3 4 5 Co foil Co3O4 CoO Co/SIO Co/SIO-CA |F T| / a.u . R / Å (c)29 3.2. Particle size of supported metallic Co species
A typical example of the measured TEM image for the reduced Co catalyst is shown in Figs. 14 and 15 for Co/SIO and Co/SIO-CA, respectively. The dark spheres
correspond to the metallic Co particles, and the pale particles are supporting SiO2. The
diameter of the Co particles was measured using the TEM images, and the values of 47 (Co/SIO) and 74 (Co/SIO-CA) particles were counted. The histogram of the particle diameter is shown in Figs. 16 and 17 for Co/SIO and Co/SIO-CA, respectively, was obtained to evaluate the particle size distribution.
The average diameter of the metallic Co particles was 18 ± 6 nm for Co/SIO, which was larger than that of Co/SIO-CA (4 ± 1 nm). The distribution for the latter was quite small, and thus the addition of citric acid in the precursor solution affects to the supported particle size of the Co species. The small and uniform Co particles are generated in the Co/SIO-CA catalyst. The decreased particle size for the supported metal catalysts has also reported previously by adding citric acid during the impregnation process [51,72,73]. The previous study by Shi and co-workers has shown that the average
Co particle size of Co/SiO2, which was prepared by a citric acid assisted impregnation
method, are significantly decreased from 30 to 3 nm [51]. Moreover, citric acid was used to prepare the small Ni particles supported on silica by the sol-gel method, as reported in previous work in our laboratory, the crystallite size (4 nm) of the Ni species prepared by the sol-gel method with citric acid was found to be smaller than that of the Ni catalyst synthesized by the conventional impregnation method (17 nm) [65,83].
30
Fig. 14. TEM image for the reduced Co/SIO catalyst.
31
Fig. 16. Particle size distribution estimated from TEM images for the reduced Co/SIO catalyst.
Fig. 17. Particle size distribution estimated from TEM images for the reduced Co/SIO-CA catalyst. 0 20 40 60 80 100 0 5 10 15 20 25 30 35 Di str ib ut io n / % Particle size / nm 40 0 20 40 60 80 100 0 5 10 15 20 25 30 35 40 D ist rib ut io n / % Particle size / nm
32
3.3. Reduction process of SiO2-supported Co species
3.3.1. Chemical state conversion at elevated temperature
The XANES spectral change during the TPR processes for two Co catalysts with different particle size is shown in Figs. 18 and 19. The initial XANES spectrum was in
accordance with that of Co3O4 for both catalysts, and then the absorption edge energy
shifted to the lower energy as the temperature was increased during the TPR process. The in-situ XAFS analysis revealed that the transient XANES spectrum was almost consistent with that of CoO with the white line peak at 7725 eV. It is thus concluded that two
reduction processes from Co3O4 to CoO and from CoO to Co0 proceed successively with
increasing temperature during the TPR process. The XANES spectral change below 450
oC shows clear isosbestic points, which are identical to those between Co3O4 and CoO.
The final XANES spectra of the metallic Co species were clearly different in the two Co catalysts. The final XANES spectrum of Co/SIO was nearly the same as that of metallic Co, whereas that of Co/SIO-CA showed enhanced absorbance at 7725 eV, which was in agreement with that of CoO. In addition, the weak shoulder at the absorption edge of the final XANES spectrum for Co/SIO-CA indicates the incomplete reduction from
33
Fig. 18. XANES spectral change during the TPR process of Co/SIO.
Fig. 19. XANES spectral change during the TPR process of Co/SIO-CA.
7.68 7.70 7.72 7.74 7.76 7.78
A
bs
or
ba
nc
e
0.0
0.0
0.0
0.4
0.8
1.2
1.6
E / keV
Co foil Co3O4 CoO7.68 7.7 7.72 7.74 7.76 7.78
Co3O4 CoO0.0
0.0
0.0
0.4
0.8
1.6
1.2
A
bs
or
ba
nc
e
E / keV
Co foil34
The composition analysis based on the XANES spectrum during the TPR process for Co/SIO and Co/SIO-CA was carried out by means of the linear combination fitting
using three reference species, Co0, CoO, and Co3O4. The calculated values of mole
fraction are plotted in Figs. 20 and 21 as a function of temperature for Co/SIO and Co/SIO-CA, respectively.
The initial Co3O4 species was reduced to CoO when the temperature reached at
around 450 oC for both catalysts. Figure 22 clearly indicated that the CoO intermediate
quantitatively formed at 436 °C for Co/SIO, and the observed spectrum was well reproduced by the linear combination fitting result. Similarly, in the case of Co/SIO-CA, the fitted spectrum at 439 °C, at which the main species was CoO, was in good agreement with the observed spectrum as shown in Fig. 23, indicating that the CoO species was generated quantitatively. It was found that the XANES spectrum of the smaller CoO particle existed in Co/SIO-CA (Fig. 23) was clearly different from that of the larger CoO particle in Co/SIO (Fig. 22). The white line peak was broadened and its peak intensity became small by reducing the CoO particle size.
As the temperature was increased, the CoO species was further reduced to metallic
Co. The second reduction was completed at about 750 oC for Co/SIO with the larger
particle size, whereas the reduction for Co/SIO-CA proceeded partially even when the
temperature reached to 900 oC. The incomplete reduction for Co/SIO-CA with the smaller
particle size resulted in the XANES difference at the end of the TPR process. The composition analysis revealed the mole fraction of CoO as 0.5, and the calculated XANES
spectrum was reasonably reproduced by the sum of XANES spectra of CoO and Co0 in
35
Fig. 20. Composition change as a function of temperature for component species, Co0
(triangles), CoO (squares), and Co3O4 (circles) during the TPR process of Co/SIO.
Fig. 21. Composition change as a function of temperature for component species, Co0
(triangles), CoO (squares) and Co3O4 (circles) during the TPR process of Co/SIO-CA.
-0.2 0.0 0.2 0.4 0.6 0.8 1.0 1.2 0 100 200 300 400 500 600 700 M ol e f ra cti on T / oC Co foil Co3O4 CoO -0.2 0 0.2 0.4 0.6 0.8 1 1.2 0 100 200 300 400 500 600 700 800 900 Co foil Co3O4 CoO M ol e f ra cti on T / ºC
36
Fig. 22. The spectral reproducibility by the linear combination fitting at 436 °C of Co/SIO during the TPR process.
Fig. 23. The spectral reproducibility by the linear combination fitting at 439 °C of Co/SIO-CA during the TPR process.
-0.5 0.0 0.5 1.0 1.5 2.0 2.5 7.70 7.71 7.72 7.72 7.73 7.74 7.75
A
bs
or
ba
nc
e
Exp. at 436 O C (TPR)E / keV
Linear combination fitting
-0.5 0.0 0.5 1.0 1.5 2.0 7.70 7.71 7.72 7.73 7.74 7.75
A
bs
or
ba
nc
e
E / keV
Exp. at 439 O C (TPR) Linear combination fitting37
Fig. 24. The spectral reproducibility by the linear combination fitting at 900 °C of Co/SIO-CA during the TPR process.
In Fig. 25, the composition change of the component species is separately compared between Co/SIO and Co/SIO-CA. The reduction temperature, at which the
Co3O4 species was reduced to CoO, was almost the same within the experimental
uncertainty for two catalysts with the different particle sizes, as seen in Fig. 25(a) and 25(b). In contrast, the succeeding reduction temperature from CoO to metallic Co was shifted to higher temperature for Co/SIO-CA, and the reduction was not completed at 900 °C, as seen in Fig. 25(c). Such the resisted reduction of the smaller CoO particles in
Co/SIO-CA suggests that the interaction between CoO and supporting SiO2 is stronger
for the smaller CoO particle. The higher temperature is necessary to reduce the stabilized CoO phase. -0.3 0.0 0.3 0.6 0.9 1.2 1.5 7.70 7.71 7.72 7.73 7.74 7.75
Ab
so
rb
an
ce
E / keV
Exp. at 900 O C (TPR) Linear combination fitting38
Fig. 25. Composition of component Co species, Co3O4 (a), CoO (b), and Co0 (c), as a
fuction of temperature during reduction by H2 for Co/SIO (circles) and Co/SIO-CA
(squares). -0.2 0 0.2 0.4 0.6 0.8 1 1.2 0 100 200 300 400 500 600 700 800 900 M ol e f ra cti on T / ºC (a) -0.2 0 0.2 0.4 0.6 0.8 1 1.2 0 100 200 300 400 500 600 700 800 900 M ol e f ra ct io n T / ºC (b) -0.2 0 0.2 0.4 0.6 0.8 1 1.2 0 100 200 300 400 500 600 700 800 900 M ol e f ra ct io n T / ºC (c)
39 3.3.2. Local structure at elevated temperature
The observed k3χ(k) functions for Co/SIO and Co/SIO-CA were presented in Fig.
26 at some representative temperatures during the TPR process. The corresponding Fourier transform (FT) functions were given in Fig. 27.
The initial FT functions for both samples at room temperature were almost
identical to that of Co3O4, which is characterized by three interaction peaks at 1.56, 2.54,
and 3.01 Å. At the end of TPR for Co/SIO, the FT function became comparable to that of metallic Co species with an interaction peak at 2.12 Å. The complete reduction was consistent with the result of the compositional analysis.
On the other hand, the FT peak at the end of TPR for Co/SIO-CA was slightly broaden and had a shoulder at the longer distance, which is nearly consistent with the main FT peak observed for CoO at 2.63 Å. The incomplete reduction of CoO to metallic Co for Co/SIO-CA suggested the unfavorable reduction of the smaller CoO particle.
40
Fig. 26. The k3-weighted EXAFS oscillation functions (k3χ(k)) during the TPR process
for Co/SIO (a) and Co/SIO-CA (b).
0 2 4 6 8 10 12 14 Co3O4 CoO Co foil 746 ºC 533 ºC 475 ºC 436 ºC 339 ºC r.t. 105 ºC 0 0 0 0 0 0 0 0 20 0 40 k / Å-1 (a) k 3(k ) / Å -3 0 2 4 6 8 10 12 14 k / Å-1 0 0 0 0 0 0 0 20 Co3O4 CoO Co foil 898 ºC 807 ºC 614 ºC 517 ºC 400 ºC r.t. 0 302 ºC 0 40 (b) k 3 (k ) / Å -3
41
Fig. 27. Fourier transform functions during the TPR process for Co/SIO (a) and Co/SIO-CA (b) catalysts. 0 1 2 3 4 5 r.t. 105 ºC 339 ºC 436 ºC 475 ºC 746 ºC Co foil CoO Co3O4 533 ºC Co-Co Co-O |F T| / a.u . 0 0 0 0 0 0 0 0 0 20 10 R / Å 0 30 (a) 0 1 2 3 4 5 |F T| / a.u . 0 0 0 0 0 0 0 0 0 20 10 R / Å 0 Co3O4 CoO Co foil 898 ºC 807 ºC 517 ºC r.t. 614 ºC 400 ºC 302 ºC Co-Co Co-O 30 (b)
42
The structure parameters determined by the EXAFS analysis during the TPR process for Co/SIO and Co/SIO-CA are summarized in Table 2 and 3, respectively. As indicated by the XANES spectral change and the composition analysis, the Co species
were presented in the forms of Co3O4, CoO, and Co0. The FT data in the R range from
1.0 to 3.0 Å was used for the EXAFS analysis. Thus, the direct Co–O interaction in Co3O4,
the direct Co–O interaction and the Co–O–Co double scattering interaction in CoO, and
the direct Co–Co interaction in Co0 were taken into consideration for the curve fitting
calculation. The Co–O–Co double scattering interaction in Co3O4 and the longer
interaction were not treated in this study. Because the calculated N value is averaged for all component species existed, the true coordination number for each component species is estimated by the fitted value of N divided by its mole fraction.
At room temperature, the Co–O bond distance for the calcined catalysts (1.91 Å
for Co/SIO and 1.93 Å for Co/SIO-CA) was close to that of the Co–O distance in Co3O4
(1.91 Å). The N value of the Co–O interaction for Co/SIO was determined to be 5.3,
which was similar to that of bulk Co3O4, whereas the N value for Co/SIO-CA was found
to be lower than that of Co/SIO, as a result of the smaller Co3O4 particle size formed in
Co/SIO-CA.
The structure parameters of the transient CoO species determined at 436 oC for
Co/SIO were almost identical to those of bulk CoO. The corresponding values for
Co/SIO-CA were determined at 517 oC, and the N value for the Co–O interaction was at
4.8, which was smaller than that of Co/SIO (6.7) and bulk CoO (6.0). This result is consistent with the fact that the CoO particle formed in Co/SIO-CA is smaller than that
in Co/SIO, and the size difference at the initial Co3O4 phase is remained after the
43
At the end of the TPR process for Co/SIO, the parameters of the Co–Co interaction
at 746 oC were found to be in agreement with those of Co foil. On the other hand, in the
case of Co/SIO-CA, the structure parameters at 898 oC were ascribed by the contribution
of both CoO and Co0. The N values for both species were estimated in considering their
mole fractions, and the observed lower values for both species than those of the bulk
44
Table 2. The optimized structure parameters for Co/SIO during the TPR process.
Sample Condition Interactiona) N R (Å) E0 (eV) σ2 (10–3 Å2) C3 (10–3 Å3) Co foil r.t. (air) Co-Co(1) 12fixed 2.480.01 5.61.1 6.10.3 -0.10.08
CoO r.t. (air) Co-Co(2) 12fixed 2.980.01 -5.71.7 7.00.5 -0.20.1
Co-O(2) 6fixed 2.130.02 0.72.1 6.31.6 0.30.4
Co3O4 r.t. (air) Co-O(3) 5.3fixed 1.910.01 0.91.9 3.70.6 0.10.1 Co/SIO r.t. (H2) Co-O(3) 5.30.3 1.910.01 0.9 3.50.6 -0.10.1 37 oC (H2) Co-O(3) 5.30.2 1.910.01 0.9 3.2±0.4 -0.10±0.06 60 oC (H2) Co-O(3) 5.30.2 1.910.01 0.9 3.3±0.4 -0.09±0.06 84 oC (H2) Co-O(3) 5.30.2 1.910.01 0.9 3.4±0.4 -0.09±0.06 105 oC (H2) Co-O(3) 5.30.2 1.910.01 0.9 3.5±0.4 -0.07±0.06 125 oC (H2) Co-O(3) 5.30.2 1.910.01 0.9 3.6±0.4 -0.07±0.07 145 oC (H2) Co-O(3) 5.30.2 1.910.01 0.9 3.6±0.4 -0.06±0.07 164 oC (H2) Co-O(3) 5.30.2 1.910.01 0.9 3.8±0.4 -0.07±0.07 184 oC (H2) Co-O(3) 5.30.2 1.910.01 0.9 3.7±3.9 -0.04±0.07 203 oC (H2) Co-O(3) 5.40.5 1.910.01 0.9 4.4±1.0 -0.1±0.2 222 oC (H2) Co-O(3) 5.40.5 1.910.02 0.9 4.4±0.9 -0.1±0.2 242 oC (H2) Co-O(3) 5.50.5 1.910.02 0.9 4.7±1.0 -0.1±0.2 261 oC (H2) Co-O(3) 5.40.5 1.910.02 0.9 0.5±0.1 -0.1±0.2 281 oC (H2) Co-O(3) 5.40.5 1.910.02 0.9 4.9±1.1 -0.1±0.2 301 oC (H2) Co-O(3) 5.30.5 1.910.02 0.9 5.0±1.0 -0.1±0.2 320 oC (H2) Co-O(3) 5.20.4 1.910.01 0.9 5.2±0.8 -0.1±0.1 339 oC (H2) Co-O(3) 4.90.4 1.920.01 0.9 5.2±0.9 -0.02±0.2 358 oC (H2) Co-O(3) 4.80.4 1.93±0.01 0.9 5.9±1.1 0.1±0.2
45 Table 2. Continued.
Sample Condition Interactiona) N R (Å) E0 (eV) σ2 (10–3 Å2) C3 (10–3 Å3) Co/SIO 378 oC (H2) Co-O(2) 2.41.8 2.38±0.25 0.9 9.6±7.5 4.2±1.3 Co-O(3) 5.40.7 1.96±0.02 0.7 7.6±1.3 0.4±0.2 397 oC (H2) Co-O(2) 2.40.7 2.33±0.02 0.9 6.9±2.5 3.6±0.5 Co-O(3) 4.80.4 1.98±0.05 0.7 8.4±1.0 0.7±0.2 417 oC (H2) Co-O(2) 3.74.1 2.12±0.33 0.9 16.2±11.0 1.3±2.1 Co-O(3) 4.12.2 2.18±0.25 0.7 23.5±12.4 5.7±5.9 436 oC (H2) Co-Co(2) 14.61.6 2.990.01 -5.7 15.41.1 -0.20.1 Co-O(2) 6.70.7 2.140.12 0.7 12.11.8 0.80.4 455 oC (H2) Co-Co(1) 0.80.3 2.450.05 5.6 6.03.0 -0.40.6 Co-Co(2) 17.24.2 3.030.01 -5.7 17.42.4 0.20.5 Co-O(2) 5.81.4 2.140.01 0.7 10.93.0 0.50.6 475 oC (H2) Co-Co(1) 3.00.6 2.540.03 5.6 10.02.5 0.80.4 Co-Co(2) 14.24.4 3.010.03 -5.7 18.63.1 -0.40.7 Co-O(2) 4.81.5 2.160.03 0.7 13.74.9 1.41.0 494 oC (H2) Co-Co(1) 3.80.5 2.510.01 5.6 112.0 0.40.3 Co-Co(2) 12.13.6 3.020.01 -5.7 18.83.0 0.10.7 Co-O(2) 3.51.2 2.150.02 0.7 11.34.2 1.30.8 513 oC (H2) Co-Co(1) 4.80.4 2.520.02 5.6 11.51.2 0.50.2 Co-Co(2) 8.72.3 3.010.01 -5.7 17.42.5 -0.30.5 Co-O(2) 3.31.3 2.180.05 0.7 15.26.2 2.21.3 533 oC (H2) Co-Co(1) 7.00.3 2.540.04 5.6 13.60.7 0.90.1 Co-Co(2) 11.12.6 2.960.06 -5.7 24.02.8 -1.60.7 Co-O(2) 4.11.4 2.280.15 0.7 24.75.5 7.61.4
46 Table 2. Continued.
Sample Condition Interactiona) N R (Å) E0 (eV) σ2 (10–3 Å2) C3 (10–3 Å3) Co/SIO 552 oC (H2) Co-Co(1) 7.00.3 2.530.03 5.6 13.30.6 0.60.1 Co-Co(2) 6.82.3 2.970.05 -5.7 21.54.0 -1.09.5 Co-O(2) 2.61.0 2.290.16 0.7 19.88.0 9.22.1 572 oC (H2) Co-Co(1) 8.00.3 2.530.03 5.6 14.10.6 0.70.1 Co-Co(2) 4.91.8 2.950.07 -5.7 20.04.0 -1.60.9 Co-O(2) 1.20.2 2.310.18 0.7 4.91.9 11.10.2 591 oC (H2) Co-Co(1) 7.91.6 2.510.03 5.6 13.81.6 0.50.4 Co-Co(2) 3.54.1 2.900.01 0.7 19.213.4 -2.44.2 610 oC (H2) Co-Co(1) 9.41.1 2.530.03 5.6 15.41.3 0.60.4 629 oC (H2) Co-Co(1) 9.31.1 2.520.03 5.6 14.91.2 0.60.4 649 oC (H2) Co-Co(1) 9.51.2 2.520.03 5.6 15.01.3 0.80.4 668 oC (H2) Co-Co(1) 9.11.4 2.510.03 5.6 15.31.5 0.50.5 687 oC (H2) Co-Co(1) 9.21.0 2.500.02 5.6 15.61.1 0.40.3 707 oC (H2) Co-Co(1) 9.71.0 2.500.03 5.6 16.61.1 0.40.3 726 oC (H2) Co-Co(1) 9.21.2 2.500.03 5.6 15.90.1 0.60.4 746 oC (H2) Co-Co(1) 10.00.7 2.480.01 5.6 16.90.8 0.30.2
47
Table 3. The optimized structure parameters for Co/SIO-CA during the TPR process.
Sample Condition Interactiona) N R (Å) E0 (eV) σ2 (10–3 Å2) C3 (10–3 Å3) Co foil r.t. (air) Co-Co(1) 12fixed 2.480.01 5.61.1 6.10.3 -0.10.1
CoO r.t. (air) Co-Co(2) 12fixed 2.980.01 -5.71.7 7.00.5 -0.20.1
Co-O(2) 6fixed 2.130.02 0.72.1 6.31.6 0.30.4
Co3O4 r.t. (air) Co-O(3) 5.3fixed 1.910.01 0.91.9 3.70.6 0.10.1 Co/SIO-CA r.t. (H2) Co-O(3) 5.00.9 1.930.05 0.9 3.82.3 0.20.7 48 oC (H2) Co-O(3) 4.70.4 1.900.03 0.9 4.41.1 -0.20.4 68 oC (H2) Co-O(3) 4.70.4 1.900.03 0.9 4.51.0 -0.30.3 87 oC (H2) Co-O(3) 4.70.4 1.900.03 0.9 4.61.0 -0.20.4 106 oC (H2) Co-O(3) 4.70.4 1.900.03 0.9 4.71.6 -0.30.4 126 oC (H2) Co-O(3) 4.70.6 1.900.04 0.9 4.71.6 -0.20.6 145 oC (H2) Co-O(3) 4.70.6 1.900.04 0.9 4.71.6 -0.30.6 165 oC (H2) Co-O(3) 4.70.6 1.900.04 0.9 4.71.6 -0.20.5 184 oC (H2) Co-O(3) 4.70.6 1.900.04 0.9 4.81.6 -0.20.6 204 oC (H2) Co-O(3) 4.60.6 1.900.04 0.9 4.91.5 -0.20.5 224 oC (H2) Co-O(3) 4.60.6 1.900.04 0.9 4.91.5 -0.20.5 243 oC (H2) Co-O(3) 4.60.5 1.900.04 0.9 5.01.4 -0.20.5 263 oC (H2) Co-O(3) 4.60.5 1.900.03 0.9 4.91.4 -0.20.5 282 oC (H2) Co-O(3) 4.60.6 1.900.04 0.9 5.21.5 -0.20.5 302 oC (H2) Co-O(3) 4.61.7 1.940.01 0.9 4.24.9 0.21.0 322 oC (H2) Co-O(3) 4.50.5 1.900.04 0.9 5.31.5 -0.20.5 341 oC (H2) Co-O(3) 4.40.5 1.900.03 0.9 5.61.4 -0.20.5 361 oC (H2) Co-O(3) 4.20.5 1.900.03 0.9 6.11.4 -0.30.5