Chapter 3 Knowledge Exchanges and Innovation
in Connected Firms: Evidence from
Upstream-Downstream Relationships
権利
Copyrights 日本貿易振興機構(ジェトロ)アジア
経済研究所 / Institute of Developing
Economies, Japan External Trade Organization
(IDE-JETRO) http://www.ide.go.jp
journal or
publication title
New Challenges in New Economic Geography
page range
83-130
year
2010-03
Kumagai, Satoru, ed. 2010. New Challenges in New Economic Geography. Research Paper. Chiba: Institute of Developing Economies.
Chapter 3 Knowledge Exchanges and Innovation in Connected
Firms: Evidence from Upstream-Downstream Relationships
Tomohiro MACHIKITA
*aAbstract
This paper proposes evidences for linking innovation and knowledge exchanges in developing economies towards a comprehensive theory of new economic geography in the knowledge based spatial economy. Firms which dispatched engineers to customers achieved more innovations than firms which did not. Mutual sharing of knowledge also stimulates innovations. A just-in-time relationship is effective for dealing with upgrading production process. But such strong complementarities with partners are not effective for product innovation.. These evidences support the hypothesis that face-to-face communication and complementarities among production linkages have different roles in knowledge creation. Keywords: Innovation, network, knowledge exchanges, insider econometrics
JEL classification: O31, O32, R12
*a Researcher, Economic Integration Studies Group, Inter-disciplinary Studies Center, IDE
1. INTRODUCTION
This paper proposes a new mechanism for linking innovations (product and process innovations) and networks in developing economies to identify explicit linkages between production and information. It also investigates the empirical implications of this new mechanism using survey data gathered from manufacturing firms in four megacities in East Asia. Our sampling cities are located in Indonesia, the Philippines, Thailand, and Vietnam. We collected firm-level evidence on innovations, linkages between production and information, and the respondent firms’ own characteristics using mail surveys and field interviews.
How do face-to-face communication or tacit knowledge exchanges matter for product and process innovation? What are the consequences of frequent communications concerning innovation trials? This paper attempts to quantify these questions about knowledge transmission in relation to production linkages, so as to lead to higher innovation performance. Our estimates will be useful in discussing the impact of small (and hypothetical) subsidies for upgrading knowledge-exploiting and knowledge-creation (or knowledge-exploring) activities for firms in production networks. Likewise, this paper discusses the policy implications of our findings and presents some of the theoretical background necessary to evaluate the extent of production-related knowledge in industry upgrading.
There is a dearth of empirical research that precisely captures the knowledge transmission mechanism through inter-firm communication. For example, Javorcik (2004) and Blalock and Gertler (2008) find the backward linkages’ impact on productivity upgrading for upstream suppliers from MNCs’ customers. There is also a lack of quantitative evidence for rigorously identifying the effects of production-related knowledge and the form of communications in upstream-downstream relations. Since we need to quantify the contribution of production networks to innovation, this paper presents detailed information about production linkages, product and process innovation, and the creation of new markets. This field survey-based information provides findings that are lacking in previous studies.
The majority of the previous studies on the effects of geographic proximity on innovation used the local average of R&D expenditures or the number of R&D engineers as an explanatory variable. These studies assumed that all firms in a local area benefit equally from the local average of R&D activities. Even if this assumption were plausible on average, it is natural that the role of knowledge flows in production linkages and the volume of interactions will vary among linkages. That is why we must go beyond geographic proximity, collect information about linkages directly, and carefully investigate the effects of each type of production linkage on innovation.
To examine the role of local production linkages on product innovations, we need to identify the extent of companies’ investment in R&D, the exact channels used to upgrade existing products, the geographic extent of new market creation, and the emergence of local alliances to introduce a new product. We will build a simple model to explain the large variation of product innovation across firms with and without R&D activities or multiple production linkages. This simple theoretical framework will be based on the reduced-form regression model and will provide some interpretations of the empirical estimates of the effect of two factors, i.e., the variety of production linkages and engineer-level communications, on innovations. Estimating the empirical elasticity of production linkages or micro-level communications on innovation will enable us to detect the exact channels of process and product innovation as well as the creation of new markets.
This paper will investigate the role of production networks in industry upgrading by documenting the spatial architecture of upstream and downstream firms in developing economies and examining the network effects on innovation. Local network externalities are a mechanism for understanding the relationship between production networks and innovation. Endogenous growth theory, particularly Romer (1986, 1990), emphasizes the importance of innovation in economic growth. However, the internal mechanism essentially remains a black box. Lucas (1988) identified local knowledge spillovers as important sources of economic growth. Glaeser, Kallal, Scheinkman, and Shleifer (1992) showed city-level evidence of the role of knowledge spillovers. Conley and Udry (2009) studied the role of communication networks in determining the importance of learning from others. This paper
is a new attempt to open the black box of local interactions-driven innovation in order to detect the knowledge exchanges by using the case of upstream-downstream relations.
This paper also focuses on production networks to quantify the extent to which firms are motivated to innovate by information flows with customers or suppliers. The lack of empirical studies and the potential heterogeneity in production-network availability raise several empirical questions about the effects of innovation networks. The specific question we are attempting to answer is how production networks affect firms’ incentive to innovate when inter-firm linkages become dense. How do firms innovate if communication with their suppliers increases? Should firms respond to information flows from their consumers? This paper empirically explores these questions.
To summarize the above introduction, this paper will present and attempt to explain two findings which are basically consistent with the network-based theory of innovation. Firstly, firms with face-to-face communications at the engineer level and firms with frequent interactions with production partners are successful in implementing innovation, particularly organizational change directed towards external markets, and process innovations such as the creation of new markets and the securing of new sources of input. Secondly, no matter how effective the ‘just-in-time’ system (‘JIT’ hereafter) is in dealing with disequilibria, strong complementarities like JIT lead to attitudes that encourage the maintenance of the status quo. This paper also constructs a new framework linking product and process innovations and explicit knowledge exchanges between firms in developing economies. We assume that detailed evidence of production linkages provides information on knowledge exchanges between firms and their partners (customers and suppliers). Identifying detailed evidence of linkages opens a black box of the knowledge creation and learning processes among firms that are deeply intertwined with internal and international production chains. In particular, we construct a canonical model of knowledge exchanges of engineers between firms and their partners, and we also investigate the empirical implications of this mechanism using survey data gathered from manufacturing firms in five megacities in East Asia. The five cities are located in Indonesia, the Philippines, Thailand and Vietnam, and include two cities, Hanoi and Ho Chi Minh City, in Vietnam. We collected firm-level evidence on product and
process innovations as well as mutual knowledge exchanges between upstream-downstream firms, in addition to detailed information on technology transfer, linkages between production and information, and the respondent firms’ own characteristics using mail surveys and field interviews.
The contribution of this paper lies in its methodologies for detecting the linkage impact of innovation and opening up the black box of the endogenous growth model of innovation in light of mutual knowledge exchanges between upstream-downstream relations in industrial development. Microeconometric evidence suggests that mutual knowledge exchanges drive innovation as well as one-way flows of information from partners after controlling self-selection (i.e., ‘teachers’ achieve more innovation than ‘students’). Some evidence is sufficiently robust to conclude that mutual knowledge exchanges matter.
2. THEORY OF LEARNING AND INNOVATION
We discuss herein the reasons why firms with direct information flows, especially face-to-face communication and frequent exchanges of information, play an important role in achieving product and process innovations. In our empirical setting, we focus on exchanges of engineers and JIT information between upstream and downstream firms. In particular, compared to firms that do not accept engineers from their main partners or dispatch engineers to their main partners, firms that interact with their main partners are more likely to introduce new product varieties, organizational changes in response to changes in the market environment, and market-based process innovations.
2.1 The Value of Knowledge Diversity
One reason for the success of firms with different types of linkages is that each type of linkage provides unique information about opportunities for upgrading business processes as well as about changes in the market. The linkages’ variable is composed of two different types of linkages: production and intellectual linkages. The former refers to linkages with
several production partners that are located within or between areas of concentration. The empirical results also imply that two extremely different types of linkages complement product and process innovations. These linkages do not cancel out each other’s contributions. Cassiman and Veugelers (2002, 2006), Vega Jurad, Gutiereez-Gracia, Fernandez-de-Lucio and Manjarres-Henriquez (2008), Frenz and Ietto-Gilles (2009) clearly suggest that the combination of two different sources of knowledge is valuable for innovation. Saxenian (1996) emphasizes the importance of information externalities within an agglomeration area, leading to a higher cycle of knowledge creation, based on evidence from Silicon Valley. Saxenian (2006) shows that Indian or Chinese technicians coming back from Silicon Valley combine the knowledge they have gained with local knowledge to create new businesses. Jovanovic and Rob (1989) and Keely (2003) provide some microeconomic explanations of knowledge exchanges over time. Most recently, Berliant and Fujita (2008) formalize in detail that knowledge creation depends on appropriate diversity of knowledge held by two persons. 2.2 Accuracy Arising from Face-to-Face and Frequent Interactions
Product and process innovations are, by nature, a process of trial and error. One of the reasons why many types of linkages and face-to-face or frequent communications are beneficial to innovations is that the number of types of linkages is considered to imply the usage of instruments that help produce more accurate information compared to trial and error. If firms have many types of production linkages or have face-to-face and frequent information exchanges, the number and diversity of linkages should insure accuracy when firms invest in innovation. There is some literature that focuses on the accuracy of information from local interactions across different fields. In the setting of agricultural innovation, for example HYV (high-yield varieties), Foster and Rosenzweig (1995) develops the Bayesian framework of learning by doing and learning from others in a village, and estimates the neighbourhood impact of introducing HYV (which is a risky project in the initial stages). They show the significant impact of neighbourhood experience in updating information about optimal input volume. In the setting of labour mobility, Almeida and Kogut (1999) and Song, Almeida and Wu (2003) empirically show that there is a large level
of labour mobility enabled through new hiring across firms within a region and that engineers cite patents to other engineers located within the same region. These behaviours within a cluster stimulate the acquisition of accurate information from local interactions. On the other hand, Berliant and Fujita (2008, 2009) emphasize the dynamic implications of knowledge creation based on face-to-face and frequent communications over time.
2.3 Berliant and Fujita in the Setting of Upstream-Downstream Linkages
We derive the organizational (upstream and downstream relationship) implications of Berliant and Fujita (2008, 2009) here. Berliant and Fujita (2008, 2009) build a microeconomic model of knowledge creation and study its dynamic implications for long-term relationships. Their model rationalizes the optimal level of diversity for collaborations. There are two key assumptions: (1) a low level of diversification does not create any new knowledge and (2) diversification makes communications costly. These assumptions lead to the following three implications. Firstly, knowledge exchanges through face-to-face and frequent interactions make two agents homogeneous and efficient at communicating with each other. Secondly, cooperation and strong complementarities lead to attitudes that encourage maintenance of the status quo. Finally, the knowledge creation from frequent communications will diminish over time. We test the implications of this model using a setting of information flows from upstream and downstream linkages.
Firms with direct information flows from partners tend to be more successful because of the value brought by face-to-face and frequent interaction. Accepting engineers from the main supplier ensures the transfer of knowledge relating to raw materials, parts and components. If the suppliers are based in a more competitive market, the main supplier has to pay the costs of knowledge transfer, i.e., dispatching engineers to the main customer. Dispatching engineers to the main customer also ensures the transfer of knowledge about production processes and market changes. Since it is critically important for firms to acquire the most accurate information about market changes, the supplier dispatches the engineers from an upstream to a downstream level. The empirical results suggest that there are also backward linkages leading to information flows from the customer to the supplier. Because
most suppliers are keen to acquire ISO certification to help them expand their market, they need to communicate face to face with their main customer to pay the costs of dispatching engineers. The JIT system also provides an opportunity for frequent interactions between customers and suppliers. Frequent interactions insure the accuracy of information about market changes. JIT is effective for dealing with disequilibria. This seems to be consistent with Schultz (1975). Although there are benefits from strong complementarities, such strong complementarities as JIT lead to attitudes that encourage maintenance of the status quo, leading to lower levels of product innovation. We test these implications in Section 3. 2.4 Transferred Technologies and Mutual Knowledge Exchanges with Partners
Interfirm linkages entail various forms of guidance and learning, such as exchanges of engineers. The sources of interfirm guidance and learning may exist in controlling quality, costs, delivery, and environment management (QCDE) within the firm as well as within the (international) production chain. Such total quality management plays an important role in knowledge exchanges between upstream-downstream firms. Not only customers but also suppliers give guidance to their partner firms. That is, firms learn about demand for specific products from their customers while firms receive technical information from their suppliers in the face of new demand. We assume that each firm requires such information spillovers through backward and forward linkages to meet the demand. Therefore, information exchanges between demand and technologies spill over within the (international) production chain. Information exchanges may not take the form of ‘encoded’ exchanges as propounded by Polanyi (1966, 1967). More concretely, communication between firms and their partners is not transcribed each other when the specific features of demand and technologies become complicated.
This paper focuses on the interaction of two-way information flows from downstream to upstream (backward linkage) and from upstream to downstream (forward linkage) instead of examining of one-way information flow. If engineers dispense their professional knowledge about production processes, then accepting engineers from partners would appear to be a learning activity for respondent firms, while dispatching engineers to partners would
appear to be a teaching activity for the firms. If firms absorb their professional knowledge from their partners, then accepting engineers from partners would appear to be a teaching activity for respondent firms, while dispatching engineers to partners would appear to be a learning activity for the firms. To identify which flows are learning or teaching is difficult without direct information about the ‘teachers’ and ‘students.’ Since this paper prefers to avoid this identification problem, we assume that ‘teachers’ receive benefits from ‘students’ as well as ‘students’ learning about new production process, materials and markets from ‘teachers.’ We test the implication of this in upstream-downstream relations.
2.5 Managerial Abilities as Technology
Seminal works presenting recent empirical analyses of management (Bloom and van Reenen 2007, 2010a, b) have emphasized that differences in management practices play a crucial role in productivity dispersion within a country and across countries. Bloom, Eifert, Mahajan, McKenzie, and Roberts (2010) also provides experimental evidence of modern management practices for productivity upgrading among Indian textile factories. However, they find that the treated factories achieve not only productivity upgrading but also greater profitability than the control factories in this experimental setting but that it is difficult to identify the impact of adoption of modern management practices and changing managerial abilities of managers. We test this by focusing on the background of top management.
3
EVIDENCE OF LEARNING FROM PARTNERS
3.1 Data
A. Sampling
We used the dataset from the Establishment Survey on Innovation and Production Network for selected manufacturing firms in four countries in East Asia. We created this dataset in December 2008 in Indonesia, the Philippines, Thailand, and Vietnam. The sample population is restricted to selected manufacturing hubs in each country (JABODETABEK area, i.e.,
Jakarta, Bogor, Depok, Tangerang and Bekasi for Indonesia; CALABARZON area, i.e., Cavite, Laguna, Batangas, Rizal and Quezon for the Philippines; Greater Bangkok area for Thailand; and Hanoi area for Vietnam). A total of 600 firms agreed to participate in the survey: (1) 149 firms in Indonesia, (2) 203 firms in the Philippines, (3) 112 firms in Thailand and (4) 137 firms in Vietnam.
The sample industries consist of 17 manufacturers in each country. Since the aggregate composition of industries is different among the four countries, we focused on just three major industries in each of the four countries: food processing, apparel and wood products for Indonesia; food processing, apparel and electronics for the Philippines; food processing, apparel and chemical products for Thailand; chemical products, machinery and electronics for Vietnam.
B. Firm characteristics
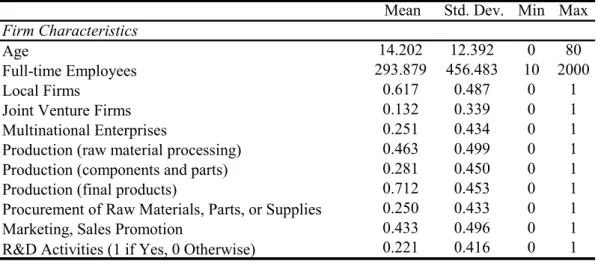
Table 1 presents the summary statistics of the main variables. The average age of a firm is 14 years, with a standard deviation of 12 years. Firm size is also widely dispersed. The average size is 293 employees, with a standard deviation of 456. Since our sampling strategy covers all of the manufacturing in each country, some firms have more than 2,000 employees while some firms are very small, with fewer than 20 employees. Of the total number surveyed, approximately 60% are local firms; 13%, joint-venture firms; and 25%, MNEs.
Firm function is classified into one of five categories here. Forty-six percent of the firms process raw materials. Twenty-eight percent produce components and parts, while 71% produce final goods. A total of 24% procure raw materials, while 43% carry out marketing activities.
Table 1: Summary Statistics of Firm Characteristics
Mean Std. Dev. Min Max
Age 14.202 12.392 0 80
Full-time Employees 293.879 456.483 10 2000
Local Firms 0.617 0.487 0 1
Joint Venture Firms 0.132 0.339 0 1 Multinational Enterprises 0.251 0.434 0 1 Production (raw material processing) 0.463 0.499 0 1 Production (components and parts) 0.281 0.450 0 1 Production (final products) 0.712 0.453 0 1 Procurement of Raw Materials, Parts, or Supplies 0.250 0.433 0 1 Marketing, Sales Promotion 0.433 0.496 0 1 R&D Activities (1 if Yes, 0 Otherwise) 0.221 0.416 0 1 Firm Characteristics
C. Dependent variables
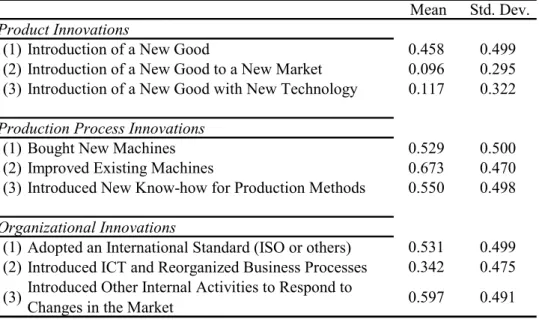
Tables 2a and 2b present our main interest: innovation. Innovative activities reflect several dimensions of industry upgrading. There is no single measure to evaluate the success or failure of a firm’s policy in industry upgrading, so we drew up four different groups of measures: new goods, adoption of new technologies and organizational structures, new sources of procurement, and creation of new markets. We classified innovations into the following three categories: (1) product innovation (introduction of new goods), (2) process innovations, including adoption of new technology and organizational changes to improve product quality and cost efficiency and (3) securing of new customers to sell to and new suppliers to procure existing products from, efficiently.
While approximately 45% of the sample firms, on average, are able to make product innovations in general, it appears that the majority of firms find it difficult to achieve certain kinds of product innovations. Only 9% said they were able to introduce new goods to new markets, while only 11% were able to introduce new goods using new technology. This situation may be due to the higher fixed costs of creating new markets and using new technology, in addition to the typical costs associated with product innovations.
In contrast, more than 50% of the firms were able to introduce process innovations, such as (1) buying new machines, (2) improving existing machines, (3) introducing new know-how for production processes, (4) earning certification from the International
Standards Organization (ISO) and (5) introducing internal activities to respond to changes in the markets.
Table 2a: Summary Statistics of Product, Process, and Organizational Innovat
Mean Std. Dev. Product Innovations
(1) Introduction of a New Good 0.458 0.499 (2) Introduction of a New Good to a New Market 0.096 0.295 (3) Introduction of a New Good with New Technology 0.117 0.322 Production Process Innovations
(1) Bought New Machines 0.529 0.500 (2) Improved Existing Machines 0.673 0.470 (3) Introduced New Know-how for Production Methods 0.550 0.498 Organizational Innovations
(1) Adopted an International Standard (ISO or others) 0.531 0.499 (2) Introduced ICT and Reorganized Business Processes 0.342 0.475 (3) Introduced Other Internal Activities to Respond to
Changes in the Market 0.597 0.491
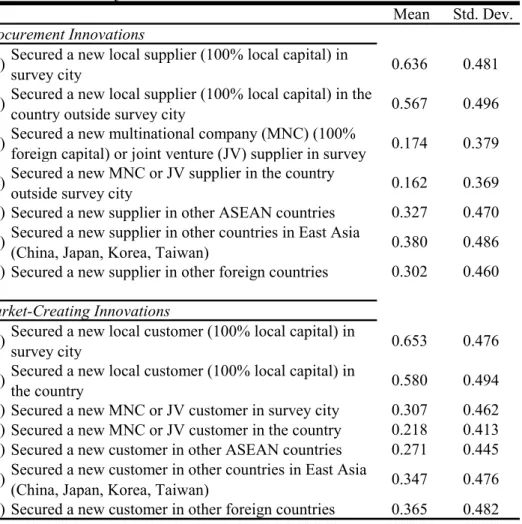
Table 2b shows that firms reported different experiences in the task of securing new customers and suppliers, depending on their locations and the characteristics of the customers and suppliers. The probability of securing a new local supplier or customer in a metropolitan area in which the respondent is also located is higher (63% for securing a new supplier and 65%t for securing a new customer) than the probability of securing a new supplier or customer outside the metropolitan area (56% for securing a new supplier and 58% for securing a new customer). Securing a new supplier or customer in other ASEAN countries is more difficult for the four countries involved in the study (325 for securing a new supplier and 27% for securing a new customer). Sample firms also found it difficult to buy inputs from, or sell products to, MNEs. Only 17% of the firms successfully secured new multinational suppliers within the metropolitan area, while only 16% were able to do so outside the metropolitan area. Of the two tasks, however, firms found it easier to sell products to MNEs than to buy inputs from them. Nearly 30% of the firms successfully secured new multinational customers within an agglomeration area, while 21% did so outside.
Table 2b: Summary Statistics of Market-based Innovations
Mean Std. Dev. Procurement Innovations
(1) Secured a new local supplier (100% local capital) in
survey city 0.636 0.481
(2) Secured a new local supplier (100% local capital) in the
country outside survey city 0.567 0.496 (3) Secured a new multinational company (MNC) (100%
foreign capital) or joint venture (JV) supplier in survey 0.174 0.379 (4) Secured a new MNC or JV supplier in the country
outside survey city 0.162 0.369 (5) Secured a new supplier in other ASEAN countries 0.327 0.470 (6) Secured a new supplier in other countries in East Asia
(China, Japan, Korea, Taiwan) 0.380 0.486 (7) Secured a new supplier in other foreign countries 0.302 0.460 Market-Creating Innovations
(1) Secured a new local customer (100% local capital) in
survey city 0.653 0.476
(2) Secured a new local customer (100% local capital) in
the country 0.580 0.494
(3) Secured a new MNC or JV customer in survey city 0.307 0.462 (4) Secured a new MNC or JV customer in the country 0.218 0.413 (5) Secured a new customer in other ASEAN countries 0.271 0.445 (6) Secured a new customer in other countries in East Asia
(China, Japan, Korea, Taiwan) 0.347 0.476 (7) Secured a new customer in other foreign countries 0.365 0.482
D. Independent variables explaining innovation performance
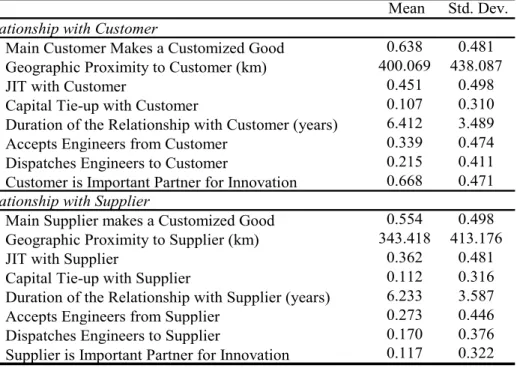
Industries in the sample are primarily involved in manufacturing and exporting and are currently operating in East Asia. To keep pace with domestic demand and stay on top of international competition, the firms adopt new technologies, acquire new organizational forms to adapt to market changes, create new markets, find new inputs to improve product quality and cost efficiency, and introduce new products. They utilize the external environment and local/international markets to upgrade themselves. Therefore, it is reasonable to say that they are more likely to adapt new technology and undertake organizational changes in response to the external environment and the demands made by their respective local and international markets. Forty-five percent of firms adopt the JIT
system with their main customer. Thirty-four percent of firms accept engineers from their main customer, while 21.5% of firms dispatch engineers to their main customer. On the other hand, 36% of firms adopt the JIT system with their main supplier, 27% of firms accept engineers from their main supplier, and 17% of firms dispatch engineers to their main supplier.
Table 3: Summary Statistics of the Relationship with Customer and Supplier Mean Std. Dev.
Relationship with Customer
1 Main Customer Makes a Customized Good 0.638 0.481 2 Geographic Proximity to Customer (km) 400.069 438.087
3 JIT with Customer 0.451 0.498
4 Capital Tie-up with Customer 0.107 0.310
5 Duration of the Relationship with Customer (years) 6.412 3.489
6 Accepts Engineers from Customer 0.339 0.474
7 Dispatches Engineers to Customer 0.215 0.411
8 Customer is Important Partner for Innovation 0.668 0.471
Relationship with Supplier
1 Main Supplier makes a Customized Good 0.554 0.498 2 Geographic Proximity to Supplier (km) 343.418 413.176
3 JIT with Supplier 0.362 0.481
4 Capital Tie-up with Supplier 0.112 0.316
5 Duration of the Relationship with Supplier (years) 6.233 3.587
6 Accepts Engineers from Supplier 0.273 0.446
7 Dispatches Engineers to Supplier 0.170 0.376
8 Supplier is Important Partner for Innovation 0.117 0.322
E. Production networks in space
We also focus on two issues related to production linkages between the main customer and supplier in a spatial economy: (1) exchange of engineers and (2) JIT. We have two competing theories of the spatial architecture of production networks to explain co-location between two firms. Firstly, if fixed search costs for production partners (or setup and coordination costs of alliances) decrease with capital structure between firms, it is efficient for firms with capital tie-ups to form production linkages with their affiliates. Secondly, if communication costs for meetings and information exchanges increase with geographic distance between firms, the two firms involved will form production linkages that will tend to co-locate in one area. Capital tie-up with affiliates is a good proxy for the existence of production linkages. If
both of the first and second conjectures are accurate in East Asia, firms with capital tie-ups will tend to locate nearer to each other than firms without capital tie-ups.
That is, the geographic extent of input-output linkage is more locally limited for firms with capital tie-ups than for firms without tie-ups due to the needs of the JIT system or frequent information exchanges for quality upgrading. This is a transport costs-based theory of co-location. This explanation is also derived from standard spatial economy. Less productive firms or less differentiated goods production will forge local or nearby alliances, while more productive firms do it globally. For given variable communication costs of alliances, the geographic extent of input-output linkages should be ruled out by productivity. If communication costs increase, the probability of network formation with remote firms could decrease.
Secondly, there is the enforceability-based theory of agglomeration. This theory emphasizes the monitoring effect of production networks from buyer to seller. If buyers do not have a long-term or tight relationship with the producers, such buyers will have to frequently monitor and check product quality. The cost of communication is an increasing function of geographic distance between buyers and sellers. If this conjecture is correct, for example, firms with capital tie-ups need not be co-located because these buyers and sellers would already know each other. The geographic extent of input-output linkage is locally limited for firms without capital tie-ups compared to firms with capital tie-ups because of these monitoring needs. This section answers the following questions relating to production networks in space: (1) Are there any differences in the input-output linkages across firms and countries in East Asia?, (2) How strong are the linkages between customers and suppliers? and (3) Are firms with production linkages also important partners in innovation?
Exchanging engineers between firms is also the main proxy for exchanging production-related knowledge through production linkages. Table 4 compares the geographic proximity of firms that accept engineers from their main trading partners with the geographic proximity of firms that choose not to do so with their main partners. The results show that firms which decide to accept engineers from their main customers and suppliers tend to be located farther away from these trading partners (669 km from customer and 567 km from
supplier for firms that accept engineers versus 318 km from customer and 237 km from supplier for firms that do not accept engineers).
From Customer From Supplier Variable (km) Obs Mean S.D.
Geographic Proximity to Customer 359 318.5 403.2 Geographic Proximity to Supplier 331 237.6 340.1 Geographic Proximity to Customer 64 319.3 404.1 Geographic Proximity to Supplier 57 368.6 404.7 Geographic Proximity to Customer 23 282.8 389.2 Geographic Proximity to Supplier 23 501.4 454.1 Geographic Proximity to Customer 138 669.4 443.5 Geographic Proximity to Supplier 134 567.0 474.8 Table 4: Geographic Proximity to Customer/Supplier of Firms that Accept Engineers from Customer/Supplier
No No
Yes No
No Yes
Yes Yes
Table 5 compares the geographic proximity of firms that dispatch engineers to their main customers and suppliers with the geographic proximity of firms that do not dispatch engineers to their main partners. Firms save on communication costs to remote areas by accepting engineers from their main customers and suppliers if these trading partners are located far from them. This is also true for firms that decide to dispatch engineers to their main partners. By doing so, firms can save on communication costs, especially if the partners are located in remote areas (500 km from customer and 348 km from supplier for firms that dispatch engineers versus 391 km from customer and 342 km from supplier for firms that do not dispatch engineers).
To Customer To Supplier Variable (km) Obs Mean S.D.
Geographic Proximity to Customer 439 391.4 434.3 Geographic Proximity to Supplier 407 342.2 409.5 Geographic Proximity to Customer 48 295.5 397.3 Geographic Proximity to Supplier 41 361.1 418.8 Geographic Proximity to Customer 20 454.0 463.7 Geographic Proximity to Supplier 23 315.8 406.0 Geographic Proximity to Customer 77 500.6 464.3 Geographic Proximity to Supplier 74 348.7 439.9
Yes No
Table 5: Geographic Proximity to Customer/Supplier of Firms that Dispatch Engineers to Customer/Supplier
No No
No Yes
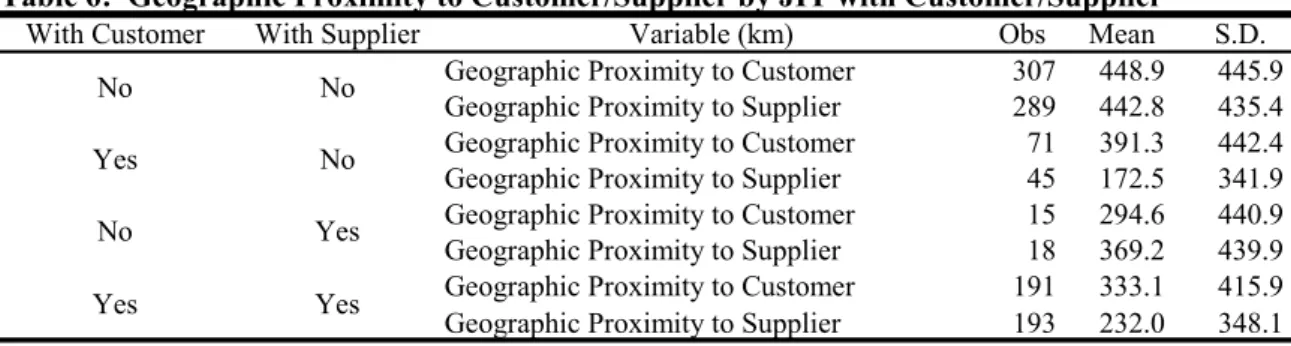
It is natural for firms to create a JIT system with locally concentrated partners. Table 6 relates the geographic proximity of a firm to its main customer and supplier and the use of a JIT system. Firms that have a JIT system with their main customer and supplier tend to be located nearer to their main trading partners than firms that have no JIT system with their main partners (333 km from customer with JIT and 232 km from supplier with JIT versus 448 km from customer without JIT and 442 km from supplier without JIT). The formation of the JIT system justifies co-location based on transport costs.
Table 6: Geographic Proximity to Customer/Supplier by JIT with Customer/Supplier
With Customer With Supplier Variable (km) Obs Mean S.D.
Geographic Proximity to Customer 307 448.9 445.9 Geographic Proximity to Supplier 289 442.8 435.4 Geographic Proximity to Customer 71 391.3 442.4 Geographic Proximity to Supplier 45 172.5 341.9 Geographic Proximity to Customer 15 294.6 440.9 Geographic Proximity to Supplier 18 369.2 439.9 Geographic Proximity to Customer 191 333.1 415.9 Geographic Proximity to Supplier 193 232.0 348.1
Yes No
No Yes
Yes Yes
No No
3.2 Results
I describe the empirical content of face-to-face and frequent communications and the frequency effect of communications on innovations. We report the following internal effects of linkages which are useful for understanding the information flow through production linkages. Firstly, exchanges of engineers did stimulate information flow due to face-to-face communication. Secondly, the formation of a JIT system did provide the opportunity for frequent communication between suppliers and customers. Since the last section reports on the effect of the variety of linkages on product and process innovations, we relate the internal information flow through linkages to product and process innovations. This paper seeks to derive the firm’s knowledge production function.
We set the estimated equation as follows:
ic ic ic ic αINSIDE LINK βx u y = )= _ + + Pr( 1 ,
country c, the variable INSIDE_LINK proxies the meaning of information and knowledge flows between firms (exchanges of engineers and usage of a JIT system), x is other controls, i.e., age, size, status of exporting goods to foreign countries, status of importing intermediate goods from foreign countries, and country dummy variables, and a cross-sectional error term is represented by u. To simply regress innovation outcome to covariates, we focus on the estimated coefficient of INSIDE as the degree of innovation management technology across firms.
Table 7 reports the effects of accepting engineers from customers and suppliers on the introduction of new products. The dependent variable is equal to one if each firm introduces new products and is zero otherwise. The independent variable, accepting engineers from customers or suppliers, is equal to one if each firm accepts engineers from their main customer or supplier. Marginal effects are presented. Other control variables are MNEs, age, firm size, and country dummy variables. We separately estimate the impact of flows of engineers on product innovation by goods characteristics, that is, customized- and standard-goods production. As reported in Table 7, the coefficient for accepting engineers from suppliers is .329 with a standard error of .105, and it is statistically significant at the 1% level. Thus, firms that accept engineers from their main suppliers are likely to experience a significantly higher probability of product innovation than firms that do not accept engineers from their main suppliers. This effect holds true if the main customers and suppliers produce standard goods. Overall, product innovation is positively related to accepting engineers from the main suppliers and dispatching engineers to the main customers.
Table 7 presents the innovation impact of dispatching engineers to the main customers and suppliers. The dependent variable is product innovation. This is equal to one if each firm introduces new varieties and is zero if otherwise. The independent variable, dispatching engineers to customers or suppliers, is equal to one if each firm dispatches engineers to their main customers or suppliers. As reported in Table 7, the coefficient for dispatching engineers to the main customers is .153 with a standard error of .080 if the main customer produces customized goods. The coefficient for dispatching engineers to the main suppliers is .248 with a standard error of .100 if the main supplier produces standard goods. These results
suggest that the acceptance of engineers from the main supplier and the dispatching of engineers to the main partners are positively important for product innovation.
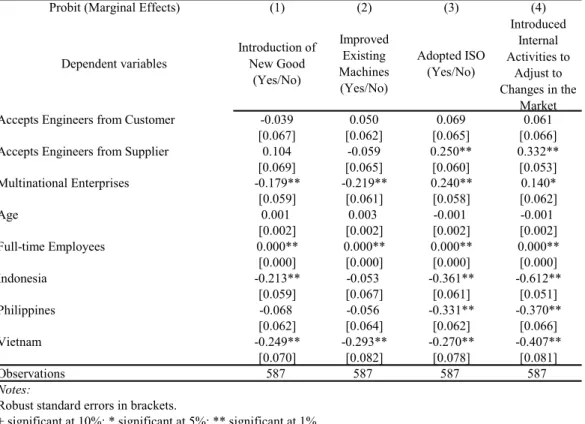
Probit (Marginal Effects) (1) (2) (3) (4)
Dependent variables Introduction of New Good (Yes/No) Improved Existing Machines (Yes/No) Adopted ISO (Yes/No) Introduced Internal Activities to Adjust to Changes in the Market Accepts Engineers from Customer -0.039 0.050 0.069 0.061
[0.067] [0.062] [0.065] [0.066] Accepts Engineers from Supplier 0.104 -0.059 0.250** 0.332** [0.069] [0.065] [0.060] [0.053] Multinational Enterprises -0.179** -0.219** 0.240** 0.140* [0.059] [0.061] [0.058] [0.062] Age 0.001 0.003 -0.001 -0.001 [0.002] [0.002] [0.002] [0.002] Full-time Employees 0.000** 0.000** 0.000** 0.000** [0.000] [0.000] [0.000] [0.000] Indonesia -0.213** -0.053 -0.361** -0.612** [0.059] [0.067] [0.061] [0.051] Philippines -0.068 -0.056 -0.331** -0.370** [0.062] [0.064] [0.062] [0.066] Vietnam -0.249** -0.293** -0.270** -0.407** [0.070] [0.082] [0.078] [0.081] Observations 587 587 587 587 Notes:
Robust standard errors in brackets.
+ significant at 10%; * significant at 5%; ** significant at 1% The reference country is Thailand.
Table 7: Engineer Acceptance from Customers/Suppliers and Product and Process Innovations
Let us move to process innovations. Table 8 presents the impact of accepting engineers from the supplier on improving existing machines. The coefficient for accepting engineers from the supplier is -.140 with a standard error of .081 if the main customer produces customized goods. The coefficient for accepting engineers from the supplier is .173 with a standard error of .080 if the main customer produces standard goods. The coefficient for accepting engineers from the supplier is -.242 with a standard error of .094 if the main supplier produces customized goods. The coefficient for accepting engineers from the supplier is .191 with a standard error of .053 if the main supplier produces standard goods. These results indicate that, if the main partners produce customized goods, it is not easy to improve existing machines at firms that accept engineers from suppliers. On the other hand,
if the main partners produce standard goods, accepting engineers from main suppliers stimulates the improvement of existing machines.
Table 8 reports the effect of dispatching engineers to the main partners on improving existing machines. The coefficient for dispatching engineers to the customer is .139 with a standard error of .074 if the main customer produces customized goods. The coefficient for dispatching engineers to the customer is .174 with a standard error of .089 if the main supplier produces customized goods. The coefficient for dispatching engineers to the supplier is .157 with a standard error of .060 if the main supplier produces standard goods. Thus, firms that dispatch engineers to customers and suppliers could experience a significantly higher probability of internal process innovation, involving the improvement of existing machines. In summary, process innovation leading to improved internal production efficiency is negatively related to accepting engineers from suppliers if production linkages are used to produce customized goods. On the other hand, process innovation is positively related to accepting engineers from suppliers if production linkages are used to produce standard goods. Process innovation is also positively related to dispatching engineers to customers if production linkages are used to produce customized goods.
Table 8 presents the effect of accepting engineers from suppliers on firms that are endeavoring to obtain ISO certification. The first column indicates that the coefficient for accepting engineers from the main supplier is .250 with a standard error of .060. Thus, firms that accept engineers from the main supplier have a significantly higher probability of becoming ISO certified. This is true if the main customer and supplier produce customized and standard goods, respectively. Table 8 reports the effect of dispatching engineers to the main customer. The coefficient for dispatching engineers to customers is .193 with a standard error of .067, indicating that firms which dispatch engineers to customers have a significantly increased probability of becoming ISO certified, which is considered to be a process innovation directed towards the external market.
Making investments to deal with disequilibria is another kind of process innovation. The dependent variable is equal to one if a firm invests in internal activities that will help it adjust to changes in the market. As reported in Table 8, the coefficient for accepting engineers from
the supplier is .332 with a standard error of .053. Thus, firms that accept engineers from suppliers are more likely to make investments that will enable them to adjust to changes in the market. Table 8 shows that the coefficient for dispatching engineers to the customer is .218 with a standard error of .059, while the coefficient for dispatching engineers to the supplier is .150 with a standard error of .073. The impact on process innovation of the practice of dispatching engineers is higher for firms that dispatch engineers to customers than for firms that dispatch engineers to suppliers in the face of market disequilibria or market turbulence. In summary, process innovation aimed at enabling a firm to respond to changes in the external market environment is positively related to the practice of accepting engineers from suppliers and dispatching engineers to the main customers.
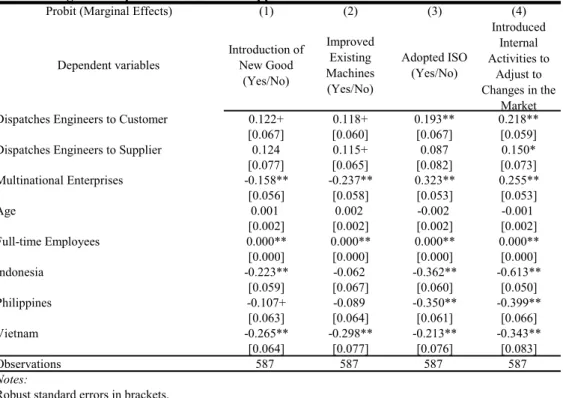
Probit (Marginal Effects) (1) (2) (3) (4)
Dependent variables Introduction of New Good (Yes/No) Improved Existing Machines (Yes/No) Adopted ISO (Yes/No) Introduced Internal Activities to Adjust to Changes in the Market Dispatches Engineers to Customer 0.122+ 0.118+ 0.193** 0.218**
[0.067] [0.060] [0.067] [0.059] Dispatches Engineers to Supplier 0.124 0.115+ 0.087 0.150* [0.077] [0.065] [0.082] [0.073] Multinational Enterprises -0.158** -0.237** 0.323** 0.255** [0.056] [0.058] [0.053] [0.053] Age 0.001 0.002 -0.002 -0.001 [0.002] [0.002] [0.002] [0.002] Full-time Employees 0.000** 0.000** 0.000** 0.000** [0.000] [0.000] [0.000] [0.000] Indonesia -0.223** -0.062 -0.362** -0.613** [0.059] [0.067] [0.060] [0.050] Philippines -0.107+ -0.089 -0.350** -0.399** [0.063] [0.064] [0.061] [0.066] Vietnam -0.265** -0.298** -0.213** -0.343** [0.064] [0.077] [0.076] [0.083] Observations 587 587 587 587 Notes:
Robust standard errors in brackets.
+ significant at 10%; * significant at 5%; ** significant at 1% The reference country is Thailand.
Table 8: Engineer Dispatch to Customers/Suppliers and Product and Process Innovations
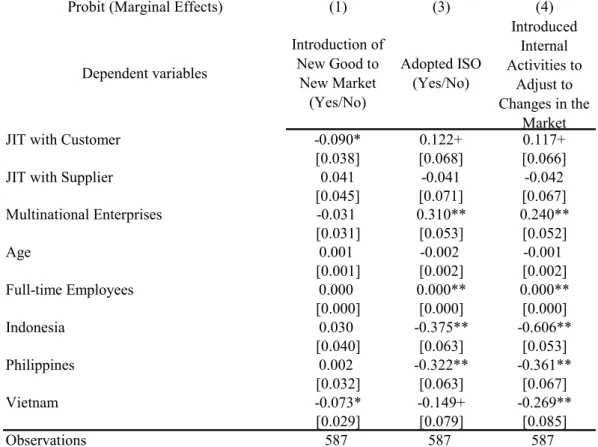
Finally, the formation of a JIT system is also a proxy of information exchanges through production linkages. Table 9 reports the impact of forming a JIT system with the main customer and supplier, on introducing new products to new markets, which is a type of
product innovation, or some combination of product innovations and market-creating innovations. The independent variables in forming a JIT system with the customer or supplier are equal to 1 if a firm forms a JIT system for production and distribution with its main customer or supplier, respectively, and are zero otherwise. Column 1 of Table 9 shows that the coefficient for a JIT system with the customer is -0.090 with a standard error of .038. Table 9 shows that the coefficient for a JIT system with the customer is -0.191 with a standard error of .051 if the customer produces a standard product. Colum 5 of Table 9 shows that the coefficient for a JIT system with the customer is -0.243 with a standard error of .053 if the supplier produces a standard product. These results indicate that JIT with a customer does not stimulate the introduction of new goods to new markets. On the other hand, Colum 5 of Table 9 shows that the coefficient for a JIT system with the supplier is 0.141 with a standard error of .069 if the supplier produces a standard product. This result indicates that JIT with a supplier stimulates the introduction of new goods to new markets.
Table 9 reports the impact of forming a JIT system with the main customer and supplier on earning ISO certification, which is a type of process innovation towards the external market. The independent variables in forming a JIT system with the customer or supplier are equal to 1 if a firm forms a JIT system for production and distribution with its main customer or supplier, respectively, and are zero otherwise. Table 9 shows that the coefficient for a JIT system with the customer is .245 with a standard error of .100 if the customer produces a standard product. The coefficient for a JIT system with the supplier is .225 with a standard error of .098 if the supplier produces a customized product. These results indicate that firms which form a JIT system with a customer have a significantly higher probability of getting ISO certified than firms that do not have a JIT system with their main customer.
Table 9 presents the impact of forming a JIT system with a customer on a firm’s ability to adjust to changes in the market. The empirical question here is whether a JIT system provides information flows relevant to market changes or market turbulence. The coefficient for a JIT system with the customer is .206 with a standard error of .102 if the customer produces a standard product, indicating that the firm which forms a JIT system with a
customer has a higher probability of investing in internal activities that will help it adjust to changes in the market. Overall, a process innovation that helps a firm adjust to changes in the market environment, for example, ISO certification or market turbulence, is positively related to operation of a JIT system with a customer.
Probit (Marginal Effects) (1) (3) (4)
Dependent variables Introduction of New Good to New Market (Yes/No) Adopted ISO (Yes/No) Introduced Internal Activities to Adjust to Changes in the Market
JIT with Customer -0.090* 0.122+ 0.117+
[0.038] [0.068] [0.066]
JIT with Supplier 0.041 -0.041 -0.042
[0.045] [0.071] [0.067] Multinational Enterprises -0.031 0.310** 0.240** [0.031] [0.053] [0.052] Age 0.001 -0.002 -0.001 [0.001] [0.002] [0.002] Full-time Employees 0.000 0.000** 0.000** [0.000] [0.000] [0.000] Indonesia 0.030 -0.375** -0.606** [0.040] [0.063] [0.053] Philippines 0.002 -0.322** -0.361** [0.032] [0.063] [0.067] Vietnam -0.073* -0.149+ -0.269** [0.029] [0.079] [0.085] Observations 587 587 587 Notes:
Dependent variables equal 1 if 'Introduction of new good to new market' is 'Yes'; 0 otherwise Robust standard errors in brackets.
+ significant at 10%; * significant at 5%; ** significant at 1% The reference country is Thailand.
Table 9: JIT with Customers/Suppliers and Product and Process Innovations
3.3 Summary
The empirical results suggest that firms with face-to-face communication at the engineer level and with frequent interaction with production partners are able to innovate successfully, particularly in the areas of organizational change directed towards external markets, and
market-based process innovations such as the creation of new markets and the securing of new sources of input. In particular, however, JIT does not stimulate the introduction of new goods to new markets, although it is effective for ISO certification and response to market turbulence. In summary, this result suggests that JIT is effective for dealing with disequilibria. However, such strong complementarities as JIT lead to attitudes that encourage maintenance of the status quo.
We offer the following three hypotheses as possible explanations for these results: (1) Different types of external sources (like engineers from a customer or supplier) and combinations of external sources and internal resources provide the value of knowledge diversity, (2) Different types of external sources provide the opportunity to obtain accurate information about other firms’ trials and errors, for firms without their own R&D department or sufficient internal resources, (3) Face-to-face communication and frequent interaction with production partners provide a chance to acquire deep and correct information about changes in the market and market turbulence.
4
EVIDENCE OF MUTUAL KNOWLEDGE EXCHANGES
4.1 Data
A. Sampling
Industries in the sample are primarily involved in manufacturing (and exporting for some firms) and are currently operating in East Asia. We used the dataset from the Establishment Survey on Innovation and Production Network for selected manufacturing firms in four countries in East Asia. We created this dataset in December 2009 in Indonesia, the Philippines, Thailand, and Vietnam. The sample population is restricted to selected manufacturing hubs in each country (JABODETABEK area, i.e., Jakarta, Bogor, Depok, Tangerang and Bekasi for Indonesia; CALABARZON area, i.e., Cavite, Laguna, Batangas, Rizal, and Quezon for the Philippines; Greater Bangkok area for Thailand; and Hanoi and Ho Chi Minh area for Vietnam). A total of 864 firms agreed to participate in the survey: (1) 183
firms in Indonesia, (2) 203 firms in the Philippines, (3) 178 firms in Thailand and (4) 300 firms in Vietnam. The sample industries consist of 17 manufacturers in each country.
B. Firm characteristics
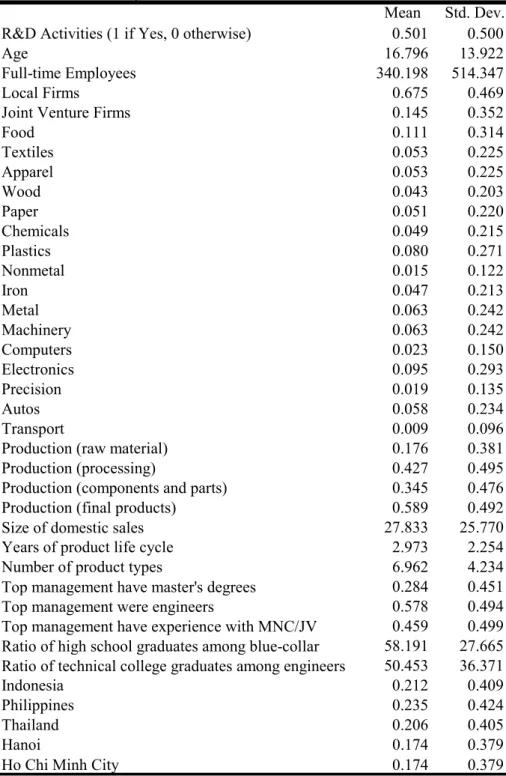
Table 10 presents the summary statistics of the firm characteristics. The average age of a firm is 16.8 years, with a standard deviation of 13.9 years. Firm size is also widely dispersed. The average size is 340 employees, with a standard deviation of 499. Since our sampling strategy covers all of the manufacturing in each country, some firms have more than 2,000 employees while some firms are very small, with fewer than 20 employees. Of the total number surveyed, approximately 67.5% are local firms; 14.5%, joint-venture firms; and 17%, MNEs. Firm function is classified into one of nine categories here. Seventeen percent of the firms produce raw materials. Forty-two percent of the firms process raw materials. Thirty-six percent produce components and parts while 63% produce final goods. In addition to Table 10, a total of 19% procure raw materials while 24% carry out logistics. Only 2% of firms have information technologies departments. Twenty percent of firms have sales departments while 40% carry out marketing activities. These variables are not shown in Table 10.
The average amount of domestic sales is calculated based on the average number of local customers, that is, on average firms have 27.8 customers with a standard deviation of 25.7. There is a much larger variation in shipping across respondent firms. The average product life cycle is 2.9 years with a standard error of 2.2 years. There is also a larger variation in the length of the product life cycle. The average number of product types is 6.9 products with a standard error of 4.2. There are firms with many types of products, while there are also firms which produce a single product.
Finally, let us turn to the characteristics of top management and worker characteristics within the firm. The percentage who hold a master’s degree or higher is 28.4%. Almost 57.8% of top managers have had experience in engineer during their career. The percentage of top management personnel who have experience with multinationals or joint ventures is 45.9%. The ratio of high school graduates among blue-collar workers is 58.1%, while the ratio of technical college graduates among engineers is 50.4%.
Mean Std. Dev. R&D Activities (1 if Yes, 0 otherwise) 0.501 0.500
Age 16.796 13.922
Full-time Employees 340.198 514.347
Local Firms 0.675 0.469
Joint Venture Firms 0.145 0.352
Food 0.111 0.314 Textiles 0.053 0.225 Apparel 0.053 0.225 Wood 0.043 0.203 Paper 0.051 0.220 Chemicals 0.049 0.215 Plastics 0.080 0.271 Nonmetal 0.015 0.122 Iron 0.047 0.213 Metal 0.063 0.242 Machinery 0.063 0.242 Computers 0.023 0.150 Electronics 0.095 0.293 Precision 0.019 0.135 Autos 0.058 0.234 Transport 0.009 0.096
Production (raw material) 0.176 0.381 Production (processing) 0.427 0.495 Production (components and parts) 0.345 0.476 Production (final products) 0.589 0.492 Size of domestic sales 27.833 25.770 Years of product life cycle 2.973 2.254 Number of product types 6.962 4.234 Top management have master's degrees 0.284 0.451 Top management were engineers 0.578 0.494 Top management have experience with MNC/JV 0.459 0.499 Ratio of high school graduates among blue-collar 58.191 27.665 Ratio of technical college graduates among engineers 50.453 36.371
Indonesia 0.212 0.409
Philippines 0.235 0.424
Thailand 0.206 0.405
Hanoi 0.174 0.379
Ho Chi Minh City 0.174 0.379
Table 10: Summary Statistics of Firm Characteristics
To keep pace with domestic demand and stay on top of international competition, firms adopt new technologies, acquire new organizational forms to adapt to market changes, create new markets, find new inputs to improve product quality and cost efficiency, and introduce new products. Table 11 shows our main interest: product and process innovation. Innovative activities reflect several dimensions of industry upgrading. There are large difference among firms’ policies in industry upgrading. We drew up three different groups of measures: introduction of new goods, adoption of new technologies and facilities, and changes in organizational structures.
While approximately 64% of the sample firms, on average, are able to change the design of existing products in general, more than 80% of firms improve their own existing product. Almost 70% of firms develop a new product based on existing technologies, while 57% develop a new product based on new technologies. These figures suggest that it is more difficult to achieve product innovation in combination with new technologies. Eighty-five percent of firms succeed in selling a new product to their existing market, while 71% of firms succeed in selling a new product to a new market. These figures also imply that creation of a new market is difficult and costly.
How about process innovations? More than 83% of the firms were able to buy new machines. Seventy percent of firms were able to improve existing machines, and 71% of firms introduced new know-how in the production method. There are several types of changes in the production process, for example, quality, production, cost controls for plant operation, marketing, inventory, procurement, and delivery controls for shipping. Firms in the sample tend to change their production processes more than their shipping processes. There are also several types of changes in management practices, i.e., in the accounting system, human resource management practices (HRMP), environment management, and adoption of ISO. Changing the accounting system and HRMP within a firm is more popular than meeting with regulations and global standardization.
We collected information concerning not only changes in the production process but also concerning ten actual upgrading production processes: (1) decrease defection (72%), (2) decrease inventories (58%), (3) decrease materials (50%), (4) reduce the labour input (33%),
(5) improve quality (84%), (6) reduce lead-time (50%), (7) increase the domestic market (60%), (8) increase the market abroad (35%), (9) reduce pollution (61%) and (10) meet regulations (82%).
Mean Std. Dev. Product Innovations
(1) Change Design 0.639 0.481
(2) Improve Existing Product 0.841 0.365
(3) Develop New Product based on Existing Technologies 0.692 0.462 (4) Develop New Product based on New Technologies 0.573 0.495
(5) New Product to Existing Market 0.845 0.362
(6) New Product to New Market 0.712 0.453
Production Process Innovations
(1) Buy New Machines 0.656 0.475
(2) Improve Existing Machines 0.831 0.375
(3) Introduce New Know-how on Production Methods 0.704 0.457 Change in Production Process
(1) Change Quality Control 0.789 0.408
(2) Change Production Control 0.840 0.367
(3) Change Cost Control 0.801 0.400
(4) Change Marketing 0.745 0.436
(5) Change Inventory Control 0.699 0.459
(6) Change Domestic Procurement 0.495 0.500
(7) Change International Procurement 0.701 0.458
(8) Change Domestic Delivery 0.360 0.480
(9) Change International Delivery 0.635 0.482
Changes in Management Practices
(1) Change Accounting System 0.780 0.414
(2) Change HRMP 0.753 0.431
(3) Change Environment Management 0.671 0.470
(4) Adopt New ISO 0.503 0.500
Upgrading Production Process
(1) Decrease Defection 0.727 0.446
(2) Decrease Inventories 0.580 0.494
(3) Decrease Materials 0.506 0.500
(4) Reduce Labor Inputs 0.334 0.472
(5) Improve Quality 0.838 0.369
(6) Reduce Lead-time 0.503 0.500
(7) Increase Domestic Market 0.606 0.489
(8) Increase Market Abroad 0.350 0.477
(9) Reduce Pollution 0.612 0.488
(10) Meet Regulations 0.825 0.380
Table 11: Summary Statistics of Product and Process Innovations
D. Independent variables: Forms of guidance, transferred technology, and partner’s characteristics
Firms in the sample utilize the knowledge flows between their own firms and their production partners (their own customers and suppliers) to upgrade themselves. Therefore, it is reasonable to say that they are more likely to adapt new technology and undertake organizational practices such as worker exchanges or technology transfers in response to the external environment and its demands. What occurs inside the knowledge flows from customers? We have three dimensions of technology transfer: (1) quality control, (2) cost control and (3) delivery control. Actually, environment management is becoming important in technology transfers between customers and suppliers in East Asia, especially at exporting firms. Since only 1% of firms have practiced environment management on their main customer, we do not focus on environment management in this sample.
Firstly, let us describe the proxies of mutual knowledge flows between a firm and its customer. We assume that learning and teaching consists of mutual knowledge flows. We also assume that this is combination of knowledge flows through engineers, from customer to the firm, and knowledge flows through engineers from the firm to its customer. Thirty-seven percent of firms engage in mutual exchange of engineers between their own firm and their customer. Fifty-four percent of firms receive engineers from their main customer (i.e., customer-dispatched engineers). Forty-three percent of firms dispatch engineers to their main customer. Total quality management is one of the incentives for mutual knowledge flows between firms. Twenty-eight percent of firms are provided with quality control by their customer. The customer provides cost control for 7% of the firms. The customer provides delivery controls for 9% of the firms. Forty-seven firms provide quality controls to the customer. On the other hand, 4.6% of firms provide cost controls, and 14.6% of firms also provide delivery controls. Thirty percent of firms in the sample are granted a license by their customer. Thirty-six percent of firms grant a license to their customers. Forty-three percent of firms in the sample are required by their customers to possess ISO certification. Almost 35% of firms require customers to possess ISO certification. Fifty-five percent of firms form JIT with their customer, while the average distance to the customer is 448 km with a standard deviation of 702 km.
Mean Std. Dev. Customer dispatches engineers*Dispatches engineers to 0.372 0.483
Customer dispatches engineers 0.541 0.499
Dispatches engineers to customer 0.432 0.496
Customer provides quality control 0.278 0.448
Provides customer with quality control 0.473 0.500
Customer provides cost control 0.074 0.262
Provides customer with cost control 0.046 0.210
Customer provides delivery control 0.093 0.290
Provides customer with delivery control 0.146 0.353
Customer grants license 0.299 0.458
Grants license to customer 0.365 0.482
Customer requires ISO 0.433 0.496
Requires ISO of customer 0.348 0.477
JIT with customer 0.553 0.497
Distance to customer 448.736 702.893
Same industry as customer 0.317 0.466
Customer is local 0.600 0.490
Customer is joint-venture 0.161 0.368
Capital tie-up with customer 0.406 0.491
Years of duration with customer 6.699 3.605
Customer's production (raw material) 0.066 0.248
Customer's production (processing) 0.054 0.227
Customer's production (components and parts) 0.133 0.340
Customer's production (final products) 0.433 0.496
Relationship with Customer
Table 12a: Summary Statistics of Relationship with Customer
Secondly, the relationship with the supplier displays different figures compared to the relationship with the customer. Thirty-five percent of firms engage in mutual exchanges of engineers between their own firm and their supplier. Forty-seven percent of firms receive engineers from their main supplier (i.e., the supplier dispatches engineers). Forty-five percent of firms dispatch engineers to their main supplier. Total quality management is also one of the incentives for mutual knowledge flows between firms and their suppliers. Thirty-seven percent of firms are provided with quality control by their supplier. Thirty-five percent of firms receive quality control from their supplier. Almost 8% of firms receive cost controls from their supplier, while 6.5% of firms provide delivery controls to their suppliers. On the other hand, 18.2% of firms receive delivery controls from their suppliers, and 12.5% of firms provide delivery controls to their supplier. Thirty percent of firms in the sample are
granted a license from their supplier; twenty-eight percent of firms grant a license to their suppliers. Thirty-three percent of firms are required by their suppliers to possess ISO certification. Almost 44% of firms require their supplier to possess ISO certification. Fifty percent of firms form JIT with their supplier, while the average distance to the customer is 524 km with a standard deviation of 750 km.
Table 12b: Summary Statistics of Relationship with Supplier
Mean Std. Dev. Supplier dispatches engineers*Dispatches engineers to 0.359 0.480
Supplier dispatches engineers 0.476 0.500
Dispatches engineers to supplier 0.459 0.499
Supplier provides quality control 0.358 0.480
Provides supplier with quality control 0.332 0.471
Supplier provides cost control 0.079 0.269
Provides supplier with cost control 0.065 0.246
Supplier provides delivery control 0.182 0.386
Provides supplier with delivery control 0.125 0.331
Supplier grants license 0.314 0.464
Grants license to supplier 0.287 0.453
Supplier requires ISO 0.328 0.470
Requires ISO of supplier 0.442 0.497
JIT with supplier 0.507 0.500
Distance to supplier 524.855 750.251
Same industry as supplier 0.361 0.481
Supplier is local 0.538 0.499
Supplier is joint venture 0.193 0.395
Capital tie-up with supplier 0.389 0.488
Years of duration with supplier 6.485 3.541
Supplier's production (raw material) 0.454 0.498
Supplier's production (processing) 0.134 0.341
Supplier's production (components and parts) 0.156 0.363
Supplier's production (final products) 0.115 0.319
Relationship with Supplier
4.2 Results
I describe the empirical content of exchanges of workers and the contents of technology transfer related to innovations. To begin, we report on the internal effects of the determinant of product and process innovations in order to understand the knowledge flow through upstream-downstream production linkages. Firstly, exchanges of engineers, trainers, and
trainees can stimulate knowledge flow through face-to-face communication. Exchanges seem to be a ‘vehicle’ of knowledge flows; however, while these exchanges capture the importance of face-to-face communication, we are silent about the motivation for technology transfer. Technology transfer could require the opportunity for face-to-face communication between suppliers and customers. Since our aim in this paper is to focus on the impact of tacit knowledge exchange on product and process innovations, we relate direct information flow through upstream-downstream linkages to product and process innovations. This paper also seeks to detect the firm’s knowledge production function. We set the estimated equation as follows:
i i i i
i αExchange Engineer βManager γx u
y = )= _ + + +
Pr( 1 ,
where y means the outcome of innovation and upgrading for each firm i located in each country c, the variable Exchange_Engineer proxies the meaning of information and knowledge flows between firms (forms of guidance through exchanging engineers, trainers, and trainees and incidence of receiving technical assistance), x is other controls, i.e., R&D, age, size, capital structure, industry, function of operation, years of product life cycle, number of product types, ratio of high school workers, ratio of college graduates engineer, and country dummy variables as depicted in Table 1. A cross-sectional error term is shown by
u. To simply regress innovation outcome to covariates, we focus on the estimated coefficient of Exchange_Engineer as the degree of innovation management technology across firms.
A. Product innovations
Table 4 reports the effects of exchanges of engineers between a firm and its partners (main customers and suppliers) on the introduction of new products. The dependent variable is equal to one if each firm achieves product innovations and is zero otherwise. We have six different types of product innovations: (1) change design, (2) improvement of existing product, (3) development of new product based on existing technologies, (4) development of new product based on new technologies, (5) new product to existing market and (6) new product to new market. The independent variable, the R&D activities dummy which signifies incurred R&D expenditure and country dummy variables are also shown. The variable for
customer (supplier) dispatch engineers is equal to one if each firm accepts engineers from their main customer (supplier). The variable for dispatch engineers and trainees to customer (supplier) is equal to one if each firm dispatches engineers and trainees to their main customer (supplier). In particular, this paper focuses on the interaction terms of customer-(supplier-) dispatched engineers and dispatches of engineers to the customer (supplier) to study the role of impact of mutual knowledge exchanges. Our theoretical framework suggests that such mutual knowledge exchanges with the firms’ partners could stimulate the learning and innovation processes at each firm utilizing the production linkages. Marginal effects are presented in Table 13.
As reported in Table 13, the coefficient for R&D activities for development of a new product based on existing technologies is .156 with a standard error of .048, and it is statistically significant at the 1% level (column 3). The R&D activities dummy variable also has a large impact on new product to new market (column 6); the coefficient for R&D activities is .137 with a standard error of .066, and it is also statistically significant at the 5% level. Thus, firms that do R&D are likely to experience a significantly higher probability of product innovation than firms that do not pay R&D expenditures.
The first punch line of Table 13 is the coefficient for the interaction term between
customer dispatches engineers and dispatches engineers to customer. The coefficient for the interaction term for development of a new product based on new technologies is .230 with a standard error of .129 (column 4), and it is statistically significant at the 10% level. The coefficient for the interaction term for new product to new market is .271 with a standard error of .129 (column 6), and it is statistically significant at the 5% level. The second main result of Table 13 is the coefficient for the interaction term between supplier dispatches
engineers and dispatches engineers to supplier. The coefficient of this interaction term also shows the impact of mutual knowledge exchange with the supplier. The coefficient for the interaction term for improvement of existing product is -.154 with a standard error of .085 (column 2); it is statistically significant at the 10% level. The coefficient for the interaction term for development of a new product based on new technologies is -.267 with a standard error of .127 (column 4); it is statistically significant at the 10% level. These results suggest