Autonomy Era
権利
Copyrights 日本貿易振興機構(ジェトロ)アジア
経済研究所 / Institute of Developing
Economies, Japan External Trade Organization
(IDE-JETRO) http://www.ide.go.jp
シリーズタイトル(英
)
ASEDP
シリーズ番号
76
journal or
publication title
Regional Development Policy and Direct
Local-Head Election in Democratizing East
Indonesia
page range
153-176
year
2007
Chapter VII
Regional Fiscal Policy for the North Sulawesi Economy
under the Regional Autonomy Era
by
S. L. H. V. Joyce Lapian
1. INTRODUCTION
Since the ratification of Law No. 32/2004 on Local Government and Law No. 33/2004 on Fiscal Balance between the Central Government and the Regions, which were changed from Law No. 22/1999 and Law No. 25/1999, these regulations have made significant change in formulating the regional fiscal policy.
Fiscal decentralization is a key component of the regional autonomy program in reducing the central government’s burden in providing local social service, improving the efficiency of resources utilization, reaffirming the development planning, enhancing public participation and strengthening the unity and integrity of the nation. In the context of public service, the regional expenditure as part of fiscal policy becomes the main focus, since it has a direct affect on the improvement of service quality.
In this decentralization era, the allocation of budget from the central government to the local government is a “block grant” or its application is not specifically determined, so that the local government has a full authority in utilizing the funds. The question is “how effective is the expenditure utilized for the development of the economy in general and for the enhancement of the local people’s prosperity in particular?”
This review is derived from an analysis that illustrates and compares two cases on the formulation and application of fiscal policy in the Province of North Sulawesi. The first case is, in the era of Law No. 22/1999 and Law No. 25/1999 (an era in which the governor was elected by the local parliament [DPRD]), in which the regional fiscal policy was derived from regional vision and mission. This means that the vision and mission was formulated by the Local Government through a series of processes, further
translated into budget figures incorporated in the annual budget (APBD).
The second case is in the era of Law No. 32/2004 in which the governor is directly elected by the people, under a new mechanism in which the candidate brought forward his/her vision and mission to be offered to the people. Thus, once elected as the local-head, his/her vision and mission is applied in formulating the regional fiscal budget in the annual budget (APBD).
The difference between these two methods is in terms of their effectiveness; that is by applying the Leverage Approach on the economy growth measured by the ratio of the APBD and the Gross Regional Domestic Product (GRDP). The GRDP growth itself is influenced by the regional consumption rate, regional investment rate, local government expenditure and net local export. In brief, this analysis is explained in the following diagram: Vision/Mission of Region Direction of Economic Policy Annual Budget -Fiscal Policy -Sectoral Allocation -Impact on Demand Side -Impact on Supply Side -Intermediation Function Vision/Mission of Local-Head Direction of Economic Policy Annual Budget -Fiscal Policy -Sectoral Allocation -Impact on Demand Side -Impact on Supply Side -Intermediation Function Contribution to GRDP Effectiveness (Budget/GRDP) Election of Local-Head by Local Parliament Election of Local-Head Directly by People
Theoretically, good fiscal policy will be able to enhance the prosperity of the people through government expenditure that can stimulate investment to increase the absorption of labor force and reduce the poverty rate. It is generally believed that, the needs of the people will be better fulfilled, if the goods and services are provided by the local government itself rather than by the central government. However, this tendency is not necessarily apparent, since most of the District/Municipality Governments (executives and legislatives) in Indonesia construe the regional fiscal policy by pushing the Regional Original Revenue (PAD) through taxes and retribution. On the other hand, the local government does not balance the revenue with the spending as reflected in the expenditure of the budget. Such policy could not bring the multiplier effects for the regional economic development as well as to enhance the people’s prosperity as the fact shows that year after year, the GRDP growth tends to increase, nonetheless, the structural economic problem such as unemployment and high poverty rate are still
prevalent, even worse.
In this context, the regional fiscal condition under Law No. 22/1999 and Law No. 25/1999 as well as Law No. 32/2004 and Law No. 33/2004 should be reviewed from the aspects of regional fiscal policy, the structure of local expenditure and revenue as well as their impact towards regional economy.
The aims of this review are: (1) to observe the regional fiscal effectiveness towards the economy development of local government in the era of Law No. 22/1999 and Law No. 25/1999, as well as in the era of Law No. 32/2004 and Law No. 33/2004; (2) to analyze the structure of regional revenue by observing the differences of the Law No. 22/1999 and Law No. 25/1999, as well as under Law No. 32/2004 and Law No. 33/2004; (3) to analyze the structure of regional expenditure by observing the differences between Law No. 22/1999 and Law No. 25/1999, as well as under Law No. 32/2004 and Law No. 33/2004.
2. THE GUIDELINES FOR REGIONAL POLICY OF NORTH
SULAWESI
2.1. Era of Law No. 22/1999 and Law No. 25/1999
January 1, 2001 was the beginning of the regional autonomy based on Law No. 22/1999 and Law No. 25/1999.
For North Sulawesi, the year of 2001, was the transitional period for the implementation of regional autonomy policy. It was also a reform transformation process in for Indonesia in facing the economic and monetary crisis, which disrupted the economy. Indonesia also experienced turmoil in the processes of national development and suffered social strife, such as the loss of job opportunities, the decline in productivity in the real sectors, escalation of social issues, spiritual demoralization and the emergence of social problems as well as disintegration threats followed by horizontal conflicts. One of the impacts of the social conflicts is the refugees coming from the conflict areas, especially from North Maluku and Ambon, seeking refuge in North Sulawesi.
In addition to that, North Sulawesi was also responsible for dealing with issues such as land, forestry, and health problems (dengue fever and malaria). Although such cases began as technical and administrative problems, but eventually these cases could cause social tension. The most apparent indicator for these issues is the street demonstration by the people in public to protest the policy. In other sectors, the impact of industrial development such as mining may cause environmental problems, which may turn into health and welfare problems.
from sustainable development based on “self-reliance” principle should not rely on only natural resources, but should also build on the human resources. The power, the national and regional defense should be based on the independency and individual strength.
In penetrating the local, national or international market, the key characters to competitiveness are quality, productivity and professionalism as well as environment-friendly development.
The initial step for the Local Government and the DPRD of North Sulawesi Province to overcome the situation is the formulation of a clear concept and guideline in the form of a general vision, mission and strategy. The concept should answer the external demand (for globalization) and internal demand (for the implementation of local autonomy) as stipulated under the Regional Ordinance (Perda) of North Sulawesi Province No. 7/2000. The vision is: “To realize the North Sulawesi people in leading civilization, peace, law, justice and prosperity as well as to become a center of superiority in the Unitary State of Republic of Indonesia (NKRI)”
By introducing this vision, and through a series of processes, some of the priority programs that are doable are: (1) supremacy of law and good governance, (2) qualified education, (3) technology and environmental development, (4) agriculture, agro-industry and international trade development; (5) maritime and fishery development; and (6) tourism development.
To bring all these strategic activities into reality there is a need for a significant amount of funding support, on the other hand the Provincial Government has very limited fund resources from the PAD and has only received a reduced amount (from the Central Government) in the form of the General Allocation Fund (DAU) . Therefore, since 2003, the local government has tried to carry out these strategic activities, although they have not fully accommodated all of them. However, in line with the efforts and actions to optimize the Provincial Government resources for their regional revenue, it needs to be supported by optimizing the programs and the strategic activities for the on-going years.
2.2. Era of Law No. 32/2004 and Law No. 33/2004
Unlike the years when the Governor was elected by the provincial DPRD, in 2005 the Governor was elected directly by the people. Under this new mechanism, the new Governor brings forward his/her vision and mission that are offered to the people, thus when he is elected as governor, the Governor’s vision and mission becomes the Region’s vision and mission. The vision that was offered is: “To build a Cultural, Competitive and Prosperous North Sulawesi”.
To achieve this vision, the government policy of 2006 is directed to strategic efforts to build North Sulawesi that is cultural, competitive and prosperous by implementing various programs and activities as incorporated in the Annual Local Government
Working Plan (RKPD) in 2006, by establishing a development theme of 2006: “the social movement to return to Agricultural base”.
Furthermore, in developing a basis to formulate the government policy through discussions and review processes between the executives and the council, the North Sulawesi Province Annual Budget for the 2006 Fiscal Year was stipulated under the Provincial Ordinance No. 1/2006 dated February 27, 2007. The main focus of the ordinance is aimed for the people’s interest, sustainable development and for the smooth administration of the provincial government tasks by emphasizing the budget principles of transparency, accountability and discipline.
The effectiveness of the North Sulawesi provincial government in 2006 is reflected in an accumulation of the programs and activities as outlined in the mission, aim and target that are based on the Medium-term Regional Development Plan (RPJMD) 2005-2010, General Policy of the Budget (KUA) and the RKPD of 2006.
2.3. Comparative Analysis
The “vision statements” from the region’s vision and the governor’s vision are both based on the North Sulawesi culture and have the same ultimate goal i.e.: the prosperity of the people of North Sulawesi. The difference is how to achieve the goal. The “Region’s Vision” emphasizes on utilizing the prevailing regulations, so that the result is linear (no innovative break-through). This is different from “the Governor’s vision” that has relatively more energy in selecting innovative programs for his vision.
The background of this difference is, if the “Region’s Vision” is brought forward by the people’s representatives (from political parties) through political deals. Therefore, the vision is more “political”. Meanwhile the “Governor’s Vision” was offered to fulfill the candidate’s promise to the people who elected him. In this case, the governor has a moral responsibility to completely fulfill his promise, so that the programs are oriented towards micro and specific programs that directly cater the people real needs.
In the period of Law No. 22/1999 and Law No. 25/1999 which were reviewed through the APBD 2003 achievements, the Local Government focused on programs that strengthened the local autonomy implementation, although the government also allocated attention to other programs. This is understandable at that time the local autonomy was a relatively new issue, for it just had been in operation for two years.
The implementation of Law No. 32/2004 and Law No. 33/2004, which was also assessed through the results from the APBD 2006, was one step forward to enter the globalization era, particularly in strengthening the local competition to be able to participate in the global market, by emphasizing, for example, the importance of efficiency principles and human capital development.
3. REGIONAL ECONOMY ANALYSIS
3.1. Economic Development in North Sulawesi 2003-2006
The economy development in North Sulawesi during 2003-2006 was sufficiently moderate, although not satisfactory. This condition was mainly affected by the central government’s policy to raise the fuel prices some time ago which struck the national economy including the North Sulawesi economy. In addition to that, the local government’s effort to improve the business climate to increase the investment rate has not given a clear result. The economy growth rate in North Sulawesi during the period 2003-2006 reached figures respectively 5.2%, 5.7%, 4.7% and 5.9% with an average growth of 5.3%.
Table 1. Actual GRDP Growth in North Sulawesi
2003 2004 2005 2006 Average 2003-2006 GRDP GROWTH RATE (%) 5.19 5.69 4.66 5.87 5.30 Expenditure Side: (%) 1. Consumption 0.99 2.71 5.62 7.86 3.80 2. Investment -3.72 6.74 13.11 11.21 6.84 4. Export 19.17 13.19 13.14 18.59 15.86 5. Import -2.64 9.60 13.41 23.35 11.39 Sectoral Growth: (%) 1. Agriculture 5.14 4.85 4.08 6.58 4.85
2. Mining & Exploration -4.60 -1.05 5.60 6.80 0.21 3. Manufacturing Industry 7.00 6.95 4.28 5.18 6.16 4. Electricity, Gas & Water Supply 2.44 2.39 2.68 5.37 2.85
5. Construction 7.44 6.08 4.10 6.60 5.65
6. Trade, Hotel & Restaurant 7.15 8.17 5.95 8.64 7.50 7. Transportation & Communication 6.94 9.22 6.60 6.05 8.28 8. Finance & Real Estate Services 5.24 5.78 5.31 5.51 5.30
9. Services 2.90 2.58 2.42 3.15 2.58
Source: Bank Indonesia Manado and BPS of North Sulawesi (converted)
The dominant drive of the economy growth is consumption that contributed as much as 49.6% of the total budget. This high consumption was affected by the religious celebrations namely Christmas and New Year’s day. In addition to these circumstances, the local government and other institutions tend to use up the budget when approaching the end of the budget year, inducing government expenditures to increase. The consumption activity consists of private consumption that is generally considered as the locomotive of the economy growth in North Sulawesi.
5.3%. The reason for this is the increase of the financial condition as noted by Consumers’ Expectation Survey of the Manado City for the period of March 2006. Besides that, the election campaign for the District-Head and Vice District-Head for Bolaang Mongondow District slightly affected the consumption activity in terms of food and other goods. Meanwhile, in general, the government expenditure has not much affected the economy growth rate of North Sulawesi since it has merely contributed a figure of 0.3% from the total consumption.
As for investment, their contribution to the total budget is as much as 17.6% with a growth rate of 6.8%. The investment spending was based on the prevailing prices in the period of 2003-2006 that continuously increased. Physical investment in North Sulawesi Province was worth Rp 1,747 billion in 2003 and increased to Rp 1,985 billion in 2004. For 2003-2006, the total amount of physical investment was worth Rp 3,133 billion. Bank Indonesia in cooperation with the Faculty of Economics of Sam Ratulangi University, Manado conducted a research and shows that low investment rate in North Sulawesi was due to the following factors: (1) the practice of bribery in some institutions to obtain licenses; (2) the lengthy bureaucracy in processing the license; (3) the uncertainty of the law for investors; (4) the high rate of labor wage; (5) the high price of land controlled by the brokers/officials making it difficult to obtain sufficient land for agriculture and plantation; (7) the inadequate support from the Chamber of Commerce and Industry (Kadin) as the media between the investor and banking.
To curb the red tape in the local level as well as to promote efficiency and effectiveness in acquiring the Foreign Investment (PMA) license, the authority of Regional Cooperation and Coordinating Investment Board (BKPMKR) was revoked. To obtain investment license, investors would have to apply through the Central Coordinating Investment Board (BKPM) as stipulated under the BKPM Decree No. 57 dated July 20, 2004.
However, this does not necessarily mean that the local authority has no role in foreign investment. They may recommend proposals to BKPM to issue licenses for the foreign investors interested in investing in their region. The recommendation may consist of technical issues such as the environmental aspects, as in the case of waste management (industrial cesspool), so that BKPMKR should coordinate with other concerned parties. Apart from foreign investment licensing, Decree No. 57 also administered the RPTKA (Foreign Expert Plan) license from the local government to the Central Government. It is expected that the Decree will encourage investors to come and invest in Indonesia, especially in North Sulawesi.
As for the contribution for export, the goods and services contributed a mere 4.5% from total budget although the growth rate was one of the highest. In terms of trade balance in the provincial level, the inflow of goods to North Sulawesi Province is higher than the outflow of goods. This is due to the fact that most of the people’s needs are imported from Java Island via Makassar.
In the meantime, the performance of foreign investment in North Sulawesi in general was encouraging. This is supported by the relatively stable exchange rate of the US dollar against the Indonesian Rupiah, although there is a tendency of increasing production costs as a consequence of the increasing world oil prices and the limited energy resources in North Sulawesi, especially electricity. Another factor is the declining quantity of main commodities from agriculture (coconut, copra and clove). Up to November 2006, the export volume of North Sulawesi was USD 269.5 million (with sales up to 606.5 thousand tons) or 64.5% compared to last year’s volume. The high rate of North Sulawesi export was driven by the main commodity group, namely animal or vegetable fats and oils, including virgin coconut oil (VCO), fisheries products (fish, crustacean, moluccus); and other meat products, fish, lobsters etc. Hence, in summary, the export activity in North Sulawesi Province concentrates on the natural resources or in the form of raw materials. Accordingly, the provincial government of North Sulawesi should support the development of processing industry, so that export commodities are not only in the form of raw materials, but also in the form of partially-finished products or finished product. This will increase the value of the products (give value added) and will create many new jobs. Commodities from North Sulawesi are exported to China, United States of America and Holland.
In contrast, until November 2006, the export growth was balanced by non-oil imports that amounted to USD 24.6 millions (with a volume of 7.6 thousand tons) - meaning that the imports have significantly increased compared to the same period of last year which was USD 4.8 millions. On one hand, the import statistics shows that North Sulawesi is dependent on goods/service from other countries, however by identifying further the imported commodities, it may be concluded that most of the imported products are capital goods needed for the investment..
Analyzing the composition of the North Sulawesi imports, the composition in 2006 is relatively different from the previous year. In 2006 imports were dominated by capital goods (machine, tools/equipment, transportation etc), while in the previous year, the imported goods were more dominated by food groups such as sugar and sugar confectionery product. The change in import composition in terms of machinery, equipment and materials indicated the growing investment activities in North Sulawesi. This is also indicated by the improved contribution of investment.
The sectoral economy growth of GRDP of North Sulawesi Province mainly is supported by three main sectors, namely (1) the agriculture sector which share is about 24.9% with a growth rate of 4.9% (2) transportation and communication sector with a share of 18.6% and a growth rate of 8.3% and (3) hotel and restaurant industry with a share of 14.8% and a growth rate of 7.5%.
During 2003-2006, the agriculture sector contributed an average rate of 4.9%, but the share was the largest towards the total GRDP. The successful crash program, launched in 2005, stimulated good impact to local economy. Furthermore, from 2006
onwards the government implemented the Agriculture Revitalization upon completing the grand design of agriculture revitalization. The crash program was only limited to corn, VCO and seaweed commodity, however, the agriculture revitalization included other commodities. As harvest time came along, the production of some agriculture products also increased.
The transportation and communication sector were able to contribute to the total GRDP budget as much as 18.6% with the highest average of growth rate 8.3%, although there was a hike in oil prices that especially affected the transportation sub sector.
Next is the trade, hotel and restaurant sector which was the third largest contributor to the budget producing 14.8% with an average growth rate of 7.5%. This is reflected in the increase of retail real index. Another factor is the significant financing support from the banking sector.
Up to 2006, prices in Manado as still high, although slightly lower than a year before. Inflation pressure was caused by the increase in the food group especially commodities such as rice, fish, sugar, fruit and vegetables. The rise in the price of rice and sugar was mostly caused by the disrupted distribution line due to the natural disasters and also affected by the distributor’s speculation on the polemic on import commodities. Meanwhile, the increase of prices of fish, fruits and vegetables was caused by seasonal factors (rainy/storm season) and disasters (floods and landslides) in some cities and districts in North Sulawesi.
3.2. Main Economic Phenomenon in North Sulawesi
North Sulawesi economy was considered as quite good, although it has not been able to address the main economy problem, that is, poverty and unemployment. The existing economic condition and structure has not provided sufficient support to achieve a high rate of economy growth. The business climate was not yet conducive, and transaction costs were still high, in spite of some improvement. The constrained investment and limited production activities implicated to the real sector that has not been able to progress as quickly as before the economy crisis struck this province. Subsequently, the structure and performance of industry and agriculture became weak. The job market was not flexible and the quality and capacity of the available human resources are limited. Although various development instruments and infrastructure have been improved in 2005, but it is still far from sufficient.
Since 2005, the economy reform in many fields has been implemented, but it is still not adequate. The reform programs need to activate this sector quickly and pursue further their targets and must be prepared to face high competition.
Apart from that, there were some other issues such as bribery, bureaucracy in business licensing, and the shortage of electricity power and fuel. These issues have negatively affected the attractiveness of investment. Investment has improved although
not as high as expected and the export competition tends to be weak.
The effort to drive exports has not been optimal, since the incentive and facility programs are not sufficient, especially for small and medium scale exporters. The role of the micro, small and medium scale enterprises (UMKM) in providing job opportunities has not been matched with the quality of the UMKMs.
Up to the end of 2006, the unemployment rate was still very high, while the welfare was low. A low rate of economy growth cannot fully create job opportunities, particularly in creating job opportunities in the formal sector in which every year the work force grows. Furthermore, another important manpower problem is that the informal sector still offers ample job opportunities, but does not necessarily provide programs to improve the worker’s welfare. Other issues in terms of Indonesian manpower are the industrial relationship between employer and employee in the effort of creating good relationship, the limited job opportunities in North Sulawesi, and in contrast there are many overseas job opportunities.
In the meantime, the province needs to face the many challenges in finding the solutions to the problems. On one side, North Sulawesi economy has begun to spin, however the level of education, the skills and the capability of the manpower are still very low, but on the other side, the demand for skilled manpower with expertise and competence has increased since the globalization era. Next, there is a need for change in the pattern of industrial relationship among the government, employer and the employee to create harmonious relationship.
Many people in North Sulawesi were still concerned and felt uncertain about their future and their welfare. The number of people categorized under the poverty line and the number of people on the border of poverty were still high. In addressing these poverty issues and in fulfilling the basic needs of the poor people, the challenges and problems are, specifically; (1) low awareness of people’s basic rights (basic infrastructure); (2) inadequate understanding of the basis/root of the poverty; (3) lack of understanding of the different conditions in many regions; (4) insufficient availability of data to accurately determine the target and the target group; (5) inadequate attention given to the poor in terms of planning and budgeting; (6) the lack of coordination between central government and local government to in alleviate poverty; (7)lack of coordination among the actors of development; (8) low involvement of the civil society; and (9) weak in monitoring, evaluation and controlling system.
The poverty issue in North Sulawesi is also parallel with the uneven distribution of inter-regional development. Most of the poor people live in the villages/agriculture areas and along the coastline including in the Sangihe and Talaud District. In the effort to minimize the gap among the regions, there are still some problems and constraints such as: (1) some strategic and fast growing regions have been developed; (2) the regions in the border areas are still backward/left behind; (3) the gaps between villages and towns in terms of development; (4) inadequate use of the spatial planning as a
guideline in coordinating regional and sector development; and (5) land management system is not optimum.
These issues were often raised as the campaign theme in the governor’s election, either elected by the DPRD as well as elected directly by the people. Ironically, after being elected, the governor rarely uses such program that was promised during the campaign as a parameter of his achievement.
4. REGIONAL FISCAL ANALYSIS
4.1. North Sulawesi Financial Management in 2003-2006
The legal basis for local financial management including the regional revenue management is mainly based on the government general policy, namely:
a. Law No. 17/2003 on State Finance. b. Law No. 1/2004 on State Treasury.
c. Law No. 25/2004 on National Development Planning System. d. Law No. 32/2004 on Local Government.
e. Law No. 33/2004 on Fiscal Balance between Central Government and Regions.
f. Ordinance No. 25/2000 on Government Authority and Provincial Authority as Autonomous Region.
g. Decree of Minister of Home Affairs No. 29/2002 on the Management and Responsibility of Local Government Finance.
h. Law No. 34/2000 on Revision of Law No. 18/1997 on Local Tax and Retribution;
i. Ordinance No. 65/2001 on Local Taxes; j. Ordinance No. 66/2001 on Local Retribution;
k. Regulation of Minister of Home Affairs No. 16/2005 on Basic Calculation for Imposing Vehicle Taxes and Fees for Vehicle Ownership Conversion
The above regulations provided the local government a direction to explore revenue resources optimally in order to ensure the balancing of local government expenditure.
In line with the need for funding to implement decentralization, and the handing over of the authority through local autonomy, under Law No. 32/2004 (paragraph 157) the government general policy has established that the financial resources of regional revenue are as follows:
a. Regional Original Revenue, hereinafter referred as PAD are: 1. Local Taxes.
2. Local Retributions.
3. Separated Local Asset Management. 4. Other legal PADs.
b. Balanced Budget (Revenue-Sharing of Taxes/Non-Taxes, and the General Allocation Funds (DAU), and
c. Other legal Regional Revenue
During the last five years, the regional revenue management has changed many times to accommodate the directives from the Central Government.
Since the stipulation of Law No. 34/2000 regarding the Revision of Law No. 18/1997 on Local Taxes and Retribution, the provincial government of North Sulawesi has restructured the basis for regional revenue by revising some regional regulations and then issued new ordinances. The revised or new ordinance was drafted in 2001, and was issued in the beginning of 2002. Thus, the socialization and stipulation of the law started in 2002.
During the past five years of policy changes, there has been progress in the regional revenue in North Sulawesi. The development of the regional revenue has been influenced by the following factors: a) Government Policy, b) the Public Revenue, c) Fluctuation of Main Commodity Prices, d) Monetary Policy, and e) Business. For the next five years the contribution of regional revenue, especially from Regional Original Revenue as well as from the Balanced Funds (Revenue Sharing of Tax and Non-Tax) is determined by the potential of the revenue from the region.
Table 2. Expenditure and Revenue in APBD of North Sulawesi (2003-2006)
(Rp) Year Local Revenue Balanced Budget APBD Contr. of
Loc. Rev. Contr. of. Balanced Budget 2003 119,691,243,270 271,567,836,626 391,259,079,896 30.59% 69.41% 2004 147,109,977,668 266,375,086,925 413,485,064,593 35.58% 64.42% 2005 193,245,869,101 286,105,257,244 479,351,126,345 37.66% 62.34% 2006 211,236,498,158 442,355,947,717 653,592,445,875 32.96% 67.03%
Source: APBD 2003-2006 (converted).
Apart from the abovementioned factors, the secure and safe condition of the province also contributed to the growth of local revenue. In terms of Regional Revenue towards the Regional Expenditure, the revenue management has been well managed to support government management, development programs and to improve the people’s welfare in North Sulawesi. The contribution of PAD and Balanced Budget towards provincial APBD for the period of 2003-2006 is reflected in Table 2.
Based on the data, in general, the revenue has improved every year, however there are some types of PAD which have not been able to reach the optimum level, such as the local taxes and local retribution. There have been some constraints in managing the potential regional revenue. The balancing compensation funds, especially from Revenue Sharing of Tax and Non Tax have not been able to contribute favorably to the local (regional) revenue since there is lack of accurate data which leads to tentative budgeting for the local government.
The regional revenue and expenditure budget has undergone fundamental changes, particularly with the revision of the various laws, which regulate the local financial management. In terms of annual regional financial management of the North Sulawesi Province, the regional revenue has increased on average around 23.3% per year, while the expenditure has fluctuated and decreased in 2003 and 2004. However, if it is compared with the fiscal basic year, there is a 10.3% and 6.7% increase in 2003 and 2004 respectively. In terms of salary expenses, there have been changes in expenditures subject to the change of the number of employees transferred in or out to/from the Districts/Municipalities as well as from the central government.
Table 3. Realization of Expenditure/Revenue in ARBD of North Sulawesi (2003-2006)
(Rp. 000)
Local Revenue Expenditure
Balanced Budget Year
PAD
BEIP/BP DAU
Total
Revenue Salary Non Salary
Total Expenditure 2003 115,504,099 22,433,940 249,030,000 386,968,039 106,754,532 315,501,094 422,255,626 2004 137,719,789 23,062,280 242,067,000 402,849,069 119,751,249 301,975,139 421,726,388 2005 172,804,470 27,276,627 258,828,630 458,909,727 108,058,400 365,467,853 473,526,253 2006 211,236,498 38,031,948 404,324,000 653,592,446 181,987,297 467,770,875 649,758,172
Source: APBD 2003-2006 (converted).
The continued programs and activities from year to year have been improved or have been adjusted to focus on development programs for North Sulawesi. The programs and activities according to the sectors are detailed as follows:
1. The government administration sector receives an average allocation of 65% from the regional expenditure; this expense emphasizes on the duties and responsibilities of the government apparatus in executing governmental administration principles by enhancing the services of civil servants.
2. The cooperatives sector is directed to handle fees from the UKM institutions, as well as to promote cooperatives as a public economy institution.
3. The labor sector is directed to continue the programs on expanding employment opportunities and enhancing productivity as well as re-enforcing labor law. Another sector, which influences the regional expenditure disbursement, is the Public Works sector. This sector is directed to develop the infrastructure and facilities
for the underdeveloped areas, the regional borders and maintain the function of roads and bridges to improve the accessibility of economy growth, open the isolated areas and support the water supply management such as rivers, lakes, beaches and irrigation. Other sectors that are prioritized in the development programs are the health sector, which is directed to improve the health facilities and to address epidemic diseases, and the education sector, which is directed to improve the quality of education and education infrastructure. The allocation of expenditures is seen in Table 4.
Table 4. Sectoral Allocation of Expenditures in the APBD of North Sulawesi (2003-2006)
(Rp)
No SECTORS 2003 2004 2005
1 Public Administration 275,199,398,610 286,762,789,849 324,994,093,159 2 Agriculture and Animal Husbandry 9,805,234 000 11,446,604,000 14,199,200,607 3 Fishery and Maritime 4,390,671,000 4,094,731,000 3,843,669,031 4 Mining and Energy 3,520,416,000 3,226,399,000 3,128,852,354 5 Forestry and Plantation 9,470,686,000 10,411,616,000 9,412,152,542 6 Industry & Commerce 3,948,014,000 3,657,648,000 3,673,241,168 7 Cooperatives 2,953,009,000 2,633,566,000 2,970,405,253 8 Investment 1,946,776,000 1,425,434,000 1,572,339,191 9 Labor 7,,038,371,000 6,800,644,000 6,032,521,843 10 Health 21,772,280,000 20,940,372,500 22,923,862,898 11 Education and Culture 22,811,445,000 22,496,636,000 15,369,522,220 12 Social 3,492,397,000 3,254,978,000 3,191,510,145 13 Public Works 43,018,464,000 29,981,837,000 47,436,787,113 14 Transportation and Communication 5,343,682,000 5,241,190,000 5,716,993,114 15 Environment 2,031,584,000 1,564,892,000 1,623,646,181 16 Tourism 5,131,991,000 7,787,051,000 7,437,456,620 TOTAL 442,255,626,000 421,726,388,349 473,526,253,439
Source: APBD 2003-2006 (converted)
The regional expenditure allocation for 2003-2005, among others are government apparatus spending (non-salary) that amounted to 38.5%. This allocation is particularly for spending on personnel payment, goods and services, duty trips, maintenance and investment on capital goods for procurement and building physical facilities that add to the regional assets and provide economic benefits for more than one year. For public service expenditure, 65.2% of the budget is allocated to finance the activities which directly give benefit and affect the community.
effect under the Decree of the Minister of Home Affairs on Regional Financial Management, Responsibility as well as the Regional Budget Evaluation Procedures, Financial Calculation. Under this new system, the difference between the Revenue and Expenditure (surplus/deficit) will be compensated from the income financing and the expense financing.
This fiscal year, the difference is Rp 35.3 billion which was covered by the Regional Income Financing from the previous year’s Budget Surplus which amounted to Rp 65.5 billion and from the Expense Financing for Due Payments of Principle Debt amounting Rp 30.2 billion.
In 2003, the revenue in North Sulawesi reached Rp 396.2 billion, increasing 25.7% compared to position of the year before which was Rp 315.2 billion. This rise was derived from the PAD that increased 27.1% from Rp 97.3 billion to Rp123.7 billion. This contributed 31.2% towards Total Regional Revenue. Another source is from the Balanced Funds that increased 47.0% from Rp. 217.9 billion to Rp. 271.6 billion with a contribution of 68.6% towards total regional revenue.
Up to the end of 2003, the PAD reached 107.1% from the targeted Rp 115.5 billion, with the local tax revenue as the main contributor amounting to Rp 101.8 billion or 82.3% of the PAD. Furthermore, there are other sources of PAD which amounted to Rp. 10.8 billion (8.7%), local retribution reaching Rp 7.3 billion (5.8%) and regional business profit amounting to Rp. 4.6 billion (3.8%).
The realization of the regional balanced budget reached 100.1% of the targeted budget of Rp 271.6 billion. Based on the components of the budget, the General Allocation Fund (DAU) totaling Rp 242.3 billion, is the main contributor or 89.2% of the total balance budget. Other contributors are funds from the Revenue Sharing of Tax and Non-Tax amounting Rp 22.6 billion (8.3%) and from the Special Allocation Fund (DAK) amounting to Rp 6.7 billion (2.5%).
Until the end of 2003, the expenditures of the Local Government of North Sulawesi Province reached Rp 389.0 billion. This figure represents 92.1% of the expenditure budget of Rp 422.3 billion as planned in the beginning of the year. Based on the components, this local expenditure includes expenses for the apparatus spending, public service, profit sharing and contingencies expenses.
The Local Apparatus spending reached Rp 210.9 billion contributing 54.2% of total expenditure. These expenses included General Administration Rp 153.0 billion, Operation and Maintenance Rp 51.5 billion and Capital spending Rp 6.4 billion. Meanwhile Public Expenditure reached Rp 178.1 billion, contributing 45.8% of total local expenditures. This spending consisted of General Administration Rp 6.3 billion, Operation and Maintenance Rp 42.7 billion and Capital spending Rp 49.4 billion. The expense from shared profits and financial aid reached Rp 75.9 billion that contributed 19.52% of total expenditure. The contingencies component reached Rp 3.8 billion with a contribution of 1.0% of total expenditures.
In 2004, the North Sulawesi Province conducted a direct governor’s elections that was held smoothly, safely and peacefully. This shows that the people of North Sulawesi were mature in democracy, and had strong expectation towards enhanced welfare and improved standard of living, including the quality of the development in many sectors.
The 2004 Fiscal Year is reflected by some important and strategic programs, both routine activities and extraordinary ones. The activities that have absorbed a significant part of the APBD budget among others are: in April 2004 the province conducted legislative elections; conducted a Farmers and Fishermen Forum Workshop in June 2004; held the first round of the Presidential and Vice Presidential Elections in July 2004; the province actively participated in the National Sports Championship in Palembang which succeeded in gaining the most medals ever since they participated in the events; (this success should make North Sulawesi Province proud and uphold this championship); the province conducted the second round of the Presidential and Vice Presidential elections in September 2004.
In implementing the APBD of the Fiscal Year of 2004, the government applied a performance-based planning and budgeting system, although it was still influenced by the former financial management system that had been used for more than two decades. The system is arranged as follows: the Local Revenue in the 2004 APBD was targeted at Rp 402.8 billion and the realization is Rp 413.5 billion or 102.7% with the composition: PAD amounting to Rp 140.8 billion; the Balanced Budget amounting to Rp 244.9 billion (consisting of BHP/BHBP: Rp 24.3 billion and the DAU reaching Rp 220.6 billion); other legitimate revenues amounting Rp 21.4 billion.
Local Expenditure consists of Local Apparatus Expense which is Rp 233.4 billion and the realization is Rp 226.8 billion or 97.2%, Public Service expense Rp 188.3 billion and the realization is Rp 180.6 billion or 95.9%.
From the financing side, the local revenue component is Rp.29.2 billion and the realization is Rp 23.0 billion or 78.7%; local expenditure component is Rp10.8 billion and the realization is Rp 9.8 billion or 90.6%.
For the 2005 fiscal year, the total Local Expenditure amounted to Rp 473.5 billion which consisted of Public Apparatus spending Rp 241.2 billion and Public Service expense Rp 232.4 billion. The budget for this fiscal year was allocated to hold the governor and vice governor elections, the inauguration of the Governor and Vice governor, the Bunaken Festival and the North Sulawesi Expo. Additionally, the ratio between the local Apparatus expense and Public Service expense (not including the civil servant salaries) is 36.42% against 63.6%, which means that the Public Service expense is 27.2% more than the apparatus expense. This year the Local Financing came from the financing of the Local Revenue amounting to Rp31.2 billion and the financing of Local Expenditure amounting to Rp 16.6 billion. As a result, there was a Rp 14.6 billion difference, which can be allocated to cover the deficit of the Local Expenditure of the 2005 Fiscal Year.
For the 2006 Fiscal Year, the local revenue is based on the resource potential of North Sulawesi Province, by exploiting and utilizing the local revenue potential to strengthen the economy and to implement the local autonomy, as well as to improve the public service quality as a priority. The breakthrough to increase revenues is achieved through the intensification and extensification of local resources.
The financial performance of North Sulawesi in 2006, especially at the provincial level was sufficiently high, both from the revenue or from the expenditure side. This relatively high achievement of revenue, either from PAD (local tax and retribution) or from the balanced budget shows that the overall province’s financial condition has improved. In the meantime, the high expenditure was parallel to the high revenue and was in line with the local government’s consistency and discipline in undertaking the development projects as planned. This was considered as positive, since nowadays the people of North Sulawesi province can take benefit from the impact of the developments, especially the development of public service and infrastructures.
The province’s dependency on the central balanced funds, such as from the revenue sharing of taxes and non-taxes, the DAK and the DAU is still very high. This is indicated by the low fiscal ratio in the APBD 2006. Up to December 31, 2006, the ratio between the PAD and Total Regional Expenditure is merely 31.2%.
In the beginning of 2006, the revenue budget of the APBD was Rp 653.4 billion, which consists of local revenue and income financing components. This means there is a 30.7% increase compared to the figures of 2005. Likewise, the expenditure budget is equaled to the revenue budget, that is, Rp 653.4 billion which includes local expenses and expenditure financing components, meaning an increase of 27.6% compared to last year’s figures.
Up to December 31, 2006, the local income was Rp 683.5 billion or exceeding the target with a ratio of 104.6%. The largest revenue came from central and local balanced budget and followed by PAD and other income. The central and local balanced budget reached Rp 443.9 billion or 102.5% from the target at the beginning of the fiscal year which was about Rp. 433.3 billion.
In terms of the budget components, the central and local balanced budget was mainly supported by the DAU and followed by the income from the revenue sharing of taxes and non-taxes. The PAD was able to reach a high level of Rp 213.0 billion or 115.5% of the target which was Rp 184.4 billion. From that total amount, the revenue particularly came from regional taxes, and then followed by the profit from locally-owned companies, other income and retribution.
The local expenditure in the province was Rp 656.7 billion or 100.5 % (exceeding the target), which consisted of the expenses for Local Apparatus, Public Service and other routine expenses (profit sharing expenses, financial aid, contingencies, capital and debt payments). Encouragingly, up to the third quarter of 2006 the expense disbursement was rather sluggish, only 31.7% from the budget, however, in the last
quarter of 2006 the expenditure reached 98.0% out of the planned budget.
The expenses for investment, as a non-routine component, is allocated for the government project developments. Therefore, the implementation of these projects must go through rigid administration process, starting from the pre-bidding process, selection process and finally, procurement of the goods/services. If the ratification of the APBD budget is delayed then the implementation of capital spending will also be delayed. However, the spending for salaries, office expense and maintenance that were mostly used to pay for the government staff should not be postponed nor delayed.
4.2. Fiscal Policy Phenomenon in North Sulawesi
In terms of revenue structure, the fiscal policy to increase the local revenue during 2003-2006 was a success; the average achievement was more than 100% or exceeding the target. On the other hand, in managing the local expense, the government has managed to “cut back” on spending (become more efficient) since the expenditure was less than 100% of the budget.
The fiscal policy that was formulated especially to push the local income to increase PAD through various ordinances has disappointed some people especially business people that consider the ordinances will only push higher costs. The higher costs will reduce the competitiveness of the local companies, particularly in attracting investment in North Sulawesi Province.
Apart from that, the increase of local revenue from year to year does not necessarily improve the quality of public services provided by the government. This can be observed from the lack of infrastructure in which there are still many broken-down roads, and insufficient water supply. These issues are correlated to the efficiency principle, which is in fact, not effective. In terms of public financial management, indeed the efficiency principle should be upheld, but the effectiveness should also be considered. The fact of “economizing” the budget should not sacrifice better public service.
5. IMPACT OF FISCAL POLICY TOWARDS THE ECONOMY
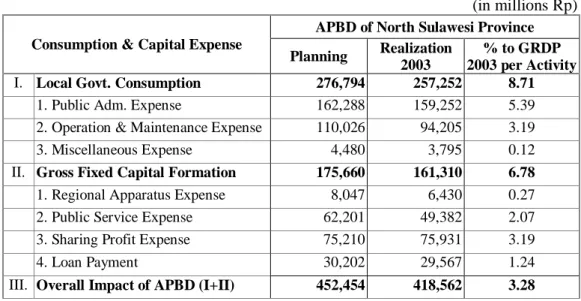
5.1. APBD 2003 Contribution towards Real Sectors and Money CirculationThe APBD in North Sulawesi Province, especially the disbursement of the local expenditure of 2003, in general, has fairly contributed to the economic growth in North Sulawesi. By categorizing the elements of APBD 2003 into two main activities (Table 5), there are two aspects: Government Consumption and Investment. The results show that the disbursement of expenditure has contributed a share of 8.7% to the value added
government spending in GRDP. While for investment, the share is 6.8%. Overall, the APBD expenditure has contributed 3.3% to GRDP.
Table 5. The Contribution of APBD of North Sulawesi (*) towards Real Sector
(in millions Rp)
APBD of North Sulawesi Province Consumption & Capital Expense
Planning Realization 2003
% to GRDP 2003 per Activity I. Local Govt. Consumption 276,794 257,252 8.71
1. Public Adm. Expense 162,288 159,252 5.39 2. Operation & Maintenance Expense 110,026 94,205 3.19 3. Miscellaneous Expense 4,480 3,795 0.12 II. Gross Fixed Capital Formation 175,660 161,310 6.78 1. Regional Apparatus Expense 8,047 6,430 0.27 2. Public Service Expense 62,201 49,382 2.07 3. Sharing Profit Expense 75,210 75,931 3.19
4. Loan Payment 30,202 29,567 1.24
III. Overall Impact of APBD (I+II) 452,454 418,562 3.28 Remarks: (*) GRDP Valid Prices in North Sulawesi Province 2003
Source: North Sulawesi Regional Financial Report 2003 - Bank Indonesia)
In terms of money circulation in the North Sulawesi Province at the end of 2003, the APBD has affected the contraction of money as much as Rp. 42.9 billion, which means that the income is higher than expenditure. See Table 6.
Table 6. The Impact of APBD in North Sulawesi towards the Money Circulation
(in millions Rp)
Incoming Contribution APBD Realization 2003
% to Total GRDP 2003
I. RUPIAH INCOME 452,457 461,486 3.62
a. Regional Original Revenue 115,504 124,522 0.97
1 Tax 88,428 101.798 0.80
2 Retribution 10,201 7.269 0.05
3 Profit of State Owned Companies 4,644 4.644 0.03
4 Others 12,230 10.811 0.08
b. Balanced Budget 271,463 271,628 2.13
1 Shared Taxes & Non-Taxes 22,433 22.600 0.18 2 General Purpose Allocated Funds 242,330 242.328 1.90 3 Specially Allocated Funds 6,700 6.700 0.05 Previous Year’s Balance (Remainder
of Last Year Budget ) 65,490 65,336 0.51 Realization
Expenditure APBD
Q4-2003
% to Total GRDP
II. RUPIAH EXPENDITURE 452,457 418,562 3.28
a. Consumption 276,794 257.252 2.02
1 Public Adm, Expense 162,288 159.252 1.25 2 Operation & Maintain. Expense 110,026 94.205 0.74
3 Miscellaneous 4,480 3.795 0.03
b. Capital 145,458 131.743 1.03
1 Capital Expense 70,248 55.812 0.44
2 Spending from Shared Taxes and
Financial Aid 75,210 75.931 0.60
Due Debt Payment 30,202 29,567 0.23
III. Expansive (+) or Contractive (-) - (-) 42,924 Source: North Sulawesi Regional Financial Report 2003 - Bank Indonesia.
5.2. APBD 2004 Contribution towards Real Sectors and Money Circulation
APBD 2004, particularly the local expense disbursement, has somewhat contributed to the economic growth in North Sulawesi. By categorizing the elements of the APBD 2004 into two main activities, based on the GRDP tables, (from the demand side) there are two aspects: Government Consumption and Investment. The results show that government expenditure has contributed a share of 12.50 % to the value added government spending in the GRDP. While for investment, the share is 0.43%. Overall, APBD 2004 expenditure has contributed 7.24 % to the total GRDP.
Table 7. Fiscal Stimulation of North Sulawesi towards Real Sector (Rp. billion) Realization Description Revised APBD 2004 Nominal % to GRDP A I. Government Consumption 416.67 414.49 12.50 1. Public Adm. Expense 173.06 164.38 4.96 2. Operation & Maintain. Expense 149.25 133.69 4.03 3. Other Routine Expense 94.36 116.42 3.51
B II. Investment 15.39 10.95 0.43
Capital Expense 15.39 10.95 0.43
C Total I + II 432.06 425.44 7.24
Source: North Sulawesi Regional Financial Report 2003 - Bank Indonesia (converted).
The impact of North Sulawesi APBD towards money circulation at the end of 2004 reached a net balance (total expenditure was equal to the total revenue), meaning there was no expansion in the fiscal policy.
5.3. APBD 2005 Contribution towards Real Sectors and Money Circulation
To some extent, APBD 2005 of North Sulawesi, particularly the local expense disbursement, has contributed to the economic growth in North Sulawesi. By categorizing the elements of APBD 2005 into two main activities, based on the GRDP tables, (from the demand side), there are two aspects of Government Consumption and Gross Fixed Capital Formation. The results show that government consumption has contributed a share of 2.7% to the value added government spending in GRDP. While for Gross Fixed Capital Formation, the share is 0.1%. Overall, the 2005 APBD expenditure has contributed 2.8% to the total GRDP.
The impact of North Sulawesi APBD towards money circulation in September 2005 resulted in a net balance, which means that total expenditure was equal to the total revenue, therefore, there was no significant impact on money circulation.
5.4. APBD 2006 Contribution towards Real Sectors and Money Circulation
In APBD 2006, the government consumption has contributed a share of 2.9 % to the value added government spending in the GRDP. While for Gross Fixed Capital Formation, the share is 0.3%. Overall, APBD 2006 expenditure has contributed 3.1% to the total GRDP.
In combining these components, by adding the financial data from the districts, cities and provincial levels, the shared contribution adds 18.2% towards GRDP (based on the prevailing prices).
Table 8.Fiscal Stimulus of APBD of North Sulawesi toward Real Sector
Nominal % to PDRB*
a. Government Consumption 590,35 594,88 2.85
1. Public Adm. Expense 259,53 256,24 1.23
2. O & M Expense 165,99 156,91 0.75
3. Other Routine Expence 164,82 181,73 0.87
b. The Establishment of Fixed Capital 63,02 61,77 0.30
Capital Expense 63,02 61,77 0.30 c. Total a.+b. 653,36 656,65 3.14 Realization APBD 2006 Description
Source: Financial Bureau of North Sulawesi Province. *) GRDP Q1 s/d Q4 year 2006 (Valid Prices)
The impact of APBD 2006 towards money circulation up to the end of the fiscal year was significant. This means that the total revenue was higher than total expenditure.
Table 9. The Impact of the APBD towards Money Circulation
(billion Rp)
Nominal % Realization % to GRDP
a. Rupiah Income 653.36 683.53 104.62 3.27
Regional Original Revenue (PAD) 184.39 212.97 115.50 1.02
1. Local Tax 149.43 167.04 111.78 0.80 2. Retribution 9.96 7.18 72.11 0.03 3. Shared profit of Locally-Owned Coy. 16.50 24.91 150.94 0.12 4. Others 8.50 13.85 162.89 0.07
Balanced Budget 433.30 443.92 102.45 2.13
1. Revenue Sharing 28.98 39.60 136.65 0.19 2. General Allocation Fund (DAU) 404.32 404.32 100.00 1.94 3. Specially Allocation Fund (DAK) 0.00 0.00 - 0.00
Other Income 35.67 26.63 74.67 0.13
b. Gross Fixed Capital 653.36 656.65 100.50 3.14
Consumption 590.35 594.88 100.77 2.85
1. Public Administration Expense 259.53 256.24 98.73 1.23 2. Oprtn & Maintn Expense 165.99 156.91 94.52 0.75 3.Other Routine Expense 164.82 181.73 110.26 0.87
Capital 63.02 61.77 98.02 0.30
Capital Expense 63.02 61.77 98.02 0.30
c. Rupiah Impact (GRDP
Prevailing Prices) 0.00 26.88 0.00 0.13
Description APBD 2006
Realization of APBD North Sulawesi 03 Jan - 31 Dec 2006
Source: Financial Bureau of North Sulawesi Province. *) GRDP Q1 s/d Q4 year 2006 (Valid Prices).
5.5. Leverage Capacity Analysis
The overall contribution of APBD 2003 was 3.3% of the total GRDP. This means that the government’s financial capability in stimulating the local economy activities was only 3.3%. This is regarded as too small. Likewise, the expense and capital spending for APBD 2006 contributed only 3.1% to the GRDP. The reason for this phenomenon is that the North Sulawesi Province mainly depended on the balanced budget provided by the central government. This is indicated by the ratio of the 2006 self-supporting fiscal plan. Based on APBD 2006, the self-supporting fiscal or the ratio of the PAD towards total expenditures is 31.2%, Thus, this can be concluded that most of the economic and social activities are financed from the central balanced budget as revenue sharing of taxes and non taxes, DAU and other revenues that amounted to 68.8%.
Whether or not the Governor is elected by the legislative or directly by the people, apparently the governor’s role has not significantly contributed to the regional economic development. This can be proven from the leverage capacity of APBD 2003 which was 3.3% and meanwhile in 2006, the leverage capacity became even lower, showing merely a ratio of 3.1%. This indicates that the business players in North Sulawesi have not been able to take advantage of the various service facilities provided by the government to stimulate the regional economy. Apparently, the government programs to stimulate the local economy have not been effective.
6. CONCLUDING REMARKS
The effectiveness of the Regional Fiscal policy for the regional economic development in the era of Law No. 22/1999 and Law No.25/1999 was slightly better than in the era of Law No.32/2004 and Law No. 33/2004, as reflected from the Leverage Capacity of 3.3% and 3.1% respectively.
The structure of local revenue under Law No. 22/1999 and Law No.25/1999 or under Law No.32/2004 and Law No. 33/2004 still depended on the balanced budget from the central government. In other words, the fiscal policies in the period of both eras have not been able to improve the fiscal autonomy.
The structure of local expenditure under Law No. 22/1999 and Law No.25/1999 or under Law No. 32/2004 and Law No. 33/2004 was “restrained” by the efficiency principles (which naturally means to cut back on spending), but has overlooked the effectiveness principles.
It is recommended to develop fiscal policies that can stimulate real investment to empower the local resources, such as providing special incentives for the investors interested in developing the agriculture potentials into agricultural industry.
induces high cost economy. If Local Retribution becomes the main source, it should be justified with a purpose, instead of having no basis. For example, in fulfilling the K3 (Healthy and Safe Work Environment) requirement, an operator must install fire extinguishers; but ironically the government imposes retribution for this type of procurement. This is absurd. Retribution should only be applied, if an operator utilizes government facilities or assets.
In managing local expenditures, rather than applying the principles of “reducing costs or cutting down costs”, the government should apply the principles of effectiveness and efficiency. Effectiveness and efficiency are integrated and should not be separated. The performance of one government is not commendable if the public service is poor even though the government spending is below 100%.
REFERENCE
Central Bureau of Statistics (BPS) North Sulawesi [2004] The 2003 North Sulawesi Province Regional Gross Domestic Product.
--- [2005] The 2004 North Sulawesi Province Regional Gross Domestic Product. --- [2006] The 2005 North Sulawesi Province Regional Gross Domestic Product. --- [2007] The 2006 North Sulawesi Province Regional Gross Domestic Product.
Bank Indonesia (BI) Manado [2004] The 2003 Financial Report of North Sulawesi. --- [2007] The 2006 Financial Report of North Sulawesi.
North Sulawesi Province [2003] The 2003 Revenue and Expenditure Budget of North Sulawesi.
--- [2004] The 2004 Regional Revenue and Expenditure Budget of North Sulawesi. --- [2005] The 2005 Regional Revenue and Expenditure Budget of North Sulawesi. --- [2006] The 2006 Regional Revenue and Expenditure Budget of North Sulawesi. --- [2006] The 2005-2010 Regional Medium-Term Development Plan (RPJMD) --- [2006] General Policies on Budgeting (KUA) and the 2006 Local government