Impacts of FTA utilization on firm performance
著者
Hayakawa Kazunobu
権利
Copyrights 日本貿易振興機構(ジェトロ)アジア
経済研究所 / Institute of Developing
Economies, Japan External Trade Organization
(IDE-JETRO) http://www.ide.go.jp
journal or
publication title
IDE Discussion Paper
volume
366
year
2012-08-01
INSTITUTE OF DEVELOPING ECONOMIES
IDE Discussion Papers are preliminary materials circulated to stimulate discussions and critical comments
Keywords: FTA; microdata; propensity score matching JEL classification: F15; F53; O53
#Kazunobu Hayakawa, Bangkok Research Center, Japan External Trade Organization
§ This research was conducted as part of a project of the Japan External Trade Organization
“Cause and Consequence of Firms’ FTA Utilization in Asia”. I am grateful to the Japan External Trade Organization for providing me with the micro data used in this study. I would like to thank Toshiyuki Matsuura, Toshihiro Okubo, Tadashi Ito, Nipon Poapongsakorn, and Wisam Pupphavesa for their valuable comments. The opinions expressed in this paper are those of the author and do not represent the views of any of the institutions with which I am affiliated.
Abstract
The international export and investment activities of firms have been widely studied by scholars. In particular, prior studies have focused on two main hypotheses about firms engaged in international activities such as exporting and investing abroad; namely, self-selection of more productive firms into international activities and learning-by-doing international activities. This paper is the first study that explores these hypotheses in regard to firms’ use of free trade agreements (FTAs). We first estimate the propensity score for firms’ use of FTA schemes, and find that larger firms are more likely to participate. Then, by conducting matching analysis using the propensity scores, we find that the use of FTA schemes does not change employment in firms, but does result in more local inputs used and increased exports.
IDE DISCUSSION PAPER No. 366
Impacts of FTA Utilization
on Firm Performance
Kazunobu HAYAKAWA
#§The Institute of Developing Economies (IDE) is a semigovernmental, nonpartisan, nonprofit research institute, founded in 1958. The Institute merged with the Japan External Trade Organization (JETRO) on July 1, 1998. The Institute conducts basic and comprehensive studies on economic and related affairs in all developing countries and regions, including Asia, the Middle East, Africa, Latin America, Oceania, and Eastern Europe.
The views expressed in this publication are those of the author(s). Publication does not imply endorsement by the Institute of Developing Economies of any of the views expressed within.
INSTITUTE OF DEVELOPING ECONOMIES (IDE), JETRO 3-2-2, WAKABA,MIHAMA-KU,CHIBA-SHI
CHIBA 261-8545, JAPAN
©2012 by Institute of Developing Economies, JETRO
No part of this publication may be reproduced without the prior permission of the IDE-JETRO.
1
Impacts of FTA Utilization on Firm Performance
Kazunobu HAYAKAWA#§
Bangkok Research Center, Japan External Trade Organization, Thailand
Abstract: The international export and investment activities of firms have been widely studied by
scholars. In particular, prior studies have focused on two main hypotheses about firms engaged in international activities such as exporting and investing abroad; namely, self-selection of more productive firms into international activities and learning-by-doing international activities. This paper is the first study that explores these hypotheses in regard to firms’ use of free trade agreements (FTAs). We first estimate the propensity score for firms’ use of FTA schemes, and find that larger firms are more likely to participate. Then, by conducting matching analysis using the propensity scores, we find that the use of FTA schemes does not change employment in firms, but does result in more local inputs used and increased exports.
Keywords: FTA; microdata; propensity score matching JEL Classification: F15; F53; O53
#
Author. Kazunobu Hayakawa, Bangkok Research Center, Japan External Trade Organization, 16th Floor, Nantawan Building, 161 Rajadamri Road, Pathumwan, Bangkok 10330, Thailand. Tel: 66-2-253-6441; Fax: 66-2-254-1447. E-mail: [email protected].
§
This research was conducted as part of a project of the Japan External Trade Organization “Cause and Consequence of Firms’ FTA Utilization in Asia”. I am grateful to the Japan External Trade Organization for providing me with the micro data used in this study. I would like to thank Toshiyuki Matsuura, Toshihiro Okubo, Tadashi Ito, Nipon Poapongsakorn, and Wisarn Pupphavesa for their valuable comments. The opinions expressed in this paper are those of the author and do not represent the views of any of the institutions with which I am affiliated.
2
1. Introduction
Free trade agreements (FTAs) have been one of the most prominent issues in the world economy. The increase in the number of FTAs has continued unabated since the early 1990s. As of January 2012, the World Trade Organization (WTO) has been notified of about 500 regional trade agreements, including both agreements on goods and services. FTAs are considered to be one of the most effective policy tools for enhancing trade volume between member countries. Particularly, in recent years when multilateral trade liberalization through WTO has slowed, bilateral trade liberalization through FTAs has played a central role in increasing world trade. Because of this shift, identifying and quantifying the economic effects of FTAs have become even more important.
Many scholars have analyzed the economic effects of FTAs at the country and industry levels. In ex-ante evaluations, a computable general equilibrium (CGE) model simulation is the most widely used method for estimating the economic effects of FTAs when assessing the economic impacts of potential FTAs. In particular, many studies based on CGE models use variations of the Global Trade Analysis Project (GTAP) model.1 Examples of this approach include Brown et al. (1995), Cox (1995), Sobarzo (1995), and the studies surveyed in Baldwin and Venables (1995). On the other hand, ex-post evaluations often focus on quantifying the trade creation effects of FTAs. Such effects have been quantified by applying the industry/product-level trade data to the well-known gravity equation, which includes mostly FTA dummy variables taking unity if trading countries belong to the same FTA and zero otherwise (e.g., Baier and Bergstrand, 2007; Caporale et al., 2009; Medvedev, 2010; Vicard, 2009). In particular, these recent studies have identified significant trade creation effects from FTAs. The results obtained from these ex-ante and ex-post studies have been useful in clarifying how the economic impacts of FTAs are predicted and what effects on the economy have been achieved, respectively.
In contrast with these previous studies, this paper is the first to examine the effects of FTAs at the firm level. Rather than relying on aggregated data, we use firm-level data that provides information on the use of FTA schemes by firms, as well as information on their trade status with the partner country (i.e., exporting or not). With this unique data, we investigate empirically how firms’ performance changes before and after their utilization of FTAs. In other words, we examine the firm-level impacts of FTA utilization. In this paper, such impacts can be referred to as the “learning effects” of
1
3
FTA use. The results of our firm-level analysis will contribute to uncovering the impacts of FTAs at a very detailed level. In particular, in contrast to the above-mentioned studies that use aggregated data, such firm-level results provide invaluable information for firms that are now considering using an FTA, that can be useful for estimating how their performance is likely to change if they start making use of FTA schemes.
FTA utilization is expected to affect firms’ performance in several ways. The use of FTAs reduces the market price of firms’ products in importing countries (FTA partner countries). Such reductions increase demand for their products and, if the price elasticity of demand is greater than unity, the imports of their products. As a result, firms increase their exports to the partner country after using FTA schemes. Logically, the increase in exports will lead to an increase in employment as additional workers are needed to produce the additional products.2 On the other hand, the use of FTA schemes may force firms to change their patterns of procurement so as to meet the rules of origin (ROOs). Particularly in the case of real value-added content criteria, exporting firms may raise the share of local inputs as a percentage of total inputs. In this paper, although our primary interest lies in the impacts of FTA use on firms’ employment, we also examine the impacts on exports and the procurement of local inputs.
Our unique dataset has been collected by the Japan External Trade Organization (JETRO), which has conducted an ongoing survey of Japanese affiliates operating in Asia since 1987. The survey initially targeted only manufacturing companies, but in light of the growth of the service sector, non-manufacturing companies were included beginning in 2007 (the 21st survey). The survey, named the “Survey of Japanese-Affiliated Firms in ASEAN, India, and Oceania,” has included questions on the affiliates’ use of FTA schemes in recent years. Particularly in the last three years, the survey has asked about the availability of FTAs to firms and their utilization. For example, the survey now asks whether affiliates currently make use of any existing bilateral/multilateral FTAs for import or export activities. In addition, the survey also collects basic information on affiliates’ activities, such as the breakdown of their export destinations and procurement sources. Therefore, this survey enables us to explore firms’ characteristics, including the scale of their international activities. Further, by using the detailed information on firm characteristics, we can examine firms’ choices about FTA
2
Also, such expansion of outputs will raise firms’ productivity by contributing to economies of scale. The analysis on the impacts of FTA use on firms’ productivity is obviously one of the most important aspects to analyze when looking at firm-level impacts of FTAs. However, we do not examine this since our dataset does not allow us to calculate productivity measures, as explained later.
4
use with greater sophistication. For example, it is possible to restrict the sample to firms that are actually exporting to FTA partner countries. Such detailed and sophisticated analyses will help enhance our understanding of the mechanics of firms’ FTA use.
The difficulty in this kind of analysis lies in the fact that firms’ FTA utilization is not random. Introducing firm heterogeneity as in Melitz (2003), Demidova and Krishna (2008) theoretically demonstrate that there is a “selection effect” in FTA use, where productive firms use FTA schemes in their export operations and less productive firms use general tariff rates because they cannot afford to pay the fixed costs of using FTAs. Because of the existence of selection effects, a simple comparison of firms using and not using FTAs cannot identify whether better performance of FTA users originates as a result of their better ex-ante performance or as a consequence of using an FTA scheme. In short, when investigating these issues there are serious issues of causality between firms’ FTA utilization and their performance.
To overcome the issues of causality, this paper employs propensity score matching. In the context of this paper, the goal of this method is to estimate the probability of FTA use for each firm conditional on a number of observable factors. Then, by matching each of the firms actually using FTA schemes with one or more non-using firms with a sufficiently close probability of FTA use, we can compare the performance indicators between those two types of firms. The economic application of matching estimators has grown in various fields in recent years; some examples include evaluations of the effects of policy interventions in the labor market (Heckman et al., 1997; Blundell and Costa Dias, 2002), the effects of exports and FDI on corporate performance (De Loecker, 2007; Navaretti and Castellani, 2004), the effects of the WTO on trade (Chang and Lee, 2011), the effects of government and quasi-government support on firms’ exporting activities (Marincus and Carballo, 2008), and the effects of environmental regulation on the birth ratio of plants at the county level (List et al., 2003). The propensity score matching method has become one of the most useful methods for analyzing the impact of an intervention, along with the traditional instrumental variable method.
The main contributions of this paper are twofold. First, our estimation of propensity score can be seen as an analysis of the selection effects of FTA use. Although many studies have analyzed the selection effects of firms’ international activities (Bernard and Jensen, 1999 for exporting; Castellani, Serti, and Tomasi, 2010 for importing; Chen and Moore, 2010 and Kimura and Kiyota, 2006 for FDI), no one has conducted a careful econometric analysis on international activities and FTA use. Specifically, we use panel data, which enable us to isolate the selection effects of FTA
5
use by examining the relationship between firms’ use of FTAs and their past characteristics, rather than their concurrent characteristics. Second, no previous studies have analyzed the firm-level impacts of FTA use. Again, many scholars have examined the learning effects of firms’ international activities (De Loecker, 2007 for exporting; Vogel and Wagner, 2010 for importing; Castellani, Mariotti, and Piscitello, 2008, Hijzen, Jean, and Mayer, 2011 and Navaretti, Castellani, and Disdier, 2010 for FDI; Hijzen, Inui, and Todo, 2010 for outsourcing). In short, our paper is the first study to investigate empirically both the selection effects and impacts of FTA use.3
The rest of this paper is organized as follows. The next section explains our empirical method for analyzing the impacts of FTA use on firm performance. In Section 3, our data sources and certain data issues are discussed. After presenting the empirical results in Section 4, we conclude this paper in Section 5.
2. Empirical Methodology
As mentioned in the introductory section, causality issues exist when examining firms’ FTA utilization and their performance. Namely, firms with better performance are more likely to use FTA schemes in their export activities. Therefore, a simple comparison of the performance of FTA users with that of non-users is inappropriate when investigating the impacts of FTA use on firms’ performance. To control for such possible selection bias, this paper adopts matching techniques, specifically the propensity score matching method employed by Rosenbaum and Rubin (1983). As is well known, this method has the advantage of not imposing the assumption of linearity in the relationship between covariates, in this case, between FTA utilization and firm performance. Also, although this matching method is valid under the assumption that the selection mechanics can be explained by observable factors, the theoretical model by Demidova and Krishna (2008) provides further guidance as to which variables should be included to account for such selection mechanics.
Our empirical procedures are as follows. The goal of this paper is to evaluate the causal effect of FTA use on firm performance (yft). In particular, our main focus is on
the effect on firm employment. One key issue in our analysis is that FTA utilization follows the nature of the bilateral relationship. That is, we need to assure that the user firms to be examined are exporting from their location to FTA partner countries under
3
For further information on selection and learning effects in firms’ international activities, please see Hayakawa et al. (2011).
6
FTA rates. At the same time, the non-user firms to be compared should be firms that are exporting from that same country to the partner country, but who are not using FTA schemes. Therefore, we determine whether or not a firm uses an FTA scheme in exporting from its country to the FTA partner country. Specifically, our indicator variable for FTA use is FTAfijtÎ{0, 1}, which takes the value of one if firm f uses an FTA scheme in exporting from country i to country j in year t, or zero otherwise.
The average effect of FTA use on the performance of user firms, that is, the average treatment effect on the treated (ATT), is defined as
ATT ≡ E (y1
ft – y0ft | FTAfijt = 1) = E (y1ft | FTAfijt = 1) – E (y0ft | FTAfijt = 1),
where y1ft and y0ft are the performance of firm f in year t for cases with and without the
use of an FTA scheme, respectively.4
As is well known, we cannot observe the last term, namely, the performance that FTA users would on average have experienced if they had not used an FTA scheme. We can obtain a consistent estimator of the ATT by replacing the last term with the observable performance of non-users, namely, E (y0ft | FTAfijt = 0),
only if the bracketed terms in the following equation are equal to zero: ATT = E (y1ft | FTAfijt = 1) – E (y0ft | FTAfijt = 0)
+ {E (y0ft | FTAfijt = 0) – E (y0ft | FTAfijt = 1)}.
Otherwise, the estimates suffer from sample selection bias.
The solution advocated by Rosenbaum and Rubin (1983) is to find a vector of observable variables Xfijt that affects both the performance indicator yft and the treatment
variable FTAfijt such that:
{ y1ft, y0ft }^FTAfijt | Xfijt, 0 < P(FTAhijt = 1|Xhijt) < 1,
where ^ represents mathematical independence, and P(FTAfijt = 1|Xfijt) denotes the
predicted probability conditional on Xfijt, that is, the propensity score of using an FTA
scheme. In other words, Xfijt is assumed to capture all the inherent differences in
performance between the treated group (FTA users) and the control group (non-users). This assumption is called the conditional independence assumption (CIA). The latter assumption is called the common support condition in order to ensure some randomness that guarantees that firms with identical characteristics can be observed in both FTA users and non-users. By using such a vector Xfijt, if the FTA users and non-users have
the same propensity score of using FTAs, the difference in performance of those firms represents the impact of FTA utilization.
We first estimate the propensity score of using FTA schemes for both FTA user f and non-user g in exporting from country i to country j in year t as follows:
4
For the analysis of the impacts on exports, these terms are expressed as y1fijt and y
0
7
Probhijt = P(FTAhijt = 1|Xhijt), h = f, g.
To estimate the propensity score of our binary treatment, the use of probit estimation technique is a natural choice. However, the probit model should be well specified so as to assure the validity of the underlying identifying assumption of CIA and the common support condition. We follow the theoretical model of firms’ decision on FTA use provided by Demidova and Krishna (2008). This model will be useful in understanding the role of certain key elements in firms’ decision on FTA use in exporting. We focus on exporters’ decisions to use FTA schemes because importing firms using FTA schemes need only to submit certificates of origin prepared by exporting firms to customs. In other words, importers always prefer the use of FTAs if their exporters decide to make use of FTA schemes. Thus, in order to highlight the economically meaningful decision making, we consider exporters’ decisions on FTA use.
The mechanics of firms’ FTA use in exporting can be simply summarized as follows. The use of FTA schemes in exporting depends on its benefit and cost. The benefit is how much firms can save in tariff payments by using FTA preferential rates. Therefore, two elements are crucial in exporters' decision making. The first element is the difference between FTA rates and the general rates. If firms choose to use an FTA scheme, then they can export their products with the FTA preferential tariff rates. Otherwise, they must pay the general tariff rates, which are typically most-favored-nation (MFN) rates. Therefore, a larger difference between FTA rates and MFN rates results in greater amounts of savings in tariff payment. In other words, the larger the tariff margin (difference between preferential and general tariff rates), the more likely firms are to use FTA schemes. The other element for firms to consider is the size of export transactions, as larger export volumes result in greater saving on tariff payments, even if the tariff margin is trivial. Thus, lower wages in the exporting country, greater demand in the importing country, and higher productivity of firms increase the benefit of FTA use by changing the size of exports.
On the other hand, FTA utilization results in “procurement adjustment costs.” To use an FTA scheme, firms must meet the ROO requirements for their product. Complying with the ROOs may force firms to change procurement sources and raise their procurement costs since the original sources can be considered as optimal.5 Thus, the unit production cost in the case of FTA is equal to or higher than that in the case of general rates. The difference in unit production costs will depend on how restrictive the
5
However, the inputs from FTA member countries may become cheaper from importing under preferential tariff rates, rather than the general tariff rates.
8
ROOs are for firms. In other words, the less restrictive the ROOs, the more likely the firms are to use FTA schemes in exporting. In addition, for the use of FTA rates, firms incur a certain level of fixed costs. As mentioned above, fixed costs for FTA use are trivial for importers. On the other hand, in order to secure ROOs, exporters must collect several kinds of documents including a list of inputs, production flow chart, production instructions, invoices for each input, contract documents, and so on. Based on these documents, exporters certify the origin of their products to the authorities. This work incurs non-negligible costs for exporters. Obviously, lower fixed costs for FTA use encourage firms to use FTA schemes.
We take these elements into account when specifying our probit model. After obtaining the propensity scores of using FTA schemes, for FTA user f exporting from country i to country j in year t with propensity score Pfijt, the non-user g in year t with
propensity score Pgijt is selected as an appropriate counterfactual. In this paper, we first
employ the one-to-one nearest neighbor matching method as the matching algorithm. In this method,6
the non-user g is selected such that
|Pfijt – Pgijt| = min {Pfijt – Pkijt}, where kÎ{l| FTAlijt = 0}.
Following Martincus and Carballo (2008), we perform this matching method with replacement, imposing a common support by dropping the observations of the treated group whose propensity score is higher than the maximum or lower than the minimum propensity score of the control group. Also, the caliper is set as 0.04. Then, for checking the robustness of the results, the radius matching method and the kernel matching method are employed.
Last, we assess the impact of FTA use by examining the differences in performance between the treated and control groups. In the case of the one-to-one nearest neighbor matching method, the ATT estimator is given by
[
]
å
Î -= I f ft gt ATT y y n 0 1 1 a ,where I is a set of investing firms within a common support and n is the number of those firms. If factors that are not accounted for by X affect the firm’s decision to invest abroad, as well as its performance, the above ATT estimator loses its consistency. To control for the remaining selection bias that results from unobservable temporary time-invariant factors such as common macro effects, we combine the matching method with a difference-in-difference (DID) approach along the lines of Heckman et al. (1998). Our DID-matching estimator compares changes in the performance of firm i in the year
6
9
before and the year of FTA use with those of the corresponding firm j as follows:
[
]
å
Î - - - - -= I i it it jt jt DID y y y y n ( ) ( ) 1 0 1 , 0 , 1 1 , 1 , a .The validity of the estimation of the propensity score and the matching based on the estimated propensity score are also statistically tested. If the FTA user is matched in an appropriate manner with the non-user(s), the distribution of X must be almost the same for the treated and control groups. This condition is known as the balancing property:
FTAfijt^Xfijt| P(FTAhijt = 1|Xhijt),
meaning that, for a given propensity score, the FTA users and non-users should be on average identical. We use three alternative tests in order to check whether the balancing property is satisfied: the t-test for equality of means in the matched sample, the pseudo R-squared test, and the likelihood ratio test on the joint significance of all regressors in the probit model (see, for example, Caliendo and Kopeinig, 2008).
3. Data Issues
This section first introduces our main data source from the JETRO survey. Then, we specify the variables to be used in our analysis, in addition to discussing some empirical issues. Lastly, we provide a brief overview of firms’ FTA use.
3.1. The JETRO Survey
The source of data used in this paper is the JETRO survey, “Survey of Japanese-Affiliated Firms in ASEAN, India, and Oceania.” This survey has been conducted since 1987 and provides data on Japanese affiliates in those regions. In this paper, we use the survey data for the period 2008-2010. In each year in this period, questionnaires were sent to around 5,000 Japanese affiliates operating in those regions, and more than 2,000 valid responses were received. JETRO is a quasi-governmental organization and survey participation is not mandatory. Nevertheless, the survey has a sufficiently high response rate of more than 40%. In 2009, for example, 1,109 respondent firms were from Japanese affiliates in the manufacturing industry. Of these, 915 were from ASEAN-7 countries (Thailand, Malaysia, Singapore, Indonesia, the Philippines, Vietnam, and Myanmar), around 128 from South Asia (India, Bangladesh, Pakistan, and Sri Lanka), and around 66 from Oceania (Australia and New Zealand).
Our use of foreign manufacturers’ data (i.e., data on Japanese overseas affiliates) enables us to examine firms’ decisions on FTA use more precisely. One crucial reason
10
for not using FTA schemes is firms’ lack of knowledge on what FTAs are. Firms without such knowledge do not use FTA schemes simply because they just do not know how the FTA use can be beneficial for them. In such cases, firms’ decisions on FTA use obviously are not the result of a systematic process as formalized in Demidova and Krishna (2008). On the other hand, firms that invest abroad will have sufficient knowledge on FTAs because such firms are familiar with international activities and are aware of the available tools associated with such activities. In short, since foreign manufacturers are more likely to behave rationally in their decisions on FTA use, analysis using their data will yield more precise estimates on the selection effects of FTA use.
In this paper, in order to ensure sufficient responses in each country for all sample years, exporting countries are restricted to ASEAN-7 countries. By restricting exporting countries to ASEAN countries, heterogeneity of FTA availability across exporting countries is limited to some extent, though Singapore is somewhat of an exception. Further, given that the exporting countries in the sample are ASEAN countries, a sufficient number of observations can be obtained for importing countries that have concluded multilateral FTAs with ASEAN countries, i.e., China, India, Japan, and Korea, in addition to ASEAN countries themselves. As a result, in our empirical analysis, while exporting countries are restricted to ASEAN-7 countries, importing countries are limited to China, India, Japan, Korea, and all ASEAN countries.
The JETRO survey successfully captures information on Japanese affiliates in ASEAN countries. According to the “Basic Survey of Japanese Business Structure and Activities” by the Ministry of Economy, Trade and Industry (METI), there were around 2,000 Japanese manufacturing affiliates in ASEAN-7 countries in 2009, meaning that the JETRO survey captured more than half of the Japanese affiliates in ASEAN-7 counties covered by the METI data. However, compared with the METI data, the JETRO survey includes detailed information on affiliates’ use of FTAs in exporting and importing to partner countries, as well as basic firm information, such as the breakdown of their export destinations and their procurement sources. Furthermore, affiliates included in the JETRO survey are not qualitatively different from those included in the METI data. For example, the two groups of affiliates in ASEAN-4 countries (Thailand, Malaysia, Indonesia, and the Philippines) in 2009 have almost the same mean values of employment (669 for the JETRO and 601 for the METI) and the share of exports in total sales (45% for the JETRO and 48% for the METI). In sum, the sample affiliates in our dataset can be taken as the representative, and the detailed information on FTA use by firms is available.
11
As a result, FTAs between country pairs in our sample are as follows. The ASEAN Free Trade Area (AFTA) is an agreement that eliminates import duties on all products placed in the normal track in the original ASEAN member countries (Brunei, Indonesia, Malaysia, the Philippines, Singapore, and Thailand). AFTA eliminated the import duties on 80% of the products in the inclusion list until the end of 2008. As of 2010, the number of items for which tariffs are eliminated accounts for 99% of the total tariff lines. The new member countries (Cambodia, Laos, Myanmar, and Vietnam) will also eliminate tariffs in the normal track by 2015. The other FTAs are as follows. Japan has bilateral FTAs with Singapore (entry into force in 2002), Malaysia (2006), the Philippines (2008), Thailand (2007), Indonesia (2008), and Vietnam (2009), in addition to a multilateral FTA with ASEAN, which is known as the Agreement on Comprehensive Economic Partnership among Japan and Member States of the Association of Southeast Asian Nations. In the multilateral FTA between China and ASEAN, the tariff reduction for products placed in the early-harvest and the normal track started in 2004 and 2005, respectively. China also has a bilateral FTA with Singapore, which entered into force in 2009. Korea has a similar pattern of FTAs in Southeast Asia. While Korea’s multilateral FTA with ASEAN entered into force in 2007, its bilateral FTA with Singapore became effective in 2006. India also has a bilateral FTA with Singapore (2006) and a multilateral FTA with ASEAN (2010). In addition, under the India-Thailand FTA, the tariff reduction on early-harvest products was completed in 2006.
3.2. Variables
In our analysis of the impacts of FTA use on firm performance (outcome), our main interest lies in the impact on employment. Data on affiliates’ employment can be obtained from the JETRO survey. Later, we also examine the impacts of FTA use on the share of local inputs as a percentage of total inputs and the share of bilateral exports as a percentage of total sales. These data are also available in the JETRO survey. However, in the cases of exports to India and Korea, we only know whether or not an affiliate exported to these counties. The information on the share of exports to India and Korea, which would be necessary to examine the impacts on the share of bilateral exports, is not available. Thus, to examine such impacts, importing countries are restricted to ASEAN counties, China, and Japan.
The variables in the first stage estimation of our probit model are as follows. The dependent variable, namely the binary treatment variable, is each affiliate’s FTA utilization in exporting from the location country to its respective FTA partner country.
12
This information can be drawn from the JETRO survey according to available FTAs. As mentioned in the previous section, the independent variables in our probit model are based on the theoretical demonstration by Demidova and Krishna (2008). Given the existence of fixed costs for FTA use, the important factors affecting FTA use are affiliates’ productivity, primary factor prices in exporting countries, demand in importing countries, the tariff margin, and the restrictiveness of ROOs. Below, we explain our proxy variables for these elements.
Our dataset does not allow us to calculate any standard productivity measures such as total factor productivity (TFP) or labor productivity. Instead, we use affiliates’ employment as a proxy for their productivity. From an empirical point of view, productivity, as measured by TFP, usually has a positive correlation with total employment (see, for example, Fukao and Kwon, 2006). Moreover, we control for the intensity of labor inputs in each affiliate’s products by introducing a variable for the share of material cost as a percentage of total cost. Given these facts, the employment variable can be seen as a reasonable proxy for productivity. The data on affiliates’ employment and material share are again obtained from the JETRO survey. As a result, we expect that larger affiliates are likely to use FTA schemes in their exporting.
A variable of tariff margin is constructed at the (time-variant country pair-) industry-level. The tariff margin is defined as the difference between FTA tariff rates and the general tariff rates, including MFN rates or least-developing-country rates. To determine tariff rates, we accessed the raw data from the Trade Analysis and Information System (TRAINS) using the World Integrated Trade Solution (WITS) software. For each trading pair, we aggregate tariff margin at the tariff-line level into the single tariff margin for each industry by taking a simple average. As introduced above, there are some country pairs in which two FTAs apply. For example, most of the non-ASEAN importing countries in the sample have not only multilateral FTAs with ASEAN countries but also bilateral FTAs with Singapore. In this case, if preferential tariff rates are different between the two types of FTAs, we use the lower FTA rate for calculating the tariff margin. As a result, we expect that affiliates in industries with larger tariff margins are more likely to use FTA schemes in their exporting.
We account for the other elements by including several kinds of dummy variables in the model. The factor prices in exporting countries and the fixed costs for FTA use are controlled for by introducing exporting country dummy variables (as mentioned in the previous section, a significant part of fixed costs for FTA use is incurred by exporters). The inclusion of importing country dummy variables controls for the level of demand in importing countries. In addition, by restricting the sample of importing
13
countries only to those countries having multilateral FTAs with ASEAN, we are able to control for the effects of ROOs by means of importing country dummy variables to some extent because ROOs are common between the members in each multilateral FTA (i.e., ROOs for country pairs in our sample differ by importing country, as well as by industry).7 The inclusion of industry dummy variables will control for the differences in all of these elements across industries.8 We also include year dummy variables. In order to assure a sufficient number of observations in each dummy category, we do not introduce interaction terms using these dummy variables. Last, we also control for certain basic characteristics of affiliates. For example, the variable Local Input represents the share of local inputs as a percentage of total inputs, and the variable Firm Sales is an indicator variable taking unity if affiliates’ main customers are other firms (as opposed to consumers), and zero otherwise.
In regard to the model, three key points should be mentioned. First, in this analysis, we need to restrict the sample of affiliates so that we are able to differentiate selection effects from the causal impacts of FTA use. To do that, we focus only on affiliates that are actually exporting to the FTA partner country because non-exporting affiliates cannot use FTA schemes and do not make a decision on FTA utilization. Also, in order to avoid the inclusion of such impacts of FTA use in the regressors in the probit estimation, we restrict the sample of FTA users to only include affiliates that have just started the use of FTA schemes. That is, FTA users in our sample are firms that did not use FTA schemes in the previous year, but did in the concurrent year. Furthermore, we use one-year lagged independent variables (with the exception of the variable for tariff margin). Thus, we examine what kinds of ex-ante characteristics affect the start of use of FTA schemes by affiliates.
Second, we treat all ASEAN countries as a single country for importing because we can identify only whether or not affiliates are engaged in exporting activities according to FTAs. For example, even though an affiliate in Thailand uses the AFTA rates when exporting to Malaysia, in the JETRO survey we can only identify whether
7
However, if firms use bilateral FTAs instead of multilateral FTAs, ROOs differ by country pairs. Also, it is worth noting that we do not introduce a quantitative measure of the restrictiveness on ROOs. Such a measure is proposed, for example, by Estevadeordal (2000) and Estevadeordal and Suominen (2004). In our sample, there are a large number of FTA schemes, and two FTA schemes exist in several country pairs. Thus, calculating such a measure for all country pairs in the sample would not only be time-consuming, but also technically difficult.
8
Obviously, there is significant variation by industry. For example, fixed costs for FTA use differ by industry because of differences in the complexity of input-output structures.
14
that affiliate is engaged in exporting activities with AFTA member countries, not Malaysia specifically. In short, in the case of AFTA, we cannot exactly identify the importing country. As a result, the importing “countries” in our sample are ASEAN, China, India, Japan, and Korea.
The third point is that we match countries in our model based on the importing country rather than specific country pairs in order to assure a sufficient number of control groups in each “category.” That is, an affiliate using an FTA when exporting from Thailand to Malaysia may be matched with non-user(s) exporting from the Philippines to Malaysia. However, our inclusion of exporting country dummy variables and the restriction of exporting countries to ASEAN countries may be a remedy for this method of matching to some extent.
3.3. Information from the JETRO Survey
Before reporting the empirical results, we provide a brief overview of affiliates’ use of FTAs. Table 1 shows Japanese affiliates’ change in status for (bilateral) exporting activities and FTA use from 2009 to 2010. Note that each cell shows the number of affiliate-importing country observations (importing countries are ASEAN, China, Japan, Korea, and India), not the number of affiliates. We can see that there are many affiliates that did not export to any of our importing countries in both 2009 and 2010. The largest group of affiliates is engaged in exporting activities, but did not use FTA schemes (33%). The affiliates that did not use FTA schemes but did export in either year also make up a large portion of the sample. On the other hand, there are few affiliates that started FTA use at the same time that they started exporting (1%), or that stopped both FTA use and exporting at the same time (0%). It is also interesting to note that stopping FTA use while continuing exporting activities is also rare. Thus, affiliates that stop the use of FTAs are more likely to stop exporting activities. Also, when starting use of an FTA with a country, affiliates typically have already exported to that country.
=== Table 1 ===
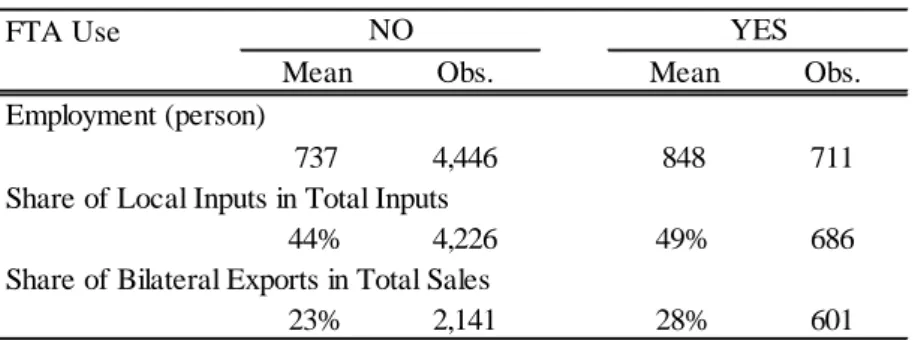
Table 2 compares the average values in several indicators for FTA users and non-users. In this table, we already restrict the sample to only exporting affiliates. First, on average, FTA users (848) are larger in terms of employment than non-users (737). Second, a higher share of local inputs as a percentage of total inputs can be observed in FTA users. In the case of FTAs with ASEAN countries, the ROOs generally set the real
15
value-added content criterion at 40%.9 On average, while both FTA users and non-users have local input shares that exceed 40%, the share in FTA users (49%) is higher than in non-users (44%). Third, the share of bilateral exports as a percentage of total sales is higher in FTA users (28%) than in non-users (23%). In sum, FTA users have higher values in all three indicators compared with non-users.
=== Table 2 ===
These observations are valuable, but we need to pay attention to the causality between these performance changes and FTA utilization. In this comparison, for example, the relatively large employment shown by FTA users could result from their inherent attributes (selection effect) or from the positive impact of using FTAs. In the next section, in order to explore the selection effect, we examine the relationship between firms’ use of FTAs and the ex-ante characteristics for affiliates in the samples (VII) and (VIII) in Table 1. Then, using empirical methods appropriate for careful consideration of the causality issues, namely a matching method, we can isolate and examine the impacts of FTA use.
4. Empirical Results
In this section, we present the results of our DID-matching model on the impacts of FTA use on firm performance. We first report our baseline results for the impacts on employment. Then, several robustness checks on those results are conducted. Lastly, we investigate the impacts of FTA use on firms’ local inputs and exports.
4.1. Baseline Results
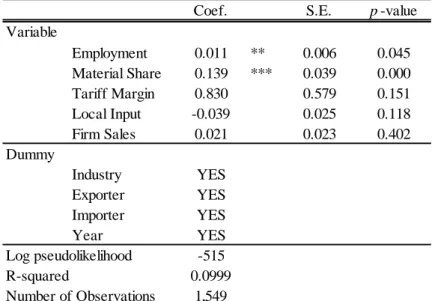
As a first step, appropriate counterfactuals were selected by estimating the propensity score of using FTA schemes for each affiliate and by matching FTA users with non-users. The results of the probit regression for the affiliate’s decision to use FTA schemes are reported in Table 3. The results seem to be satisfactory, though the
9
In East Asia, changes in tariff classification criterion or the optional criterion tend to be adopted through the ROOs. While the former criterion determines the country of origin of goods by whether the tariff classification assigned to the final goods produced in the country shows a change from the tariff classification of the input goods, the latter one does so by determining whether the product meets either a value added content criterion or a change in tariff classification criterion. The value added content criterion determines the country of origin of goods by assessing whether a certain level of value is added on the product.
16
coefficient for Tariff Margin is estimated to be insignificant. The pseudo R-square is as high as in the previous studies cited in the introductory section. This regression can also be useful for examining the selection effect of FTA use. The significantly positive impact on employment is consistent with our expectation. Affiliates with 10% larger employment have an 11% higher probability of using FTA schemes. Only affiliates that are sufficiently large can afford to pay the expenses of using FTAs. The coefficient for Material Share is also estimated to be significantly positive, indicating that labor-intensive affiliates are less likely to use FTA schemes. The coefficients for Local Input and Firm Sales are insignificant. By using these estimators, the propensity score of using FTAs is calculated for each affiliate.
=== Table 3 ===
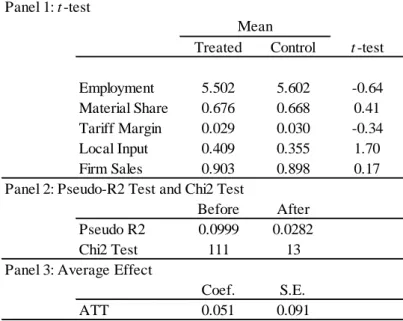
As mentioned before, the matching of FTA users and non-users is performed on the basis of the importing country. In order to confirm whether or not the choice of matching algorithm is appropriate, we check the balancing property of affiliate-specific explanatory variables used in the probit regression. Specifically, differences in the means of the affiliate-specific variables between the treated group (FTA users) and the control group (appropriately selected non-users) are statistically tested. The results reported in Panel 1 of Table 4 show that there are no significant differences in the means of any of the affiliate characteristics, though the difference in Local Input is significant at the 10% confidence level. Also, Panel 2 in Table 4 shows that the pseudo R-squared decreases greatly after matching and that the Chi-squared test of joint insignificance of regressors is not rejected. These results indicate that matching by using the estimated propensity score has been done successfully.
=== Table 4 ===
The next step is to estimate the average effect of FTA use using the DID-matching estimator. 10
Specifically, we statistically examine the difference in changes of
10
In Table 3, some variables have insignificant coefficients. In the literature, there is a debate on whether insignificant variables should be included in the propensity score specification (see, for example, Caliendo and Kopeinig, 2008). Although we report the probit results using the variables with insignificant coefficients in Table 3, some of these same variables turn out to have significant results according to samples shown in Table 5. Also, even if insignificant variables are excluded, the impact of FTA use in the results does not change much.
17
employment between FTA users and their counterfactuals before and after using FTA schemes. The result is reported in Panel 3 of Table 4. The effect is estimated to be negative but insignificant, indicating that the use of FTAs does not increase affiliates’ employment. Before settling on this conclusion, we investigate the impacts of FTA use on employment in several ways in the following section.
4.2. Robustness Checks
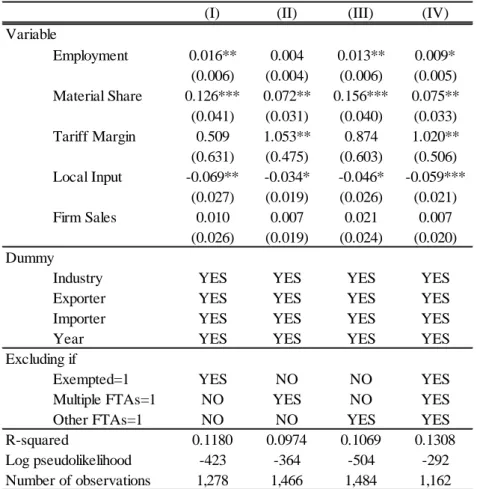
In this subsection, we conduct several robustness checks on our results by dropping certain types of affiliates from our sample. We first drop the affiliates that do not use FTA schemes because they are already exempted from tariffs on their exports. The JETRO survey asks affiliates about their reasons for not utilizing FTAs, and the leading reason for affiliates that engage in exporting is that the “importers are exempted from tariffs”. Actually, in many ASEAN countries, incentives to promote inbound investment reduce or eliminate tariffs on materials or parts imported for the assembly and export of finished products. Thus, if firms export to partners with such incentives, they do not need to make use of FTAs in their exporting. By dropping these exporting affiliates, we restrict the samples to firms that must make rational decisions on FTA use. Second, we drop affiliates that start the use of multiple FTAs in the same year. In this case, if the use of one FTA has some degree of positive impact, such affiliates may receive twice the impact. In order to evaluate the purer effects of the use of a single FTA, we drop such affiliates from the samples. Third, we drop the sample of affiliate-importer pairs in which the affiliate does not use FTA schemes in the importer country but does use FTAs when exporting to other countries. This is done in order to avoid the underestimation of the impacts of FTA use. Lastly, we jointly drop all three of these types of affiliates from our sample.
The results with these modified samples are as follows. Table 5 reports the results of the probit model. Although the effect on employment is insignificant if we exclude affiliates using multiple FTAs, we can see that the affiliates with 10% larger employment have a 9% to 16% higher probability of using FTA schemes. Also, certain estimations yield significantly positive coefficients for Tariff Margin, which is consistent with our expectation. For example, the observed coefficient of 0.073 indicates that a 1% point expansion of tariff margin raises the probability of FTA use by about 7%. However, the results for Tariff Margin in terms of magnitude are unstable. These unstable results might be due to a non-linear relationship with firms’ FTA use (see, for example, Francois, Hoekman, and Manchin, 2006; Hayakawa, 2011). All of the coefficients for Local Input are significantly negative. This result may be somewhat
18
puzzling because affiliates with a higher local input share seem to be able to meet the ROOs more easily. Here, we can safely say that affiliates with a higher share of imported inputs have more knowledge on international activities and thus are more likely to use FTA schemes. That is, we should interpret the role of the Local Input variable as controlling for the remaining heterogeneity in the knowledge and experience in international activities across overseas affiliates.11 The DID-matching estimates are reported in Table 6. As in Table 4, we do not find any positive impact of FTA use on affiliates’ employment in any specifications.
=== Tables 5 & 6 ===
Last, following Martincus and Carballo (2008), we tried other matching algorithms, namely radius matching using a caliper of 0.04 and kernel matching using the Epanechnikov kernel with a bandwidth of 0.04. The results of ATT for these alternative matching methods are reported in Table 7. Again, the results show insignificant impacts in all specifications for both matching algorithms. As a result, we conclude that the use of FTA schemes does not increase firms’ employment. There are two possible explanations for this result. The first explanation is that our results capture the short-run impacts of FTA use, rather than just the impacts on firms’ employment in the year when they start to use FTA schemes.12 Therefore, the impacts on employment may show up a few years after the use of FTA schemes begins. The other reason could be that FTA users increase work-hours per employee rather than the number of persons employed. This second interpretation is likely because there has been a serious shortage of workers in ASEAN countries in recent years.13
=== Table 7 ===
4.3. Other Performance Indicators
11
Interpreting the differences in results across the specifications presents some difficulty. For example, if firm size matters in the use of FTA schemes, the use of multiple FTA schemes likely requires firms to be rather large. Therefore, the exclusion of firm using multiple FTAs from the sample shifts the coefficient for Employment downward.
12
We do not examine affiliates’ performance one year after their use of FTAs. To do such an analysis, we need to restrict the sample of affiliates to those that exist in all three years. The number of such affiliates is too small to be used for analysis.
13
Unfortunately, the JETRO survey does not have a data item of work hours, so we could not examine the impacts of FTA use on employment in terms of hours worked.
19
In this last subsection, we examine the impacts of FTA use on other affiliate performance indicators. Specifically, we investigate the share of local inputs as a percentage of total inputs and the share of bilateral exports as a percentage of total sales. The results are reported in Table 8.
=== Table 8 ===
In contrast to employment, some estimations yield significant impacts on local inputs from FTA use. Specifically, FTA users increase their local input share by between 5% and 7%. That is, firms starting the use of FTA schemes increase of the usage of local inputs so as to meet the ROO requirements, particularly the real value-added criterion. However, in the case of FTAs by ASEAN, the optional criterion also tends to be adopted in the ROOs, where the country of origin of goods is determined by whether or not the product meets either a value-added content criterion or a change in tariff classification criterion. Nevertheless, this result is consistent with the common view that the ROOs are an inevitable “cost” of introducing FTA schemes. The existence of ROOs distorts firms’ optimal procurement behavior.
As in the case of local inputs, some estimation reveals that FTA users experience a significant increase in bilateral exports. We find an increase of around 3% in the share of bilateral exports as a percentage of total sales. This finding is consistent with the gravity studies using the aggregated trade data, as FTAs surely increase the international trade between member countries. Furthermore, our analysis can be taken as a firm-level analysis on the impacts of tariff reduction on intensive margin. The positive impacts from firms’ FTA use on their exports in our results may be consistent with Debaere and Mostashari (2010), who examine the impacts on intensive and extensive margins using the aggregated trade data and find small effects of tariff reductions on extensive margin, relative to the overall growth in international trade. Indeed, we find in Table 1 that there are few affiliates that start exporting and FTA use at the same time (extensive margin). Also, an immediate positive impact on exports may be more consistent with our interpretation that FTA use increases work-hours per employee, rather than the number of employment. In other word, FTA users seem to achieve their export expansion by increasing the number of work-hours per employee.
5. Concluding Remarks
20
international activities such as exporting or investing abroad; namely, self-selection of more productive firms into international activities and learning-by-doing international activities. This paper is the first study to explore these hypotheses on the use of FTAs at the firm level. We first estimate a propensity score for firms to use FTA schemes and find that larger firms are more likely to use FTA schemes. Also, firms in industries with larger tariff margins and firms with a larger share of imported inputs tend to use FTA schemes. Then, by conducting propensity score matching analyses, we find that the use of FTAs does not change employment but does raise the share of local inputs and exports.
Our results have the following policy implications. First of all, as is well-known, policy support is necessary to encourage small- and medium-sized enterprises to use FTA schemes because our analysis of selection effects confirms that firm size matters. Second, the use of FTA schemes is beneficial for firms because it increases their exports. As is well known in the literature on export learning, export expansion contributes to the enhancement of exporters’ productivity. Thus, our results can provide justification to policymakers as to why they should encourage firms to use FTA schemes. Third, the observed impact on firms’ local inputs in our results proves that ROOs have a distorting effect on firms’ optimal procurement behavior. This result is the first firm-level evidence on the cost of FTA use. Thus, as is widely pointed out, devising ROO criteria that can minimize the distortion effect of FTAs is critical.
21
References
Baier, S.L. and Bergstrand, J.H., 2007, Do Free Trade Agreements Actually Increase Members’ International Trade?, Journal of International Economics, 71(1): 72-95. Baldwin, R.E. and Venables, A. J., 1995, Regional Economic Integration, in Grossman
G.M. and K. Rogoff eds., Handbook of International Economics, Volume 3, North-Holland, 1597-1644.
Bernard, A. and Jensen, B., 1999, Exceptional Exporter Performance: Cause, Effect, or Both?, Journal of International Economics, 47(1): 1-25.
Blundell R. and Costa Dias, M., 2002, Alternative Approaches to Evaluation in Empirical Microeconomics, Portuguese Economic Journal, 1(2): 91-115.
Brown D.K., Deardorff, A.V., and Stern, R.M., 1995, Estimates of a North American Free Trade Agreement, in Kehoe P.J. and Kehoe T.J. (eds.), Modeling North American Integration, Kluwer Academic Publishers, Dordrecht.
Caporale, G., Rault, C., Sova, R., and Sova, A., 2009, On the Bilateral Trade Effects of Free Trade Agreements between the EU-15 and the CEEC-4 countries, Review of World Economics, 145(2): 189-206.
Castellani, D., Mariotti, I., Piscitello, L., 2008, The Impact of Outward Investments on Parent Company’s Employment and Skill Composition: Evidence from the Italian Case, Structural Change and Economic Dynamics, 19(1), 81-94.
Castellani, D., Serti, F. and Tomasi, C., 2010, Firms in International Trade: Importers and Exporters Heterogeneity in the Italian Manufacturing Industry, The World Economy, 33(3): 424-457.
Chang, P.L. and Lee, M., 2011, The WTO Trade Effect, Journal of International Economies, 85: 53-71.
Chen, M. and Moore, M., 2010, Location Decision of Heterogeneous Multinational Firms, Journal of International Economics, 80(2): 188-199.
Caporale, G., Rault, C., Sova, R., and Sova, A., 2009, On the Bilateral Trade Effects of Free Trade Agreements between the EU-15 and the CEEC-4 countries, Review of World Economics, 145(2): 189-206.
Cox, D.J., 1995, An Applied General Equilibrium Analysis of NAFTA’s Impact on Canada, in Kehoe P.J. and Kehoe T.J. (eds.), Modeling North American Integration, Kluwer Academic Publishers, Dordrecht.
De Loecker, J., 2007, Do Exports Generate Higher Productivity? Evidence from Slovenia, Journal of International Economics, 73(1), 69-98.
22
International Trade? An Empirical Analysis, Journal of International Economics, 81(2):163-169.
Estevadeordal, A., 2000, Negotiating Preferential Market Access: The case of the North American Free Trade Agreement, Journal of World Trade, 34: 141-200.
Estevadeordal, A. and Suominen, K., 2004, Rules of Origin in FTAs in Europe and in the Americas: Issues and Implications for the EU-Mercosur Inter-Regional Association Agreement, INTAL-ITD Working Paper 15.
Felbermayr, J. and Kohler, W., 2006, Exploring the Intensive and Extensive Margins of World Trade, Review of World Economics, 142(4):642-674.
Francois, J., Hoekman, B., and Manchin, M., 2006, Preference Erosion and Multilateral Trade Liberalization, World Bank Economic Review, 20(2): 197-216.
Fukao, K. and H. Kwon, 2006, Why Did Japan’s TFP Growth Slow Down in the Lost Decade? An Empirical Analysis Based on Firm-level Data of Manufacturing Firms, Japanese Economic Review, 57(2): 195-228.
Hayakawa, K., 2011, Measuring Fixed Costs for Firms’ Use of a Free Trade Agreement: Threshold Regression Approach, Economics Letters, 113(3): 301-303.
Hayakawa, K., Kimura, F., and Machikita, T., 2011, Globalization and Productivity: A Survey of Firm-level Analysis, Forthcoming in Journal of Economic Surveys. Heckman, J., Ichimura, H., Todd, P.E., and Todd, P., 1998, Characterizing Selection Bias
Using Experimental Data, Econometrica, 66(5): 1017-1098.
Hertel, T., 1997, Global Trade Analysis: Modeling and Applications, Cambridge University Press, New York.
Hijzen, A., Inui, T., and Todo, Y., 2010, Does Offshoring Pay? Firm-Level Evidence from Japan, Economic Inquiry, 48(4): 880-895.
Hijzen, A., Jean, S., Mayer, T., 2011, The Effects at Home of Initiating Production Abroad: Evidence from Matched French Firms, Review of World Economics, 147(3): 457-483.
Kimura, F. and Kiyota, K., 2006, Exports, FDI, and Productivity: Dynamic Evidence from Japanese Firms, Review of World Economics, 142(4): 695-719.
List, A., Millimet, D., Fredriksson, G., and McHone, W., 2003, Effects of Environmental Regulations on Manufacturing Plant Births: Evidence from a Propensity Score Matching Estimator, Review of Economics and Statistics, 85(4): 944-952.
Martincus, C. and Carballo, J., 2008, Is Export Promotion Effective in Developing Countries? Firm-level Evidence on the Intensive and the Extensive Margins of Exports, Journal of International Economics, 76: 89-106.
23
Medvedev, D., 2010, Preferential Trade Agreements and their Role in World Trade, Review of World Economics, 146: 199-222.
Melitz, M., 2003, The Impact of Trade on Intra-Industry Reallocations and Aggregate Industry Productivity, Econometrica, 71(6): 1695-1725.
Navaretti, B., Castellani, D., Disdier, A-C., 2010, How Does Investing in Cheap Labour Countries Affect Performance at Home? France and Italy, Oxford Economic Papers, 62(2), 234-260.
Sobarzo, H.E., 1995, A General Equilibrium Analysis of the Gains from NAFTA for the Mexican Economy, in Kehoe P.J. and Kehoe T.J. (eds.), Modeling North American Integration, Kluwer Academic Publishers, Dordrecht.
Vicard, V., 2009, On Trade Creation and Regional Trade Agreements: Does Depth Matter?, Review of World Economics, 145: 167-187.
Vogel, A. and Wagner, J., 2010, Higher Productivity in Importing German Manufacturing Firms: Self-selection, Learning from Importing, or Both?, Review of World Economics, 145(4): 641-665.
24 Table 1. Change in Firms’ Export and FTA Status
Number Share Export FTA Export FTA
(I) NO NO NO NO 1,156 29%
(II) NO NO YES NO 527 13%
(III) NO NO YES YES 57 1%
(IV) YES NO NO NO 491 12%
(V) YES YES NO NO 3 0%
(VI) YES YES YES NO 95 2%
(VII) YES NO YES NO 1,297 33%
(VIII) YES NO YES YES 213 5%
(XI) YES YES YES YES 99 3%
Total 3,938
2009 2010
25
Table 2. Average Performance: FTA Users versus Non-users
FTA Use
Mean Obs. Mean Obs.
Employment (person)
737 4,446 848 711
Share of Local Inputs in Total Inputs
44% 4,226 49% 686
Share of Bilateral Exports in Total Sales
23% 2,141 28% 601
NO YES
26
Table 3. Selection Effects in FTA Utilization: Probit Analysis (Marginal Effect)
Coef. S.E. p -value
Variable Employment 0.011 ** 0.006 0.045 Material Share 0.139 *** 0.039 0.000 Tariff Margin 0.830 0.579 0.151 Local Input -0.039 0.025 0.118 Firm Sales 0.021 0.023 0.402 Dummy Industry YES Exporter YES Importer YES Year YES Log pseudolikelihood -515 R-squared 0.0999 Number of Observations 1,549
Notes: In this table, the marginal effects of the regressors are reported. *** and ** indicate
significance at the 1% and 5% levels, respectively. “S.E.” represents the White-consistent standard error. For the Employment variable, we take its logarithm. The dependent variable is an indicator variable that takes unity if an affiliate uses FTA schemes in exporting to an FTA partner country. With the exception of Tariff Margin and several dummy variables, independent variables are lagged by one year.
27
Table 4. Impacts of FTA Utilization: DID-matching Method
Panel 1: t -test
Treated Control t -test
Employment 5.502 5.602 -0.64 Material Share 0.676 0.668 0.41 Tariff Margin 0.029 0.030 -0.34 Local Input 0.409 0.355 1.70 Firm Sales 0.903 0.898 0.17 Panel 2: Pseudo-R2 Test and Chi2 Test
Before After Pseudo R2 0.0999 0.0282
Chi2 Test 111 13
Panel 3: Average Effect
Coef. S.E.
ATT 0.051 0.091
Mean
Notes: Panel 1 reports the t-test statistics for the difference in means between the treated and control
groups after matching. In Panel 2, the values for the pseudo R-squared and the chi-squared tests of joint significance of covariates are obtained in the first stage estimation of the probit model. Panel 3 reports the DID-matching estimate of average treatment effect on the treated. In this table, the matching algorithm is the nearest neighbor method with the caliper of 0.04, common support, and replacement. For of the Employment variable, we take its logarithm.
28
Table 5. Robustness Checks by Various Samples: Selection Effects
(I) (II) (III) (IV)
Variable Employment 0.016** 0.004 0.013** 0.009* (0.006) (0.004) (0.006) (0.005) Material Share 0.126*** 0.072** 0.156*** 0.075** (0.041) (0.031) (0.040) (0.033) Tariff Margin 0.509 1.053** 0.874 1.020** (0.631) (0.475) (0.603) (0.506) Local Input -0.069** -0.034* -0.046* -0.059*** (0.027) (0.019) (0.026) (0.021) Firm Sales 0.010 0.007 0.021 0.007 (0.026) (0.019) (0.024) (0.020) Dummy
Industry YES YES YES YES
Exporter YES YES YES YES
Importer YES YES YES YES
Year YES YES YES YES
Excluding if
Exempted=1 YES NO NO YES
Multiple FTAs=1 NO YES NO YES
Other FTAs=1 NO NO YES YES
R-squared 0.1180 0.0974 0.1069 0.1308
Log pseudolikelihood -423 -364 -504 -292 Number of observations 1,278 1,466 1,484 1,162
Notes: This table reports the marginal effects of the regressors. ***, **, and * indicate significance at
the 1%, 5%, and 10% levels, respectively. “S.E.” represents the White-consistent standard error. For the Employment variable, we take its logarithm. The dependent variable is an indicator variable that takes unity if an affiliate uses FTA schemes in exporting to an FTA partner country. With the exception of Tariff Margin and several dummy variables, independent variables are lagged one year. In the restricted samples, when “Exempted = 1”, we exclude affiliates that do not use FTA schemes because their exported products are already exempted from tariffs in their exporting; when “Multiple FTAs = 1” we exclude affiliates that began the use of multiple FTAs in the same year; and when “Other FTAs = 1”, we exclude affiliate-importer pairs in which affiliates do not use FTA schemes when exporting to importer countries in our sample but do use FTAs to export to other countries.
29
Table 6. Robustness Checks by Various Samples: Impacts of FTA Use
Coef. S.E. Before After Before After
Excluding if Exempted=1
0.002 0.064 0.1180 0.0312 112 12
Excluding if Multiple FTAs=1
0.021 0.099 0.0974 0.0287 90 9
Excluding if Other FTAs=1
0.015 0.067 0.1069 0.0308 117 16
Excluding if Exempted=1/Multiple FTAs=1/Other FTAs=1
0.018 0.118 0.1308 0.0615 110 15
ATT Pseudo R2 Chi2 Test
Notes: The “ATT” column of shows the DID-matching estimate of average treatment effect on the
treated. In this table, the matching algorithm is the nearest neighbor method with the caliper of 0.04, common support, and replacement. “S.E.” represents the White-consistent standard error. The pseudo R-squared and the chi-squared test of joint significance of covariates are obtained in the first stage estimation of the probit model, the results of which are reported in Table 5. In the restricted samples, when “Exempted = 1”, we exclude affiliates that do not use FTA schemes because their exported products are already exempted from tariffs in their exporting; when “Multiple FTAs = 1” we exclude affiliates that began the use of multiple FTAs in the same year; and when “Other FTAs = 1”, we exclude affiliate-importer pairs in which affiliates do not use FTA schemes when exporting to importer countries in our sample but do use FTAs to export to other countries.
30
Table 7. Robustness Checks by Various Matching Methods
Coef. S.E. Coef. S.E.
All
-0.015 0.100 0.011 0.135
Excluding if Exempted=1
-0.021 0.097 -0.025 0.094 Excluding if Multiple FTAs=1
0.003 0.116 0.005 0.139
Excluding if Other FTAs=1
-0.010 0.092 -0.019 0.104 Excluding if Exempted=1/Multiple FTAs=1/Other FTAs=1
-0.011 0.138 -0.011 0.155
Radius Kernel
Notes: This table reports the DID-matching estimate of average treatment effect on the treated. In the
“Radius” and “Kernel” columns, the matching algorithms are the radius matching method obtained with a caliper of 0.04 and the kernel matching method based on the Epanechnikov kernel with a bandwidth of 0.04, respectively. We conduct both kinds of matching with replacement under the common support. “S.E.” represents the White-consistent standard error. In the restricted samples, when “Exempted = 1”, we exclude affiliates that do not use FTA schemes because their exported products are already exempted from tariffs in their exporting; when “Multiple FTAs = 1” we exclude affiliates that began the use of multiple FTAs in the same year; and when “Other FTAs = 1”, we exclude affiliate-importer pairs in which affiliates do not use FTA schemes when exporting to importer countries in our sample but do use FTAs to export to other countries.
31 Table 8. Other Performance Indicators
Coef. S.E. Coef. S.E. Coef. S.E.
Share of Local Inputs as a Percentage of Total Inputs All
0.067 *** 0.006 0.047 0.033 0.065 *** 0.009 Excluding if Exempted=1
0.052 0.042 0.039 0.025 0.024 0.064
Excluding if Multiple FTAs=1
0.003 0.030 0.019 0.041 -0.016 0.048 Excluding if Other FTAs=1
0.067 *** 0.024 0.051 * 0.031 0.064 *** 0.022 Excluding if Exempted=1/Multiple FTAs=1/Other FTAs=1
0.015 0.095 0.023 0.043 -0.067 0.152 Share of Bilateral Exports as a Percentage of Total Sales
All
-0.006 0.055 -0.002 0.026 -0.004 0.059 Excluding if Exempted=1
0.007 0.025 0.010 0.025 0.010 0.029
Excluding if Multiple FTAs=1
-0.001 0.044 -0.005 0.033 0.007 0.052 Excluding if Other FTAs=1
-0.014 0.036 0.001 0.025 -0.012 0.039 Excluding if Exempted=1/Multiple FTAs=1/Other FTAs=1
0.035 *** 0.013 0.015 *** 0.053 0.036 *** 0.014
NN Radius Kernel
Notes: This table reports the DID-matching estimate of average treatment effect on the treated. In the
columns of “NN”, “Radius”, and “Kernel”, the matching algorithms are the nearest neighbor method with a caliper of 0.04, the radius matching method obtained with a caliper of 0.04, and the kernel matching method based on the Epanechnikov kernel with a bandwidth of 0.04, respectively. We conduct these kinds of matching with replacement under the common support. “S.E.” represents the White-consistent standard error. ***, **, and * indicate significance at the 1%, 5%, and 10% levels, respectively. In the restricted samples, when “Exempted = 1”, we exclude affiliates that do not use FTA schemes because their exported products are already exempted from tariffs in their exporting; when “Multiple FTAs = 1” we exclude affiliates that began the use of multiple FTAs in the same year; and when “Other FTAs = 1”, we exclude affiliate-importer pairs in which affiliates do not use FTA schemes when exporting to importer countries in our sample but do use FTAs to export to other countries.