Biological Monitoring ofExposure to Organic Solvent Vapors
II. Simulation Studies using a Physiological Pharmacokinetic
Model for m-Xylene
Takashi KANEKo, Kazushi ENDoH,aRd Akio SATo
DePartment ofEnvironmental Health, Medical Universdy of Yamanashi, Tamaho, Yamanashi 409-38,JaPan
Abstract: The relationship between external and internal doses of m-xylene afid the effects of
body weight, body fatcontent, sex, and phys'ical activity on the pharmacokinetics of m-xylene were
studied using a physiological simulation model.
1. Adow exposure concentrations, equal time-weighted average (TWA) concentrations gave
almost the same intemal dose of m-xylene.
2. The m-xylene concentration in the blood increased continuously with increasing m-xylene concentration in inhaled air. By contrast, the excretion rate of m-methyl hippuric acid (m-MHA) in the urine approached a plateau with increasing m-xylene exposure concentration.
3. The larger the body size, the larger the amount of m-xylene absorbed, However, no significant change was found in m-xylene concentration in the blood with increase in body size. By contrast,
the amounts of m-MHA excreted in the urine varied with body size: the Iarger the body size, the greater was the rate of urinary m-MHA excretion.
4. Both m-xylene concentration in the blood and the rate of urinary m-MHA excretion were
higher ln a slim than in an obese man dttring exposure, but this relationship was reversed in due
course of time after exposure.
5. The physical activity (50 W) during exposure greatly increased the blood concentration of m-xylene as well as the rate of urinary m-MHA excretion.
6. The concentration of m-xylene in the blood during exposure was lower in women than in men, while the opposite was true starting about 1O hours after the end ofexposure. The rate of m-MHA
excretion in the urine was lower in women than in men both during and after exposure.
Key words: Physiologically based pharmacokinetic model, m-Xylene, m-Methyl hippuric acid, Externai and internai doses, Biological exposure monitoring
INTRODUCTION
The term "dose-effect relationship" is often
used in the field of toxicelogy. The toxic
potential of a chemical is expressed on the
basis of this dose-effect relationship. In animal
experiments, the "dose" is generaliy expressed
as the amount of the chemical administered
per uRit body weight or, when the chemical is inhaled, as the concentration of the inhalaRt
Received
Accepted
April 17, l991 May 1, 1991
multiplied by the duratioit ofinhalation. Aside from local toxicity observed at the site of entry
of the chemical, toxicity of the chemical
de-velops as it is absorbed, distributed,
metabol-ized, afid excreted. The conceRtratioB of the
chemical (or its metabolites) in the target tissue
determines the degree of toxicityi).
Toxicity after inhalatioR of a fixed concen-tration of solveRt vapor is not equal among
individual orgaRisms even in the simplest scheme of an animal experiment. This indi-vidual variation of toxicity is accounted for in
target tissue, but it is mostly derived from
differences in the concentration of the chemic-al ilt the target tissue. IR inhchemic-alation exposure,
the absorption of an inhalant changes greatly with alveolar ventilatioR even when the
con-ceRtratioR of the inhalant is fixed. Therefore, to accurately define the dose-effect
rela-tioRship, the "dose" must be the coRcentratioR
in the target tissue (target tissue dose) or, at
least, the amount effectively absorbed by the body (int.erRal dose) instead of the inhalant concentration (extemal dose),
When the toxicity is caused by the chemical itself, the intemal dose may be represented by the area under the concentratioR-time curve (AUC) of the chemical. However, the situation
is more complex wheR metabolites are
re-sponsible for the toxicity, because the toxicity
in this case is proportienal to the amount of adducts generated, and £his is determined by
the relative' rates of r}etabolic activation aRd detoxificatioR,
The objective of biological exposure moni-toriRg is to estimate the internal dese on the basis of measurements of the concelttra£ion of the chemical or its metabolites in biological
samples2). Ideally, the health effect should be
assessed from the interRal dose aRd a known
dose-effect relationship. However, to date little is kRown of the internal dose-effect
rela-tiofiship of organic solven£s. Only maximum allowable concentratiens for external exposure
have been established from external
dose-effec£ relationships based on data obtained
from longstanding field work or laboratory
investigations. This maximum allowable con-centration is generally expressed as the
expo-sure concentratien at which the solvent is
coRsidered to pose no health problerfis iR an
average worker who inhales it for 8 hours a
day, 5 days a week, for a prolonged period3>.
However, the conceRtratien in the work en-viroRmeltt grea£ly varies during the work shift.
Therefore, the maximi-}m allowable coRcentra-tion is expressed as the time-weighted average
(TWA) coltcentration duriRg the 8-hour
period.
Recently, close correlations between the ex-posure concentration (external dose) and the concentration of the solvents or their
metabo-lites in bielogical samples (internal dose) have
beeR found for some solvents4). The biological
exposure iRdex (BEI) recommeRded in I984-1985 by the American Conference of Govem-mental Industrial Hygienists (ACGIH)3) is expressed as the concentration of a chemical or
i£s metabolite ln a biological sample which
corresponds to the maximum allowable TWA. The BEI was intended to indicate possible
excessive expesure. When the concentration in
a biological sample exceeds the BEI, it rr}ay be
necessary to reassess the work environment.
Organic solven£s may be absorbed percu-taReously because they are more or less
absorb-able through the skin, and they may enter the mouth via contaminated hands. If the results
of biological monitoring have exceeded the
BEI and the exposure conceRtration has beek
withilt the allowable raRge, iRvestigations are warranted to determine whether or Rot the
solvent entered the body by routes other than
the airway, whether or not there has been
RoR-occupatioRal contact with the solvent, and
whether or no£ there are other factors that may
explain the abnormal values.
However, the concentrations ofthe chemical and its metabolites in the body also change with time. Therefore, questions arise as to when samples should be collected for the most accurate estimate of the internal dose. Also,
physiological and environmental factors affect-ing the pharmacokinetics of chemicals in-fluence the estimate. This variatiolt poses the greatest difficulty in biological exposure
moni-tormg.
The preseltt study was inteRded to clarify the relatioRship between exterRal and internal
doses and to assess the effects of physiological
factors on the relationship usiltg our Rewly developed physiological pharmacokinetic model for m-xylene5).
METHoDs
1. Simulation modelOur physiolegical medel of m-xy}ene phar-macokinetics iR humans5) was used iR this study.
2. SimzLlation Parametexs and exposttTe conditions
l) Relationship between exte}"nal・and iRterRal
a) Continuous exposure and
iRtermittentexp-osure
Continuous exposure of a 70 kg male £o 50 pp:n m-xylene for 8 hours was simulated usiRg the parameters in Table l. In£ermittent expo-sure of the same man to 100 ppm rrt-xylene for Tabie l. Simulation parameters for m-xylene
1 hour 4 times at 1-hour intervals was also simuiated.
b) IRternal dose by raRdom exposure
Effects of fluctuations iR the exposure con-centration with time en the internal dose were evaluated. Sixteen 30-min exposures ofa 70 kg male (Table 1) to :n-xylene at various concen-trations (O ppm × 2, 5 ppm, 10 ppm, 20 ppm,
4e ppm × 2, 50 ppm × 4, 75 ppm × 3, 110 ppm, and 15e ppm) were simulated. We used
four exposure patterns: random (exposure
concentrations arranged in a random order),
incremental (exposure coRceRtrations
ar-raltged in order from lowest to highest), decremeRtal (expost}re concentratioRsar-pharmacokinetics in man and woman. Compartment Volumea), l Blood fiow2'), llmin Partition coefficienti') (tissuelblood)
Man
Woman
Man
Woman
Lung (LC) Vessel-rich (VRC) Vessel-poor (VPC) Muscle (MC) Fat (FC) Gastrointestinal (GC) Hepatic (HC) Shunt VLc) O.030Bwd)
O.085BW
O.415BW
O.211BW
e.O19BW
O.023BW
VLC) O.030Bwd)O.085BW
e315BW
O.365BW
O,Ol9BW
O.023BW
Qc Qc
O.379Qc O.379Qc O.063Qc O.063Qc O.114Qc O.087Qc O.053Qc O.092Qc e.l71Qc O.171Qc O.069Qc O.069Qc O.151Qc O.139Qc 4.094A2
2Dl 3.01 77.8 4.67 3.02Bloodlair partition coefficient
Cardiac output (Qc)"), llmin
(A)e)
Man
26.4Woman
Vmaxb)b, mmollmin Kmb), imnolll Kexb), min-i Cl)L O.296(Bw)O・iVmaxl
1.394×IG-3(Bw)o・7KmI
O.OS3 O.267(Bw)O・i Vmaxt) I.115×1O-2(Bw)O・7Km2
O.330 O.Ol2Qc
a) b) c) d) e)b
Reference 7. Experimentally determined.VL == Functional residual capacity + l13 oftidal volu ine + volume ofarterial blood × A
+ volume of lung tissue × lunglair partition coefficient (Reference 8).
Body weight in kg.
Reference 9.
Extrapolated from rat data as follows: (Vmax of rats) × (B"VNi of humans!BMJ of
ranged in order from highes£ to lowest), and increase-decrease (peak coltcentratioR
occur-red in the middle of the exposure period)
pa£tern. With a}1 exposure pattems, the TWA concentration during the 8-houy period was 50
ppm. The blood concentratien was expressed as the concentratioR in the blood flowing out of
the vessel-rich tissue compartr[teRt (VRC).
c) Exposure coBcentration and
pharmaco-kiRetics
An 8-hour coRtinuous exposure of a 70 kg
male (Table 1) to m-xyleRe at various
coRcen-trations (from O ppm to 4,OeO ppm) was
simulated.
2) Physiological factors affecting the pharma-cokinetics of m-xylene
a) Body size i) Body weight
The effects of body weight on the pharma-cokinetics of m-xylene were simulated for three males of s£andard (7e kg), large (100 kg),
aRd small (40 kg) body build. Body size was scaled up or down without changing the body
framework.
ii) Body fat coRtent
Since organic solvents are geRerally highly
soluble in lipids, body fat content is likely to
have a major effect on their pharmacokinetics.
The effe£ts of body fat content on the
Table2. Physiological
effects o m-xylene.
parameters
f physical activity
cokinetics of m-xylene were simulated for
three males ofstandard (body weight 70 kg, fat
tissue volume 14.8 l), obese (body weight 85 kg, fat tissue volume 29.5 l), and slim (body weight
62 kg, fat tissue volume 7.4 l) body build. Blood flow through the fat tissue was changed in proportion to the tissue volume. All para-meters other than the vo}ume and blood flow of fat tissue were assumed to be the same. b) Exercise
The pharmacokinetics of m-xylene was
simula£ed for a standard maa (70 kg, 14.8 l fat tissue) who iRhaled the solvent at 50 ppm for 8
hours while working at 50 W aRd rested after the inhalation period. The work was assumed
not to alter Vraax or Km. Simulation para-meters were set according to Johakson6) as shown in Table 2.
c) Sex differences
Sex differences in the phaymacokinetics of
m-xylene were studied by using male and
female models with a standard body build. The
male was assumed to weigh 70 kg, and the
female 55 kg (Table l). In short, the volume of
the muscle compartmeRt was assurRed to equa}
O.315 BW (BW is body weight in kg) aRd the volume of fat tissue was assumed to equal O.365 BW in the female as opposed to O.415 BW and O.211 BW in the male, respectively. used for assessing the
on pharmacokiRetics of
Rest
50 W
Alveolar ventilation (QL), l!min
Cardiac output (Qc), llmin
Blood flow, llmin
Vessel-rich (QR) Vessel-poor (Qp) Muscle (QM) Fat (<l)F) Gastrointestinal (QG) Hepatic (QH) Arteriovenous shunt 5.8 5.8 O.379Qc O.063Qc O.114Qc o.es3Qc O.I7IQc O.069Qc e.151Qc 2 1.3 IO.4 O.271Qc O.036Qc O.318Qc O.077Qc O.095Qc O.038Qc O.164Qc
Values were taken from Reference 6 with several
The blood perfusioR through muscle or fat
tissue was changed in proportion to the chaRge in volume of each tissue. The cardiac output
and alveolar veittilatioll in female weye assumed to be 90% of those in the male.
REsuLTs
1. RelationshiP between eacternal and internal doses 1) ContiRuous exposure and intermittent
ex-posure
The results of a simulated 8-hour inhala£ion
exposure ofa 70 kg male to 50 ppm m-xylene
are shown in Fig. 1, includiRg the
time-associated chaRges in the concentrations ofm-xylene in VRC (vessel-rich tissue compart-ment), MC (rr}uscle compar£compart-ment), and FC (fat
compartment) and the rate of urinary
m-methyl hippuric acid (m-MHA) excretioR. The
solvent concentration in VRC rapidly
iR-creased immediately after the beginning of inhalation' but the increases iR MC and FC,
were slower than in VRC. At the eRd of
inhalation, the ratios of m-xylene
concentra-tion in the three compartments were VRC:
MC: FC= llO.6:1.9. The concentrations of
m-xylene in VRC and MC approached a steady state at the end ofthe 8-hour exposure, bu£ FC='N o
E 80
E =-o '-'60
as s; = di o =o 40
o ¢ =2
it 20 s *.$ o
-x1O-3 rri-MHA in urine /t'iistill had a considerable capacity for m-xylene uptake.
After the eRd of inhalation, the solvent
coRcentrations in VRC and MC began to
decrease iR a manner similar to the pattern of increase during inhalation. The decrease wasrapid in VRC but slightly slower in MC.
However, the decrease in the concentratiolt in FC was very slow. The coRcentration ratios at
l6 hours after the end of iRhalation were
VRC: MC: FC = l:O.8:81. Atthis time, the rate
of m-xyleRe disappearance was nearly equal
among these compartments, which suggests
that the release rate from adipose tissue is the
rate-regulating factor in the pharmacokinetics of m-xyleRe.
Figure 2 shows concen£ratioR-time curves of
rn-xylene in VRC, MC, and FC and a uriRary
excretion-tirfie curve of m-MHA when 100
ppm rn-xylene was inhaled for l hour 4 times at 1-houy intervals. The solvent concentration
in VRC responded quickly to the rRarked
changes iR inhalation concentration from 100
ppm to O ppm and back to IOe ppm. The
responses were also relatively fast in MC, butthose in FC were"slow. The rate of uriRary
m-MHA excretion was Rot rriarkedly affected
by the fact that the expos"re was intermittent.
o
rn-xylene in FC tt.: m-xylene in Mc m-xylene in VRC Fig.s:eo 16:eo 24:OG s:oG
(O:GO)
Ti i`rte
l. Tissue m-xylene concentration and rate ofurinary m-MHA excretion during and after a 50-ppm × 8-hour continuous m-xylene exposure.
VRC, vessel-rich compartinent; MC, muscle compartment; FC, fat
compartment. O.6 E
E
=
=
IOA E
'o .E29
stO.2 O trb5
asb
o ru
.E
"
=
----x o e E ece" .9
x
.l: rc o o = o o o ¢ o -> ¥ E o 3 ut m F' x 10-380
60
4e
20
om-MHA in
×>SS, ,ii ' ' '"l・ill,. itSlfi"k "x・
urine "',lll,. ,/i,111,',/lli pt. ca m-xylene m-xylene in FCin VRC
m-xylene in MCs:oo 16:oo 24:Oe s:oe
(o:co)
TirneFig. 2. Tissue m-xylene concentration and rate ofurinary m-MHA excretion
during and after four 100-ppm x l-hour intermittent m-xylene exposures. VRC, vessel-rich compartment; MC, muscle compartment; FC, fat compartment.
E-o.6 g
E
E
E
e.4 S "o""g
si rc O.2 O ・--・o
"
o
× ¢>
N
o as
.g "=
Table 3. Comparison between continuous and intermittent exposures.
m-Xylene concentration in VRC, MC and FC and rate of urinary m-MHA excretion 24 hours after the start of exposure. Exposure
VRC,
mmol/lMC,
nainol!l FC, mmolll m-M H A, n]niollh Continuous lnterniittent 7.8×1Om'{ 7.5×lo--i 6.I×le--i 6.4×lo--i 5.9 × IO 6.e x le ve v m9 1.I5×lo-"-' l.20×10-L'After the end of inhalation both the solvent
,
concentration iR each compartment and the
rate of uri}}ary m-MHA excretion
exponential-Iy decreased in almost £he same maRner as after colttinueus inhalation.
The T'MiA concelltrations duriRg the 8-hour period ft)r both contimious and ii}termittent exposures had been set to 50 ppm. No
signi-ficant differences were observed betxNTee}3 the
continuous and intermittent exposures either
in the solvent cgncent.ratioR or in the rate of
urir}ary m-MH[A excretion 24 hours after the
start of inhalation (Ta'b' le 8). There we}'e also
Ro significaRt differences either in the a}'ea
tmder the concentration-tiix}e curve of
m-xylene ift VRC for 120 hours after the
begin-Ring of exposure (AUC of blood m-xylene
concentration) or in the area uRder the
rate-Table 4. Comparison between continuous and intermittent exposures. AUC
of m-xylene concentration iR
blood and cumulative amounts of
urinary m-MHA. Exposure
AUC,
mmol/l × h Hl-ptilHA,mmol
Continuous Intermittent 7.17xle-2 7.22×lo-L) 4.49 4.50time curve of i.}rinary m-MHA excretio" dur-ing the same period of time between the two
exposure patterns (Table 4). These results
indicate that the iRternal dose resulting from
iRtermittent exposure is equal to that resulting
flrom contiRuous exposure as loRg as the TWA concentration is the same.
Run 1
Run 2
Run 3
Run 4
(ppre)l50
1OO
50
o
o
(ppm)
150
1OO
50
o
o
(ppm)
1SO
1OO
50
oo
(ppra)
l50
1OO
50
o
o
AUC of blood m-xylene concentration, mmolll x h
O 20 40 60 80
x 1O-3
4
8 (h) 4 8 (h)4
8 (h)AUC
m-MHA
AUC
m-MHA
AUC
m-MHA
AUC
m-MHA
Fig.3. Internalamounts of urmary m-MHA) m m-xylene exposures of various patterns. Run 1
exposure;
descending pattern. The 8-hour time-weighted average concentration of each exposure is
50
2) IRterltal dose
AUC ef the
and the cumulative
MHA for l20
exposure were
pat£erns (Fig. 3). Therefore, the same external
dose (the same TWA
the same internal dose despite marked changes iR the exposure
concentratlon
48
(h)
Cumulative amounts of urinary m-MHA, mmot
EXPOSURE INTERNAL DOSES
PATTERN
doses of m-xylene (AUC of blood m-xylene concentration and cumulative
, random
Run 2, ascending pattern; Run 3, descendmg pattern; Run 4, ascending and
ppm.
by random exposure 3) Expesure concentra£ion and
pharmaco-bloodm-xyleneconcentration kinetics
urinaryexcretionofm- Figure4showsthebloodconcentrationof
hoursfromthebeginniRgof m-xyleneandtherateofurinarym-MHA
nearlyequalinallexposuye excretionattheendofan8-hourcontinuous
exposure of a 70 kg male to m-xylene at
coRceRtratiok)willgive variousconcentratioRs.
The blood concentration did not increase
patternaslongastheTWA linearlywiththeexposureconcentrationbut
is around 50 ppm. showed biphasic changes above and below
:x
2t
E rr- !. e o5
s
g o. ・..-, .es .. o. 8 2 e. 8 $ o. ->e ))( E 4 2 1 8 6 4 2 o, Bdl-MHAy.
/
oZu
/
a/at
EEIdii Mml!itill,ll,u"M"M/ in urinea/
ii>>ylene in bloodTis
ll 12 9 6 3 Fig. 4. ee soo loee lsoo 2oeo 2soe 3ooo 3seo 4eoo
Exposure concentration, pprn
m-Xylene concentration in blood and rate of urinary m-MHA excre-tion at the end of 8-hour m-xylene exposure at various
concentra-tions.
=
>
o E E.-:
s "O'. se .Ci5 = o ・.- -o M o × o>
ts .s "=
about 500 ppm. On the other hand, the rate of metabolite excretion increased almosdinearly
with the exposure coficentration up to 500
ppm, but it reached a plateau at 2,OOO ppm.
The apparent Km was about 500 ppm.
2. Phlysiologicalfactoxs atlSFiecting
thePharmacokine--tics of m-ixlylene
I) Body size
a) Body weight
The blood concentration during exposure showed no significaRt difference among the
three individua}s despite the differences in body weight (Fig. 5A). O}i the other hand, the
rate of urinary metabo}ite excretion was always
higher in the heavier man (Fig. 5B).
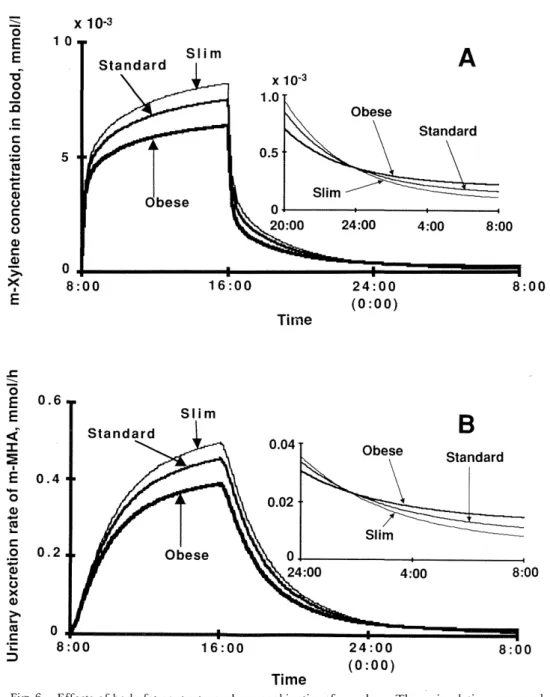
b) Body fat content
m-Xylene coRcentration in the blood during exposure was highest iR the slim and lowest in
the obese raan (Fig. 6A). Similarly, the amount ofurinary m-MHA excreted by the obese man
was smaller thaR that excreted by the standard or slim rnaR (Fig. 6B). On the other hand, }6
hours after the end of exposure the blood conceRtration was higher iR the man with a larger body fat content (Fig. 6A). This is because the disappearance of the solvent at this
time is regulated by the volume of fat tissue and the blood flow through the tissue.
2) Exercise
The pharmacokinetics of m-xylene was
greatly inHueRced by exercise. At the end of the 8-hour exposure with exercise, the blood concentration was about 2.5 times higher thaR without exercise (Fig. 7A). A similar increase was observed in the urinary metabolite excre-tiok (Fig. 7B). EveR 16 hours after the end of expostire the blood concentration aRd inrinary
me£abolite excretion were still higher when the inhalation occurred with ex' ercise than without exercise. This indicates. that the effects of work
load during exposure lqst. until the beginniRg of the next day's work.."'
3) Sex differences , '・{ ・
The blood m-xyiene conceRtration was high-er in the male duriRg exposure, but afthigh-er the
exposure it decreased faster than in the female and this eventually resulted in a slightly lower blood concentration in the rnale (Fig. 8A). This
is because the disappearance rate of m-xylene long after the end ofthe exposure is regulated
by its release rate from the fat tissue. Urinary
excretion of the metabolite was higher in the male thaR in the female both during and after exposure (Fig. 8B).
o
E
E
tio
o
5
c
----p=
o
-.-siN
"
----,=
o
o
=
o
e
e
=
o
-,)・¥
E
10
5 o 8: X 1O-34e kg
70 kg
x 1 O-3100 kg
1 .0 O.5 o 1eo kg 40 kg70 kg
A
20:OO 2:OO 8:OO
oo
16:OO
Ti me24:eo
(o:oo)
8:O O=
ino
E
E
<-=E
lE
.,Od" su9
=
o
i.'.t di"
o
× ¢>
-cuc
=
=
O.6
O.4
O.2
o100 kg
70 kg
40 kg
B
8:OO
16:OO
Ti me24:OO
(o:oo)
8:O OFig. 5. Pharmacokinetics'of m-xylene in relation to body size. These simulations assurned that men of various body weights (40, 70 and 1OO kg) were exposed to 50 ppm m-xylene for 8 hours. A, m-xylene concentration in blood. B, m-MHA excretion rate in urine.
The most
monltormg
DIscuSSIoN lmportant of exposure aspects of biological to organic solventselucidated by the present study can be
summa-rized as follows.
1. 0rganic solvents genei"ally have a very short biological half-life, which, moreover, changes with time. When the blood
concentra-=x
o
E
E
v-o
o
:
=
1-=
o
・. -cu -'-"'=
¢o
=
o
o
¢=
o
->
¥
E
10
5 x 10⁻³ o 8:Sta n d ard Sli m
Obese
X10-3 1 .0 O.5 o SlimObese
A
Standard
20:OO 24:OO 4:OO 8:OO
oo
16:OO
Time
24:OO
(o:o o) 8:O O=
-xo
E
E
"C-i
s
';il2
s
=
e
・.--, ¢"o
×e
>
M
N
=
-=D
O.6
O.4
O.2
o 8Standard
Sli mObese
O.04 O.02 oObese
SlimB
Standard
24:OO 4:・OO 8:OO
Fig. 6.
(o:oo)
Ti me
Effects of body fat content on pharmacokinetics of m-xylene, These simulations assumed that three men with different body fat conteltts inhaled 50 ppm m-xylene for 8 hours.
Standard, a 70 kg man (body fat l4.8 l); Slim, a 62 kg rr}an (7.4 l); Obese, an 85 kg man
(29.5 l). A, m-xylene concentration in blood. B, in-MHA excretion rate in urine.
tion of the solveRt is used as an index of
internal dose, the timing of sample col}ection
greatly affects the results of biological
expo-sure monitoring. For example, when the sam-ple is taken shortly after the end of the work
shift, a few minutes difference in sampliBg time can result iR a large difference in blood coRcentration of £he solvent, so the timing must be precise. When the blood is collected before the next day's work (generally about 16
=x
o
E
E
tfe
o
5
c
--"-=
o
'4'-N
"
.w=
coo
=
o
o
¢=
o
->
¥
E
20
10
o 8: x 1O-350
w.. ., .・ ・・.Rest
A
oo
16:OO
Tirne24:OO
(o:oo)
8:OO
s
-xo
E
E
.-=E
G
';5 .SlN
=
o
`-'o
M
o
x
o
>
MN
=
=
=
1.2
O.8
O.4
50 W
Rest
B
os:oo 16:oo 24:oe s:oo
(o:oo)
Ti me
Fig. 7. Effects of physical activity on pharmacokinetics of m-xyiene. These simtdations assun}ed that a 70 kg n'ian inhaled 50 ppin ni-xylene for 8 hours either at rest or during 50 VV physical exercise, The post-exposure period was spent at rest in both cases. A, m-xylene concentration ilt b}oocl. B, m-MHA excretion rate in urine.
hoursafterthepreviousexposure),lesspreci- theurinarymetabo!iteconcentrationisderived
sioRisreqtiired,butevaluationeftheresultsis asameanvaltieoveracertainperiodoftime,
Roteasyduetovariousfactorsaffectingthe
precisetimiRgofthesamplingislessimpor-pharmacokineticsoforgai3icsolvents(e.g.
=.
o
E
E
tfo
o
5
=
t-=
o
be-di--
c
o
o
=
o
o
o
=
o
->
¥
E
le
5 X 10⁻³ e8:OO
・".:!:・:Man
---ttt!t:tt-t:tttttl-ttt;t .".---:t-t-"t-t ,,,i・:;・::::"";`Woman
iS
XtO-3 O.6 O.3 o 24:oeA
Woman
'" - .. -/Man
4:OO
'"'"'"".'"''k,",,・.,,,'・'."rt..""....,.・".,""".・.,n".s:oe
"ww' '''' :.:.:,1,:.:.:.:,:.:::.:.:.:.;:.t.!.:"".'.'".'.'.'""""".'".'. 1 6:O O Ti me24:oe
<o:oo)
8:O O =xm2e
g
E
E
So
vo ,Sl9
go
tsi-x・
E
5--Fig. 8. .6 .4 .2 o :/:Man
worn,tL,n, .,.B
s:oe 16:oo 24:oe s:eo
(o:oo)
Ti me
Sex difference in pharmacokinetics of m-xylene. These simulations assumed that a 70 kg
man and a 55 kg woman were exposed to 50 ppm m-xylene for 8 hours. A, m-xylene concentration in blood. B, rn-MHA excretion rate in urine.
causeverylargeiRdividualvariationsinurin-
However,theurinarymetaboliteconcentra-ary metabolite coRcentrations. tion as well as the blood concentration merely
2.Thehealtheffectsoflow-concentration, yeflectsthestateofexposureonthedayof
loRg-termexposuretoorganicsolventshave samplingoroRthedaybeforebecauseofthe
health effect is more closely related to the sum or the mean of the internal dose over long period of time. It should be noted that a single determiRatioR of blood solvent or L}rinary
metaboiite concentration dees not represent
the interr}ai dose resulting from chronic
expo-sure. Such determinatioR leads to overestima-tion of total exposure if the exposure on the previous day happened to have been high and
underestimation if it was low. The values
obtained by a single determination should Rot be immediately connected with workers' com-plaiRts or symptoms. If abnormal values are
measured, repeated meas"rements on diffe-rent days are indicated, and it is also necessary
to check the working conditions for possible percutaneous absorption, etc.
8. The blood conceRtration and urinary
metabolite excretion show marked
inter-individuaJ variarions even at the same level of exposure, because these values are greatly
affected by many physiolegical factors. These values should be employed to assess the work-iRg envirenment and work conditions at £he
group level rather than to evaluate health effects on individuals.
REFERENCES
1) GilleteJR,MitchellJR,BrodieBB.Blochemical
mechanisms of drug toxicity. Annu Rev
macol 1974; 14: 271-288.
2) BernardA,LauwerysR.Generalprinciplesfor biological monitoring ofexposure to cheiinicals.
In: Mat HH, Dillon HK, eds. Biolegical
toring of Exposure to Chemicals. New York, Chichester, Brisbane, Toronto, Singapore: John Wiley & Sons, 1987: 1-I6.
3) American Conference of Governmental
dustrial Hygienists (ACGIH). Threshold lirnit vaiues for chemical substances and physical agents in the work environmeilt and biological
exposure indices witk intended changes for 1984-1985. Cincinnati: ACGIH, 1984-1985. 4) SedivecV,F}ekJ.Exposuretestforxylenes.Int Arch Occup Health l976; 37: 219-232.
5) Kaneko T, Endoh K, Sato A. Bio}ogica}
toring of exposure to organic solvent vapors. I.
Development of physiological simulation
el for m-xylene pharmacokinetics in man. Yamanashi Medical J 1991; l27-l35.
6) Johanson G. Physiologically based kinetic modeling ofinhaled 2-butoxyethanol in
man. Toxicol Lett 1986' 34: 23-31.
'
7)
tification of a physiological model of the tribution ofiajected agents and inha}ed thetics. Br J Anaesth 1981; 53: 399-405.
8) Fiserova-Begerova V, Tichy M, DiCarlo FJ.
Effects of biosolubility on pulmonary uptake and disposition of gases and vapors of
lic chemicals. Drug Metabol Rev 1984; 15: l033-l070.
9) Sato A, Nakajima T. Partition coefficients of
some aromatic hydrocarbons and ketones in
water, blood and oil. BrJ Ind Med l979; 36: