[ケニアの合同臨地訓練]
Prevalence and risk factors of malnutrition
Kariuki FN
1), Monari JM
2), Kibui MM
3), Mwirichia MA
4), Zani KK
5),
Tetei M
6), Aikawa R
7), Waihenia E
8), Osaki Y
9)特集:合同臨地訓練
1)Department of Community Nutrition, MTC Karen
2)Department of Environmental Health Sciences, MTC Nakuru
3)Department of Environmental Health Sciences, MTC Nyeri
4)Department of Nursing, MTC Meru
5)Department of Environmental Health Sciences, MTC Matuga
6)Computer Supervisor, KMTC, Nairobi
7)Long term Nutritionist expert KMTC/JICA Nairobi 8)Department of Nutrition, MTC Karen
9)Short term expert, Tottori University, Japan
Kenya Medical Training College, P. O. Box 30195 Nairobi, Kenya
Tel. 725711/4, Fax 722907, E-maill kmtc@nbnet.co.ke
Abstract
Objective: to assess the prevalence and risk factors of malnutrition of children 6 to 23 months. Design: a cross-sectional study was done in Kibera an urban slum in Nairobi, Kenya. Cluster and
random sampling methods were used. A sample size of 353 children and their mothers was targeted. A structured questionnaire was administered to parents and caretakers to obtain information on social economic status, immunization status, growth monitoring, morbidity, breastfeeding and weaning practices. Anthropometrical measurements of weight and length were conducted in order to get those children who were undernourished. The equipments used were Salter scales and supine length boards respectively. 132 children aged from 6 to 23 months participated in this study. The three categories of nutritional stunting, wasting and underweight were used as indicators of nutritional status for the children. The study took place from 13th to 18th October 1999.
Main outcome measures: nutritional status data was compared with National Centre of Health
Statistics (NCHS) references and presented as Z-scores with cut off point of -2 SD using indicators of weight for age, weight for length and length for age to get those children who were underweight, wasted and stunted respectively. The analysis of this study focused on stunting because it's the best indicator for chronic malnutrition.
Results: The anthropometrical data revealed that malnutrition is a public health problem in Kibera.
34.6% of the study children were stunted, 6.2% wasted and 26.5% underweight. 97(73.4%) children in the study area were sick two weeks prior to the study. The study revealed a significant relationship between stunting and morbidity. Having children at an early age may be a risk factor to nutritional stunting as shown in this study. 50% of children whose mothers were between 15-19 years were stunted. The risk decreased with the increase of age of the mothers, as the percentage of mother over 25 years who had stunted children was 30%. Large households with more than 5 people had more stunted children compared to households with less than 5 people.
No association was found between stunting and education of the mother, mother's income, frequency of feeding, time weaning started and length of breastfeeding.
Conclusion: Malnutrition is a public health problem in slums. This study suggests that mothers below
20 years are not fully prepared for motherhood. Maybe there is household food insecurity in large households causing malnutrition of children in slums. High morbidity among children maybe due to delayed diagnosis and treatment of ailments.
Key Words: Food security, Nutritional Assessment, Anthropometrics, Malnutrition, Slums, Household size, Early pregnancy
Introduction
Malnutrition is one of the most serious world health problems. Globally 67 million children are estimated to be wasted and about 18 million weight less than they should for their age. Over 200 million children under five years in developing countries die each year and half of the deaths is due to malnutrition (1). The most prevalent form of malnutrition in Kenya is Protein, Energy malnutrition (PEM). The term PEM is used to describe a broad array of clinical conditions ranging from mild malnutrition mainfesting itself in poor growth to the serious type of kwashiorkor and marasmus which have high cases of fatality rate. Children with mild or moderate malnutrition do not have any clinical signs but are shorter or thinner for their age. Such children are at risk of becoming severely malnourished. The consequences of malnutrition on the quality of life of a child and the cost of rehabilitating malnourished children calls for investing in programmes that prevent the problem of malnutrition. Mild or moderate protein energy malnutrition is diagnosed by taking anthropometrics measurements of weight and height/length (2,3)
In Kenya, chronic malnutrition is the most common form of malnutrition. 34% of children below five years are stunted while 8% and 23% are wasted and underweight respectively (4). This is approximately 1.5 million Kenyan children under 5 years. The situation could be worse due to increased poverty and declining access to basic health care (5). Because of the serious consequences of malnutrition on child's growth, health, and economic consequences for the nation, nutritional status of children should be assessed periodically to monitor the situation and appropriate action taken to combat and prevent malnutrition. In Kenya, malnutrition has been assessed every five years since 1997 by the government. The results from these rural child surveys have shown malnutrition to be a major public health problem. Theme number one in the national plan of action for nutrition is assessing and monitoring nutritional situations (6). The 1990 world summit for children adopted a number of goals for children and one of them was reduction of both moderate and severe protein energy malnutrition in children under five years by half of the 1990 levels over the 1990-2000 period. Kenya decided to set a modest but achievable goal of reducing malnutrition by 30% of its 1992 level (7).
Immediate causes of malnutrition are inadequate food intake and infections. The underlying causes of malnutrition are many and some of the cited causes are
poverty, poor feeding practices, poor childcare and poor sanitation. These causes are interlinked and a multi-sectoral approach should be used to address the problem of malnutrition.
Policy makers to formulate appropriate interventions will use the results of this study. Other researchers may use the results for new knowledge and fill gaps. The objective of the study was to assess the prevalence of malnutrition and identify the risk factors.
Materials and methods
This study was conducted in Kibera a slum area, 6km away from Nairobi City center, capital of Kenya. Kibera slum has 9 villages and it’s the largest in Kenya occupying an area of 4 square kilometers. Kibera population is estimated to be 500,000 people. The study was conducted in Siranga village, which is situated 2 km from the main road. The houses are semi-permanent and most of the residents are tenants. The main road is good but the feeder foods are poor and not accessible during the rainy season. There is a government health center 5km away but the area also has many private clinics and practicing herbalists. Tapped water is available but expensive for the residents who have to buy water from vendors.
A cross-sectional design was used to study a group of 132 children aged 6 to 23 months. The interviewers were a nutritionist and other ancillary health workers undergoing community based research project in KMTC. Structured questionnaires both in English and Kiswahili be local language, were revised and amended to ensure uniformity in asking the questions.
A structured questionnaire was used to interview parents and caretakers on morbidity, immunization status, socio-economic status, weaning and feeding parctices of the children. A 24-hour dietary recall was conducted to get information on the quality of the diet and frequency of feeding.
Undertaking of the survey was from 13th to 18th October 1999 at dwellings of Siranga. Cluster sampling procedure was used to identify dwellings and households units were randomly selected. The guide and interviewers zoned dwellings and identified the center of that to be studied. A pen was spanned to identify the direction to follow. On reaching the end of the village the spinning was done again to continue until the survey was completed. The response rate was 99%.
Anthropometrical measurements of weight and length were taken using Salter scales and length boards respectively. The researchers took the measurements in pairs to ensure data quality control. Mothers gave the
ages of their children and this was validated with the child health card.
The sample size was calculated using the guidelines for Nutrition Baseline Surveys in Communities (8). Prevalence of National stunting, which is 34%, was used to calculate the required sample size (4).
Collected data was cleaned and sorted in Microsoft excel computer programme before analysis. Data was analyzed by appropriate tabulation and subjected to statistical tests, simple tables, percentages and figures.
Nutritional status data was compared with National Centre of Health Statistics (NCHS) references and presented as Z-scores with cut off point of -2 SD as recommended by WHO using indicators of weight for age, weight for length and length for age to get those children who were underweight, wasted and stunted respectively.
Nutritional status was evaluated by comparing how these anthropometrics indices deviated from the reference population (2,3).
In this study the following definitions were employed for the nutritional indices:
1.Underweight means a low weight for age. This is a weight below -2SD of reference population. 2.Stunting means a low length for age. This length
below -2SD of reference population. Stunted children are of low stature than children of the same age.
3.Wasting means a low weight for length. Children are lean and below -2SD of reference weight for
length. Weight for length is a measure of wasting for children who cannot stand and supine length is measured.
“Malnutrition” is used to mean under nutrition in this study. Inadequate intake of energy and nutrients, which hinders proper functioning of the body leads to protein energy malnutrition.
Results
The socio-demographic characteristics of the study units showed the following: The number of the mean household members was 4.7, the mean age of children was 22 months and the average number of children per household was 2.4.
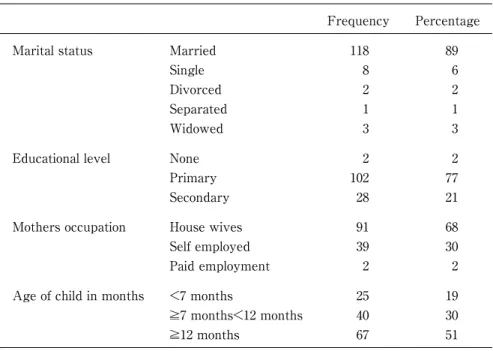
Most mothers were housewives (68%). Majority of the mothers were married (89.4%). The average age of mothers was 24 years. 61 boys and 71 girls participated in this study. Mothers with primary education were 77%. 21% had attained secondary level education. The rest had little education or no education at all. Children who were not being taken for growth monitoring were 47%. Most mothers were of low income as 74.2% earned less than 1000ksh per month. 68% of mothers were housewives, 30% were self employed and 2% were in paid employment. Ages of study children revealed that the majority of study children were over 12 months (50.8%), 7-11 months 30.3% and less than 7 months 18.9%. Table 1 shows the socio economic characteristics.
The anthropometrics data revealed that malnutrition is a public health problem in Kibera. Overall 34.6% of the
Frequency Percentage
Marital status Married
Single Divorced Separated Widowed 118 8 2 1 3 89 6 2 1 3
Educational level None
Primary Secondary 2 102 28 2 77 21
Mothers occupation House wives
Self employed Paid employment 91 39 2 68 30 2
Age of child in months <7 months
≥7 months<12 months ≥12 months 25 40 67 19 30 51
study children were stunted, 6.2% wasted and 26.5% underweight. Table 2 shows the distribution of malnourished children by nutritional status indicators.
There is high morbidity rate of young children in Kibera. 97(73.4%) children in the study were sick two weeks prior to the study. The study revealed a significant relationship between chronic malnutrition and morbidity. Table 3 shows that there is an association between illness and malnutrition.
More children in large households (households with more than 5 people) are likely to get malnourished than children in small households (households with less than 5 people). The results of the study revealed that 52% of the study children in large households were stunted as compared to 30.5% in small households. Table 4 shows that there was a significant association between household size and nutritional stunting.
Having children at an early age may be a risk factor to nutritional stunting although it was not significant as shown in this study. 50% of children whose mothers were between 15-19 years were stunted. The risk decreased as age of the mother increased. The percentage of mothers over 25 years who had stunted
children was 30%. Table 5 shows the relationship between the age of the mother and malnutrition.
There was no significant relationship found between stunting and eduction level of the mother, mother’s income and sex of the child, breastfeeding frequency, age weaning introduced, immunization status or frequency of feeding. Table 6 shows feeding practices and health seeking characteristics.
The study revealed that most mothers have almost similar feeding practices. 79% of the mothers were breastfeeding on demand and only 1% never breastfed at all. The length of breastfeeding reduced with the age of the child. By the time the children were 19 months, only 1% were breastfeeding. The two main reasons given for early cessation of breastfeeding were child refusal to breastfeed and the mother being sick. No significant association was found between frequency of breastfeeding and chronic malnutrition. Many children (63%) were weaned earlier than the recommended age of 4 to 6 months. Majority of mothers fed their children frequently, as 126 mothers fed the children 4-6 times per day, although 81% did not balance the food to provide all the necessary nutrients. The quality of the diet was poor as revealed by the 24-hour dietary recell. Children who were not being taken for growth monitoring were 62 (47%). The immunization coverage in the study area was 79%.
Discussion
Malnutritions is prevalent in Kibera as reported. In a well-nourished population, 2.3% of children are expected to be below a cut-off point of -2SD of the well-nourised reference population. Nutritional stunting in Kibera is 15 times higher than that. Results of this study compares well with the fifth national nutrition survey (4) which reported stunting level of 34%, wasting 8% and underweight 22.5%. The Kenya demographic and health survey of 1998 estimated chronic malnutrition to be 33%, wasting 6% and underweight 22% (10). The malnutrition prevalence levels for Nairobi and Stunting 30.2%, wasting 5.5% and underweight 22%(4).
In Kenya, chronic under nutrition is the most common
Indicators Total Servere Moderate %
Underwight Wasted Stunted 35 8 45 10 4 20 25 4 20 26.5 6.2 34.6
Table 2. Distribution of malnourished children by nutritional status indicators
Long Short No illness Chi-square P-value
Stunted Not stunted Total 18 33 51 16 31 47 11 21 32 10.33 P<0.05
Table 3. Distribution of Malnourished children by morbidity
Stunted Not stunted Total % χ2
P=Value > 5 people ≤ 5 people Total 13 32 45 12 73 85 25 105 130 52 30 4.13 P<0.05
Table 4. Distribution of malnourished children by household size
Maternal age Stunted Not stunted Total
Young (15-19yrs) Middle (20-25yrs) Mature (>25yrs) Total 9 20 16 45 9 40 37 86 18 60 54 132
form of malnutrition and this study endeavored to find out the risk factors of nutritional stunting in Kibera. Stunting and wasting show the level of socio-economic development of a country. Well-targeted interventions can reduce the problem (10). The Kenya demographic survey of 1998 suggests that the level of malnutrition has not changed since the 1994 nutritional survey except for underweight that has reduced by 2%(11).
Having children early was identified as a risk factor. Teenage pregnancies are socially disadvantaged. The girl- child who is 15-18 years is not ready to take care of another child. These mothers depend on others to provide for her needs and the others may be poor
especially in slums (12). They should be supported through community initiatives to take care of their children. They should also go back to school if they were dropouts. Older mothers have more experience in child care than young mothers and are likely to find solutions to their problems. This finding agreed with another study done in Tanzania to find out the determinants of nutritional status in a low income area in Tanzania (13). Another study still done in Tanzania also reported that maternal age was significantly associated with nutritional stunting (14). Strategies to delay motherhood should be sought and implemented.
This study reveals that most girls in slums do not go to seconedary school, probably due to lack of school fees and as a result the girls get children.
Findings of this study confirm that infections that last long are a risk for chronic malnutrition. The high morbidity in the area suggests that there is delayed diagnosis and treatment of infections in slums maybe due to poverty or ignorance of the consequences of untreated infections. The presence of many herbalists in the area suggests that traditional medicine is popular in Kibera. Malnutrition and disease are co-factor and form a vicious circle. Infections make malnutrition worse and poor nutrition increases the severity of infectious diseases. Infections have negative effects due to increased metabolism, reduced nutrient intake and direct loss through diarrhea and vomiting. Malnutrition weakens the immune system predisposing malnourished children to disease (15). The high prevalence of underweight in Kibera could have been due to the high morbidity reported. The study in Tanzania mentioned above supports this, as parasitics infections and diarrhea are prevalent in poor communities especially in slums. The environmental sanitation is poor and although tapped water is available, it’s expensive for the residents. Several studies have shown that diarrhea precipitates serious protein energy malnutrition.
There is one government health facility in the area, which is 5km away. A health facility within 6km of persons home is said to be accessible (11). There was an association between stunting and household size. Majority of monthers in the study had few children but some households were large because of relatives from the rural areas. The extended family members maybe jobless and hence dependent on the host for food and upkeep. An old study in Philippines in 1969 reported that intake of energy and protein reduced with increase in size of household (17). Children are vulnerable in such households if there is household food insecurity. It could also be due to increased workload of a mother attending
Frequency Percentage A. Breastfeeding <7 months >6<11 months On demand Not applicable 21 1 85 25 16 1 64 19 B. Age weaning introduced
0-2 months 3-4 months 5-6 months 7-8 months 9-10 months 33 50 13 9 3 25 38 10 7 2 C. First solid foods introduced
Porridge Mashed banana Cereal Ripe banana Eggs 74 37 1 6 9 55 27 1 5 7 D. Frequency of feeding 1-3 times 4-6 times >6 times 5 126 1 4 95 1 E. Quality of foods Balanced Not balanced 25 107 19 81 F. Immunization coveragae Complete Incomplete Under age 79 21 32 60 16 24 G. Growth monitoring Being undertaken Not being undertaken
70 62
53 47
to the needs of a big household at the expense of the welfare of the young child. It is difficult to deal with the problem since it's social norm to allow relatives to stay.
Although there was no association between stunting and age weaning was started, inappropriate timing for introducing breast milk supplements to a child may affect his/her nutritional status. Introduction of the supplements before the age of 3 months especially under unhygienic conditions could be an important cause of diarrhea and therefore a cause of malnutrition (16). This study showed that the children did not consume food with all the necessary nutrients. This agreed with a study done in the same slum but in a different village by university of Nairobi students, Department of Applied Nutrition in 1998, which showed that children below 5 years received inadequate amounts of energy and protein. Children who are fed with diets that do not meet the Recommended Dietary Allowances for energy and nutrients over a long period will definitely suffer from protein energy malnutrition regardless of whether they are fed frequently or weaned at the right time (15). The food given to the children was mainly composed of cereal flours and starchy roots and tubers. This is probably due to shortage of fuel as most of them were using kerosene, which is quite expensive. They opted for foods that cook quickly.
Growth monitoring is useful in detecting growth faltering (17). This study found out that a sizeable percentage of mothers were not taking their children for weighing and this could have contributed to the high level of malnutrition since growth failure was not detected early for remedial action to be taken. Having growth monitoring centers within reach may motivate the mothers to take their children for weighing. Such centers can be multi-purpose for nutrition and health education. Community based growth monitoring has worked well where the community has been empowered to participate in improving its health and nutrition status.
Immunization coverage was low in the study area and below the national figure. Efforts should be put in place to improve coverage and thus protect children against killer immunization diseases. Immunization campaigns should sensitize the community on the issue.
Conclusion
Prevalence of malnutrition in slums is higher than the national average. Children born to teenage mothers are likely to get malnourished. Children in large households are at risk of under nutrition probably due to inadequate food intake. Malnutrition and disease are cofactors.
There are gaps either on knowledge or practice concerning child feeding.
This study was conducted as a Mid Level Manpower Training (MLMT) program as part of KMTC/JICA project (1999) and sponsored by JICA (Japan International Cooperation Agency).
Acknowledgements
We would like to acknowledge the efforts of every one who directly or indirectly contributed to the success of this project. In particular, we are extremely indebted to the Director of KMTC Mr. William K. Boit, JICA/KMTC coordinator, Ms A. Kimeu, JICA experts, Dr. Osaki and Ms. R. Aikawa, to all the lecturers, notably Dr. Nieru, Dr. Rakwar, Dr. Muthwii and Mr. Lukhando. We are grateful to Mr. Tetei, the computer instructor for his help. Special appreciation goes to the District Officer, Chief, Guides and the community of Siranga village for cooperration.
References
1.UNICEF. The state of the world’s children, Oxford University Press, New York, 1998.
2.United Nations. How to weigh and measure children. Assessing the nutritional status of young children in household surveys, New York (1986).
3.Beghin I et al. A guide to nutritional assessment. WHO. Geneva, 1988.
4.Fifth child nutrition survey, Central bureau of statistics, Ministry of Planning and National Development, Nairobi, (1994), (1996).
5.Kenya human development report, Government of Kenya, Nairobi (1999).
6.National plan of action for nutrition, Republic of Kenya, Nairobi (1994).
7.Kenya’s programme of action for Children in the 1990's Government of Kenya, Nairobi, (1992).
8.Gross R et al. Guidelines for Nutrition baseline surveys in Communities version1.2, Jakarta (1997).
9.Ngare DK, Muttunga JN. Prevalence of Malnutrition in Kenya, East Affrican Medical Journal 76: 376-380, 1999. 10.Demographic and health survey, Macro international Inc.
and council for population and development, Nairobi (1998). 11.UNICEF. A situation Analysis Children and women in
Kenya, Nairobi (1992).
12.Mbago MC, Namfua. Some determinants of nutritional status of 1 to 4 yuear old children in low-income urban areas of Tanzania. Journal of Tropical pediatrics, 1992. 13.Mugyabus LKJ, Masters Thesis University of Nairobi,
Nairobi (1995).
14.Latham CM, Human Nutrition in developing word, Rome (1997)
16.King FS, Helping mothers to breastfeed, AMREF, Nairobi (1985)
17.Den Hartog AP et al. Manual for social surveys on food habits and consumption in developing countries, Pudoc Wageningen, (1985).
18.Cameroon M, Hofvander, Manual on feeding infants and young children, (1990).