Modeling Software Project Monitoring with Stakeholders
7
0
0
全文
(2) In Proc. of the 9th IEEE/ACIS International Conference on Computer and Information Science (ICIS 2010), pp.723-728, August, 2010 (Yamagata, Japan). Modeling Software Project Monitoring with Stakeholders. Masateru Tsunoda, Tomoko Matsumura and Ken-ichi Matsumoto Graduate School of Information Science Nara Institute of Science and Technology Nara, Japan {masate-t, tomoko-m, matumoto}@is.naist.jp. Abstract—Recently, software size becomes larger, and consequently, not only a software developer but also a software purchaser suffers considerable losses by software project failure. So avoiding project failure is also important for purchasers. Project monitoring with a purchaser and a developer (stakeholders) is expected for the purchaser to suppress risk of project failure. It is performed by sharing software metrics during the project for the purchaser to grasp the status of the project. Although there are some software measurement models, they cannot describe two kinds of metrics which are used to monitor projects with stakeholders. One metric is to indicate project goal achievement after finishing project. The other one is to measure to progress toward the goal. In addition, the models cannot represent countermeasures when symptoms of project failure are found. We propose the model for project monitoring with stakeholders. The model is based on the measurement information model defined by ISO/IEC 15939, and added stakeholder’s goal, key goal indicator (KGI), key performance indicator (KPI), corrective action, and check timing. With our model, project monitoring with stakeholders can be described more rigorously. Keywords-risk management; measurement; stakeholder; plan-do-check-act cycle; notation. I.. INTRODUCTION. Recently, software size becomes larger, since software is used in various situations and needed for more functions. Consequently, not only a software developer but also a software purchaser suffers considerable losses when software project is failed (delay of delivery date, project cost overrun, or insufficient quality of developed software are occurred). So avoiding project failure is more important for purchasers than before. Project monitoring with a purchaser and a developer is expected to be effective way for the purchaser to suppress risk of project failure [10], especially when developer’s project management skill is insufficient. Project monitoring with a purchaser and a developer is performed by sharing software metrics during the project for the purchaser to grasp the status of the project. Besides in recent years, software developers outsource a part of software development to sub contractors (e.g. offshore developers in India or China) because of lack of human resources, or pressure of restraining software development cost. However, sub contractors’ project failure sometimes causes primary contractor’s project failure.. Project monitoring with a primary constructor (purchaser) and a sub contractor (developer) is also expected to be effective in the case. In this paper, we call a purchaser, a developer, a primary constructor, and a sub constructor as stakeholders. Appropriate model of software project monitoring with stakeholders is necessary to perform it rigorously. The model defines elements of project monitoring activities and their relationships. More intuitively, the model clarifies how to perform project monitoring. The efficiency of the model is similar to that of the entity-relationship model for database [3]. The model is required to describe project monitoring activities. Applying plan-do-check-act cycle, project monitoring consists of four activities, namely deciding which metrics are measured (plan), collecting values of metrics (do), analyzing values of metrics (check), and performing countermeasures based on the analysis (act). For instance, when “keep software quality high” is set as the project goal, code coverage is decided to be monitored on plan phase, it is measured on do phase, its value is compared with a reference value on check phase, and on act phase, modules are retested if code coverage is lower than the reference value. This is because low code coverage means testing is insufficient, and it causes remaining faults. Although there are some models for software measurement [4][11][13][15][16], the models are not enough to describe plan phase. Two kinds of metrics should be set to monitor projects with stakeholders in the plan phase, but the models do not explicitly represent the metrics. One metric is to indicate whether the project goal is achieved or not when project is finished. For instance, defect density (defect density = number of defects / program size) after release is used as the metric. Without the metric, it is difficult for stakeholders to agree to whether the goal is achieved or not. The other metric is to measure to progress toward the goal. For example, code coverage is used as the metric. Using the metric, a purchaser can understand status of project quantitatively in midstream of the project. In addition, the models cannot represent activities of act phase. For example, Chirinos et al. [4] proposed the software measurement model which defines elements such as type of metrics, range of value, and measurement method, but it does not include elements related to act phase. Description of activities of act phase is effective to derive the commitment of the developer that it surely performs countermeasures. It is expected to decrease risk of project failure..
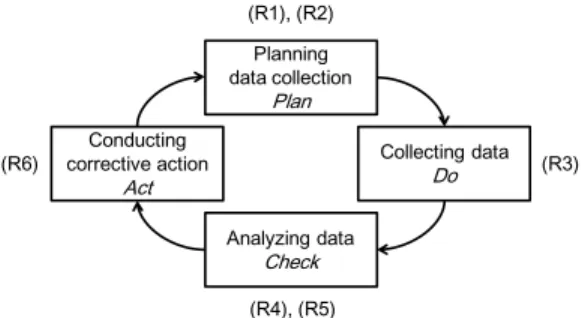
(3) In Proc. of the 9th IEEE/ACIS International Conference on Computer and Information Science (ICIS 2010), pp.723-728, August, 2010 (Yamagata, Japan) (R1), (R2). Planning data collection. Plan. (R6). Conducting corrective action. Collecting data. Do. Act. (R3). Analyzing data. Check. (R4), (R5). Figure 1. Plan-do-check-act cycle of project monitoring and requirements corresponding each phase.. We propose a new model for project monitoring with stakeholders. Our model is based on measurement information model, which is defined in ISO/IEC 15939 [11]. We added key goal indicator (KGI), key performance indicator (KPI), corrective action, and check timing to the model. The KGI and the KPI are used in the area of business management [18]. The KGI is a metric which indicates whether the goal is achieved or not. The KPI is a metric which indicates whether progress toward the goal is smooth or not. Corrective action explains how to act when KPIs show inadequate values. It is adopted from the Hazard Analysis and Critical Control Point (HACCP) [5], which is management system for food safety. Check timing shows when KGI and KPIs are checked by stakeholders. Effectiveness of our model is as follows. (1) is effectiveness for a developer (sub constructor), (2) and (3) are for a purchaser (primary contractor), and (4) is for all stakeholders. (1) Our model can be used as a template of the project monitoring plan. The developer can make a project monitoring plan more easily and more rigorously. (2) With the KPI, the purchaser grasps status of the project easily. (3) Corrective action derives the commitment of the developer that it surely reacts to issues which are observed by KPIs. (4) Stakeholders can agree the project monitoring plan more smoothly, because the plan made with our model explicitly describes how to monitoring the project. In what follows, Section II clarifies requirements for modeling software project monitoring with stakeholders. Section III explains structure of the model. Section IV shows an application of the model. Section V introduces related work. In the end, Section VI concludes the paper with a summary. II.. REQUIMENTS FOR MODELING PROJECT MONITORING WITH STAKEHOLDERS. We identify requirements for the model of project monitoring with stakeholders by seeing activities of it. Applying to plan-do-check-act cycle, project monitoring consists of four activities. In the plan phase, goals of project monitoring are set, and metrics which relate to the goals are identified. GQM (GoalQuestion-Metric) approach [1] is one of the methods to. identify the metrics. For example, “keep software quality high” is set as the goal, and code coverage and defect density are settled as the metrics. Additionally, to monitor projects with stakeholders, a metric which directly indicates whether the goal is attained or not is decided. For instance, defect density after release is set as the metric. Note that goals of each stakeholder are sometimes different. For instance, it is possible that “suppress development cost” is set as the goal of a developer, but it is not set as that of a purchaser, when software price is fixed by contract. In the do phase, metrics are collected with automated measurement tools or manual measurement, and stored. For instance, code coverage is measured by the measurement tool, and number of defects is manually measured in the testing phase. Some metrics are derived from several metrics. For example, defect density is calculated by dividing number of defects by program size (source lines of code). In the check phase, collected metrics are analyzed by comparison of reference values, some graphs, or mathematical models. Analysis results show process (e.g. testing phase) or products (e.g. source code) are normal or abnormal. For example, a value of code coverage is compared with a reference value, and when the measured value is lower than the reference value, testing is regarded as insufficient. To monitor a project with stakeholders, analyzing metrics is scheduled on particular timing. For instance, defect density on unit testing, integration testing, and system testing are checked at the end of each phase with stakeholders. In the act phase, when the results of the check phase indicate that process or products are abnormal, countermeasures are conducted. For example, when values of code coverage of some modules are lower than a reference value, they are retested. To describe project monitoring with stakeholders, a model is required to present: (R1) Goals of each stakeholder separately, and a metric which directly indicates whether the goal is achieved or not. (R2) Distinction between a metric indicating goal achievement and metrics indicating progress toward the goal. (R3) How to collect metrics. (R4) How to analyze metrics. (R5) Timing of analyzing metrics with stakeholders. (R6) Countermeasures to correct abnormal process or products identified on check phase. Fig. 1 shows plan-do-check-act cycle of project monitoring and requirements corresponding each phase. (R1), (R2) and (R5) are specified requirements for a project monitoring model with stakeholders. III.. STRUCTURE OF PROJECT MONITORING MODEL. The model of project monitoring with stakeholders is based on the measurement information model, which is defined in ISO/IEC 15939 [11]. The model defines activities of analysis and measurement with hieratical structure. The reason of adopting the model as a basis of our model is that the model satisfies requirements (R3) and (R4) stated in section II in just proportion..
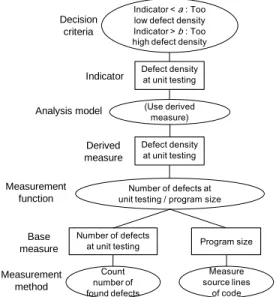
(4) In Proc. of the 9th IEEE/ACIS International Conference on Computer and Information Science (ICIS 2010), pp.723-728, August, 2010 (Yamagata, Japan) Indicator < a : Too low defect density Indicator > b : Too high defect density. Decision criteria. Indicator. (Use derived measure). Analysis model. Derived measure Measurement function. Base measure Measurement method. Defect density at unit testing. Defect density at unit testing. Number of defects at unit testing / program size. Number of defects at unit testing. Program size. Count number of found defects. Measure source lines of code. Figure 2. Structure of the measurement information model [11].. Fig. 2 shows the structure of the measurement information model and examples of the elements. In the example, number of defects at unit testing and program size are measured as base measures according to measurement methods. Defect density at unit testing is derived as the derived measure according to the measurement function. The indicator which is computed by analysis model is defect density at unit testing, and it is as same as derived measure in this case. Based on the decision criteria, it is settled whether defect density at unit testing is abnormal or not. Fig. 3 illustrates the structure of the model of project monitoring with stakeholders using the UML (Unified Modeling Language). The model has hieratical structure in the same way as the measurement information model. Stakeholder’s goal, key goal indicator (KGI), key performance indicator (KPI), check timing, and corrective action are added to the measurement information model. The KGI and the KPI inherit characteristics of the indicator. Lower layer than the analysis model is same as the measurement information model, so they are omitted in the figure. Detail of each element is explained below. A. Stakeholder’s goal Stakeholder’s goal represents an aim which a stakeholder intends to attain through project monitoring. When monitoring project with a purchaser and a developer, stakeholder’s goal is called purchaser’s goal or developer’s goal. In the same way, when monitoring project with a primary contractor and a sub contractor, stakeholder’s goal is called primary contractor’s goal or sub contractor’s goal. This element is defined to satisfy requirement (R1). Concept of stakeholder’s goal is almost same as the goal of GQM. The goals are written by plain text. They can also be written by the goal template proposed by Fuggetta et al. [6]. When applying the model, at least two stakeholders’ goal is needed. For instance, when monitoring project with a purchaser and a developer, at least one purchaser’s goal and one developer’s goal are set. It is possible that goals of. Figure 3. Structure of the model of project monitoring with stakeholders.. different stakeholder are same. For example, stakeholder’s goal is set as follows: Purchaser’s goal and developer’s goal-1: keep software quality high. Developer’s goal-2: suppress increasing of software cost. In this case, purchaser’s goal and developer’s goal-1 are same. B. Key goal indicator The key goal indicator (KGI) is a metric which indicates whether the goal is achieved or not. With a KGI, stakeholders consent to final status of the goal. This element is defined to satisfy requirements (R1) and (R2). Originally, The KGI is used in the business management area [18]. The KGI is treated as an indicator of measurement information model. That is, the KGI is computed from base measures using an analysis model, and interpreted by decision criteria. Every stakeholder’s goal has only one KGI. There is no stakeholder’s goal which does not have a KGI. Not using multiple KGIs for a goal makes judgment of goal achievement clear. If a stakeholder evaluates a goal from multiple viewpoints, set composite metric as a KGI, or divide the goal in more detail. For instance, when “enhance software quality with respect to availability” is set as stakeholder’s goal, mean time to repair (MTTR) and mean time between failures (MTBF) are not used as KGIs, but operation rates (operation rates = MTBF / (MTBF + MTTR)) is used as a KGI. Or “enhance software quality with respect to reliability” and “enhance software quality with respect to serviceability” are set as stakeholder’s goals, and MTBF and MTTR are set as a KGI for each goal. C. Key process indicator The key process indicator (KPI) is a metric which indicates whether progress toward the goal is smooth or not. Keeping values of KPIs sound is expect to bring achievement of the KGI. This element is defined to satisfy requirement (R2). With the KPI, a purchaser grasps status of the project easily. Same as the KGI, the KPI is used in the.
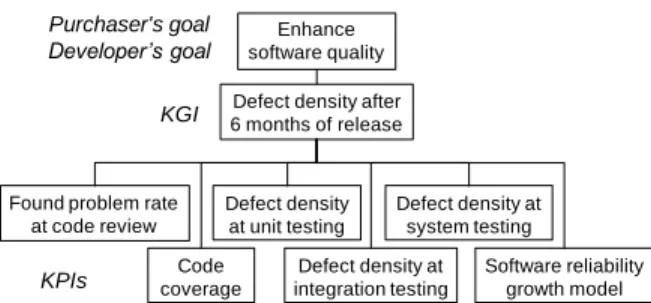
(5) In Proc. of the 9th IEEE/ACIS International Conference on Computer and Information Science (ICIS 2010), pp.723-728, August, 2010 (Yamagata, Japan) Purchaser's goal Developer’s goal KGI. Found problem rate at code review. KPIs. Enhance software quality. Defect density after 6 months of release. Defect density at unit testing. Code coverage. Defect density at system testing. Defect density at integration testing. Software reliability growth model. Figure 4. An example of Indicator Structure Diagram.. business management area, and a KPI is treated as an indicator. Every KGI has at least one KPI. There is no KGI which does not have a KPI. It is possible that particular KPIs relate to two or more different KGIs. When “keep software quality high” is set as stakeholder’s goal and defect density after release is set as a KGI, candidates of KPIs are code coverage, software reliability growth model (SRGM) [17], and so on. D. Check timing Check timing shows when stakeholders check KGIs and KPIs. This element is defined to satisfy requirement (R5). KGIs are generally checked at the end of the project, but sometimes at different timing. For Example, when a KGI is defect density after 6 months of release, check timing of the KGI is after 6 months of release. Check timing of a KPI is settled as a point such as the end of certain phase or frequency. For instance, when stakeholder’s goal is “Prevent delaying software release” and program size is set as a KPI to grasp progress, check timing of the KPI can be set as frequency, that is “Check program size every week.” Also, when stakeholder’s goal is “keep software quality high” and code coverage is set as a KPI, check timing of the KPI can be set as a point, i.e. “Check code coverage after unit testing.” Every KGI and KPI has one checking time. When a KPI is checked several times, check timing is described as “Check number of defects after unit testing and integration testing,” for example. Check timing is described for each KGI and KPI by plain text, or also illustrated along with data measurement timing by a figure. An example of the figure is exhibited in section IV. Note that timing of data collection and check timing of a KPI can be different. For instance, when transition of total lines of code is used as a KPI, it is reasonable that timing of data collection is set as every day, and check timing is set as every week to lessen effort of checking the KPI. Moreover, each stakeholder’s check timing can be different respectively. For example, it is not uncommon that developer’s check timing of defect density at unit testing is set as the middle of unit testing and the end of unit testing, and purchaser’s one is set as only the end of unit testing, because it would be better that corrective actions are performed by the developer before the purchaser checks KPIs. E. Corrective action Corrective action describes how to remediate condition of project/product when a KPI indicates abnormal condition.. This element is defined to satisfy requirement (R6). Concept of corrective action is almost same as that of the Hazard Analysis and Critical Control Point (HACCP) [5], management system for food safety. Corrective action derives the commitment of a developer that it surely reacts to issues which are observed by KPIs. Every KPI has one corrective action. The KGI does not have corrective action because the KGI is checked after a project finished. Detailed corrective actions are itemized for each abnormal case classified by decision criteria. For example, when defect density at integration testing is set as a KPI, corrective action is described as follows: When a value of the KPI is larger than upper limit of reference value: o Unit testing of the subsystem is conducted again. When a value of the KPI is smaller than lower limit of reference value: o Confirm number of test cases for the subsystem, and test the subsystem again. IV.. APPLICATION OF PROJECT MONITORING MODEL. This section shows an application of our project monitoring model and notations for the model. The application assumes that project is monitored by a purchaser and a developer. The purchaser and the developer have a common goal about quality. Note that this example is derived from our consideration, not from an industrial case. Indicator Structure Diagram (Fig. 4) illustrates relationships of the stakeholder’s goal, the KGI, and KPIs. Indicator Description Chart (Table I) shows KGI/KPIs, base measures, measurement methods, measurement functions, an analysis model, decision criteria, and corrective actions. Monitoring Activity Diagram (Fig. 5) represents check timing and data collection timing. Dots are used when check or measurement is done at particular point, and lines are used when check or measurement is done at certain frequency. A stakeholder’s goal and a KGI are settled based on stakeholder’s discussion. KPIs are settled by stakeholder’s experiences, consideration, or knowledge of software engineering research. For instance, this example uses software reliability growth model (SRGM) as one of KPIs for the KGI “defect density after 6 months of release,” because when SRGM estimates remaining defects as low, defect density after 6 months of release is anticipated to be low. Decision criteria and corrective actions are decided in a similar way. Note that when a purchaser does not have enough knowledge or experiences about software development, KPIs are mainly chosen by a developer. From the application, it can be concluded that our model has capability to describe how to monitoring project with stakeholders accurately. The capability is expected to help agreement of project monitoring between stakeholders, and to assist planning it as a template. V.. RELATED WORK. Although there are some models which relates to measurement process, they do not just match modeling project monitoring with stakeholders. Basili et al. [1].
(6) In Proc. of the 9th IEEE/ACIS International Conference on Computer and Information Science (ICIS 2010), pp.723-728, August, 2010 (Yamagata, Japan) Test Phase Integration Unit testing testing. System testing. Code coverage # of problems (Occasional) at code review (Occasional). After 6 months of release. # of defects after release (Occasional). Program size (Daily), # of defects (Occasional) Found problem rate at code review. Code coverage. Software reliability Defect Defect density growth model density after at integration release testing Defect density Defect density at at unit testing system testing. Purchaser’s check timing. Developer’s check timing. Timing of data collection. Code review. (Same as above). Figure 5. An example of Monitoring Activity Diagram.. proposed GQM approach. GQM is used to decide which metrics should be measured. At first, a goal which is intended to be achieved through measurement process is set, next, questions which explain how to evaluate goal is set, and metrics are decided based on the questions. GQM is useful to make measurement plan, but it covers only plan phase. Although the questions of GQM includes concept of KGI and KPI, and the goal of GQM includes stakeholders to some extent, it does not define them explicitly. Other GQM TABLE I. KGI/KPI. Base measure. Number of defects Defect density after after release 6 months of release Program size Number of found Found problem rate problem at code review Program size Code coverage. Code coverage Number of defects. Defect density at unit testing. Defect density at integration testing. Program size Number of defects Program size. Defect density at integration testing. Number of defects Program size. Number of Software reliability defects growth model Defect found time. Measurement method Collect defects from a bug tracking system Measure program size by a program size measurement tool Collect found problems at code review. approach [2] is also different from our model in the points. Kitchenham et al. [13] proposed modeling method of measurement, based on the model which one of the authors proposed [14]. To enhance reliability of dataset, they focused on data structure and storing data, and defined some elements such as data type, range, counting rule, and so on. Namely, their research mainly covers do phase. ISO/IEC 15939 [11] defines the measurement information model explained in section III. It covers do and check phase. However, it does not include KGI, KPI, and stakeholder’s goal, and hence it does not cover plan phase. Additionally, ISO/IEC 15939 defines measurement process based on plan-do-check-act cycle, and mentioned act phase. However, ISO/IEC 15939 does not define elements for act phase, and therefore the measurement information model does not include them. Chirinos et al. [4] proposed the model for software measurement (MOSME) which covers plan phase, do phase and check phase. The model has elements which explain collecting and interpreting data in detail. García et al. [8] proposed software measuring modeling language (SMML), based on researches which some of the authors worked on [7][9]. It includes elements which are used for plan, do, and check phase. But these models do not include elements like KGI, KPI, stakeholder’s goal or collective action. Hence, these models do not fit well for modeling project monitoring with stakeholders. Other models [15][16] are also different from our model in the points. The KGI and the KPI are also used by the control objectives for information and related technology (COBIT). AN EXAMPLE OF INDICATOR DESCRIPTION CHART. Measurement function Number of defects after release / program size. Number of found problem / program Measure program size size by a program size measurement tool Measure C0 coverage by a code coverage Not applicable measurement tool Collect defects at unit testing Number of defects at unit testing / Measure program size program size by a program size measurement tool. Analysis model. Decision criteria. When the value is lower than the target value Not which is decided by a developer and a applicable purchaser, the developer’s goal and the purchaser’s goal are regarded to be attained.. Corrective action. Not applicable. Compare the value between modules. When the Not review of the module is of a module is too low, code review of it Code applicable value conducted again. is suspected of insufficiency.. When the value of a module is lower than Not testing of the module is suspected of applicable 100%, insufficiency. Compare the value between modules. Case1: When the value of a module is too low, Not number of test cases is suspected of applicable insufficiency. Case2: When the value of a module is too high, quality of module is suspected of low. Collect defects at Compare the value between subsystems. integration testing from Case1: When the value of a subsystem is too Number of defects a bug tracking system low, number of test cases is suspected of at integration testing Not applicable insufficiency. Measure program size / program size Case2: When the value of a subsystem is too by a program size high, unit testing is suspected of insufficiency. measurement tool Collect defects at Compare the value between subsystems. integration testing from Case1: When the value of a subsystem is too Number of defects a bug tracking system low, number of test cases is suspected of at integration testing Not applicable insufficiency. Measure program size / program size Case2: When the value of a subsystem is too by a program size high, unit testing is suspected of insufficiency. measurement tool Collect defects from a bug tracking system Apply a When the SRGM estimates remaining defects Not applicable SRGM as high, testing is regarded as insufficient. Collect found time from a bug tracking system. The module is tested again. Case1: Confirm number of test cases of the module, and test the module again. Case2: Code review of the module is conducted again. Case1: Confirm number of test cases of the subsystem, and test the subsystem again. Case2: Unit testing of the subsystem is conducted again. Case1: Confirm number of test cases of the subsystem, and test the subsystem again. Case2: Unit testing of the subsystem is conducted again. Testing is proceeded until the SRGM estimates remaining defects as low..
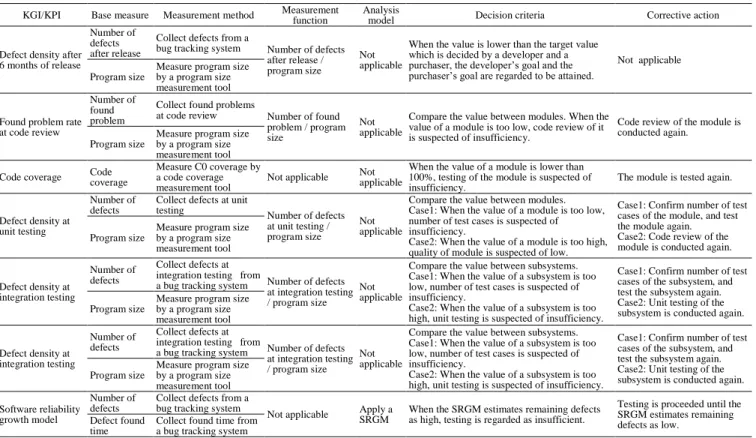
(7) In Proc. of the 9th IEEE/ACIS International Conference on Computer and Information Science (ICIS 2010), pp.723-728, August, 2010 (Yamagata, Japan) TABLE II.. Requirement. COMPARISON OF MODELS RELATED TO MEASUREMENT PROCESS. GQM ISO/IEC Our Kitchenham MOSME SMML approach 15939 model et al. [13] [4] [8] [1] [11]. (R1). Yes. Partially yes. No. No. No. No. (R2). Yes. Partially yes. No. No. No. No. (R3). Yes. No. Yes. Yes. Yes. Yes. (R4). Yes. No. No. Yes. Yes. Yes. (R5). Yes. No. No. No. No. No. (R6). Yes. No. No. No. No. No. This work is being conducted as a part of the StagE project, The Development of Next-Generation IT Infrastructure, supported by the Ministry of Education, Culture, Sports, Science and Technology. REFERENCES [1]. [2]. [3]. [4]. [12], which is a framework for IT governance and internal control. Usage of them is similar to our model. KPIs are set to activities of an organization’s lower (e.g. department) to achieve a goal of the organization’s upper (e.g. whole company) measured by the KGI. However, COBIT defines process, not measurement model, so it is not applicable to modeling project monitoring. Table II shows whether or not our model and these models satisfy requirements of a model for project monitoring with stakeholders explained in section II (Similar comparison was also done in [4] to clarify differences of past researches). In the table, “Yes” of each cell means a model written in the column satisfies a requirement written in the row, and “No” means not satisfy. Except for our model, any model does not satisfy all requirements, and especially, requirements (R5) and (R6) are not satisfied. This means that without our model, though combination of other models cannot satisfy the requirements (R5) and (R6). VI.. CONCLUSIONS. We propose the model of project monitoring with stakeholders (a purchaser and a developer, or a primary contractor and a sub contractor). Although project monitoring with the stakeholders is expected to suppress project failure, there was no appropriate model to describe it. We specify six requirements for the model, and based on the measurement information model defined by ISO/IEC 15939, we added stakeholder’s goal, key goal indicator (KGI), key performance indicator (KPI), check timing, and corrective action to the model. Our model is useful for planning project monitoring with stakeholders more rigorously, and they can agree the plan more smoothly. Compared to other measurement models, our model is most fitted to project monitoring with stakeholders. Application of the model is shown to confirm description capability of the model. Our future work is extending notations of the model. ACKNOWLEDGMENT. [5]. [6]. [7]. [8]. [9]. [10]. [11]. [12] [13]. [14]. [15] [16]. [17] [18]. V. Basili, and H. Rombach, “The TAME project: towards improvement-oriented softwareenvironments,” IEEE Transactions on Software Engineering, vol. 14, no. 6, pp. 758-773, 1988. L. Briand, S. Morasca, and V. Basili, “An Operational Process for Goal-Driven Definition of Measures,” IEEE Transactions on Software Engineering, vol. 28, no. 12, pp. 1106-1125, 2002. P. Chen, “The entity-relationship model - toward a unified view of data,” ACM Transactions on Database Systems (TODS), vol. 1, no. 1, pp. 9-36, 1976. L. Chirinos, F. Losavio, and J. Bøegh, “Characterizing a data model for software measurement,” Journal of Systems and Software, vol. 74 no. 2, pp. 207-226, 2005. Food and Agriculture Organization of the United Nations, Food Quality and Safety Systems: A Training Manual on Food Hygiene and the Hazard Analysis and Critical Control Point (Haccp) System, Food and Agriculture Organization of the United Nations, 1998. A. Fuggetta, L. Lavazza, S. Morasca, S. Cinti, G. Oldano, and E. Orazi, “Applying GQM in an industrial software factory,” ACM Transactions on Software Engineering and Methodology (TOSEM), Vol. 7, No. 4 , pp. 411-448, 1998. F. García, M. Bertoa, C. Calero, A. Vallecillo, F. Ruiz, M. Piattini, and M. Genero, “Towards a consistent terminology for software measurement,” Information and Software Technology, vol. 48, no. 8, pp. 631-644, 2006. F. García, F. Ruiz, C. Calero, M. Bertoa, A. Vallecillo, B. Mora, and M. Piattini, “Effective use of ontologies in software measurement,” The Knowledge Engineering Review, vol. 24 , no. 1, pp. 23-40, 2009. F. García, M. Serrano, J. Cruz-Lemus, F. Ruiz, and M. Piattini, “Managing software process measurement: A metamodel-based approach,” Information Sciences: an International Journal, vol. 177, no. 12, pp. 2570-2586, 2007. K. Inoue, “Software Tag for Traceability and Transparency of Maintenance,” Proc. IEEE International Conference on Software Maintenance (ICSM 2008), pp. 476-477, Oct. 2008. ISO/IEC 15939, “Software Engineering - Software Measurement Process Framework,” International Organization for Standardization, 2002. IT Governance Institute: Cobit 4.1, ISACA, 2007. B. Kitchenham, R. Hughes, and S. Linkman, “Modeling Software Measurement Data,” IEEE Transactions on Software Engineering, vol. 27, no. 9, pp. 788-804, 2001. B. Kitchenham, S. Pfleeger, and N. Fenton, “Towards a Framework for Software Measurement Validation,” IEEE Transactions on Software Engineering, vol. 21, no. 12, pp. 929-944, 1995. J. Lawler, B. Kitchenham, “Measurement Modeling Technology,” IEEE Software, vol. 20, no. 3, pp. 68-75, 2003. J. McGarry, D. Card, C. Jones, B. Layman, E. Clark, J. Dean, and Fred Hall, “Practical Software Measurement: Objective Information for Decision Makers,” Addison-Wesley Professional, 2001. J. Musa, A. Iannino, K. Okumoto: Software Reliability: Measurement, Prediction, Application, Mcgraw Hill, 1989. D. Parmenter: Pareto's 80/20 Rule for Corporate Accountants, Wiley, 2007..
(8)
図
+2
![Table II shows whether or not our model and these models satisfy requirements of a model for project monitoring with stakeholders explained in section II (Similar comparison was also done in [4] to clarify differences of past researches](https://thumb-ap.123doks.com/thumbv2/123deta/8633451.1341129/7.918.87.441.140.340/requirements-monitoring-stakeholders-explained-similar-comparison-differences-researches.webp)
関連したドキュメント
Furthermore the effectiveness of 3D dynamic frame analysis software, i.e., Engineer's Studio which is more simple and suitable for the design work was confirmed by reproducing
This product includes software developed by the OpenSSL Project for use in the OpenSSL
Algebras, Lattices, Varieties Volume I, Wadsworth & Brooks/Cole Advanced Books &
The goods and/or their replicas, the technology and/or software found in this catalog are subject to complementary export regulations by Foreign Exchange and Foreign Trade Law
Copying of any Nintendo software or manual is illegal and is strictly prohibited by copyright laws of Japan and any other countries as well as international laws. Please note
Definition 1 Given two piles, A and B, where #A ≤ #B and the number of to- kens in the respective pile is counted before the previous player’s move, then, if the previous player
We show that a discrete fixed point theorem of Eilenberg is equivalent to the restriction of the contraction principle to the class of non-Archimedean bounded metric spaces.. We
NIST - Mitigating the Risk of Software Vulnerabilities by Adopting a Secure Software Development Framework (SSDF).
