Exploring legibility of augmented reality X-ray
23
0
0
全文
(2) 2. Marc Ericson C. Santos et al.. 1 Introduction Augmented reality (AR) and its related technologies, systems and applications enables many novel visualizations that can be applied to various fields [3]. Among these novel visualizations, X-ray vision or seeing through an occluding surface [17] leverages the inherent capability of AR to display a combination of real environments and virtual objects simultaneously. Several AR systems apply X-ray vision as the primary use of AR. Examples would be seeing through the cockpit floor and walls [6], presenting ultrasound information on a patients body [2], surveillance [13], looking through buildings for navigation purposes [20] and looking at underground structures for construction [26]. Despite the many advances in prototypes, the realization of AR X-ray remains challenging for consumer applications because of the need for practical hardware for computing and displaying X-ray visualizations properly. Moreover, we need more user studies to explore this rather super human sense that this interaction technique offers. Several researchers are studying the depth perception afforded by AR X-ray systems, and ways of measuring such perceived depth to evaluate usability more accurately in [16], [17] and [15]. Another important point of evaluation for AR X-ray is the legibility of the visualization. Although some significant effort have been made to improve the legibility of AR X-ray in [10], [11] and [12], there is little empirical research aimed at exploring legibility in various methods of creating X-ray visualizations. AR X-ray relies on partially occluding virtual objects to convey depth to the user. However, there is a trade-off between depth cues and legibility because occluding the virtual object reduces its legibility. Thus, the task is to find the sweet spot wherein adequate occlusion cues are provided while keeping the virtual object legible. Both legibility and depth cues are subject to the users’ intention. For example, different users may be interested to see some specific parts of a virtual object, but not the rest. Current AR X-ray systems use an image-based approach which performs calculations on images such that all parts of the images have equal importance. In cases wherein the user is only interested in a specific part, some user input mechanism must be available to favor what the user is interested in. Kalkofen et al. [10] applied interactive adjustment of occlusion cues depending on the user input. Zollman et al. [26] proposed how their system can become legible by user inputs, however, they did not implement nor evaluate it.. 1.1 Contribution In this research, we offer a first exploration of legibility in AR X-ray. In particular, we study legibility in our implementation of edge-based and saliency-based.
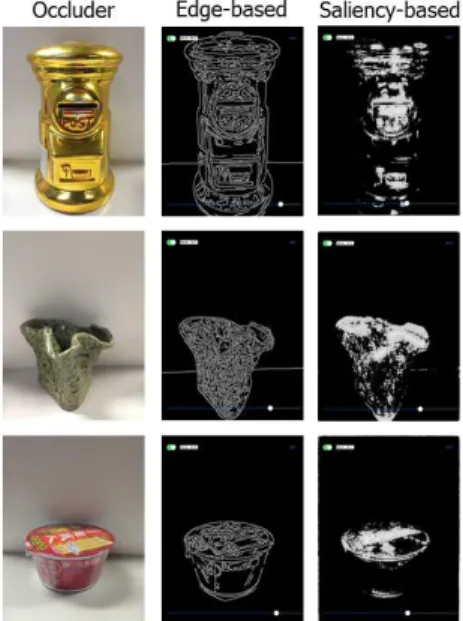
(3) Exploring Legibility of Augmented Reality X-ray. 3. AR X-ray. Moreover, we explore using user inputs for improving legibility. Insights for this research can be applied to improve future AR systems. As a minor contribution, we discuss how we implemented edge-based and saliency-based AR X-ray entirely on a tablet computer. We chose tablet computers because it is widely used for mobile AR [14]. Handhelds are appropriate for many types of AR applications including maintenance, scientific visualizations, entertainment, education, and other fields [23]. 2 Augmented Reality X-Ray AR X-ray employs image-based techniques to preserve parts of an occluding object that are important to understanding it, while removing the rest to reveal occluded objects. Several methods have been applied, among which are edge-based and saliency-based methods. Although some empirical evaluations of perception exists, the focus is on depth perception; whereas the legibility of the visualization remains unexplored. 2.1 Partial Occlusion Livingston et al. [17] defines occlusion to be when a closer opaque object (the occluder) prevents light rays bouncing off a farther object (the occluded) from reaching an observer, thereby making the occluded invisible to the observer. Partial occlusion occurs when the occluder blocks only a fraction of the light rays bouncing from the occluded. Occlusion and partial occlusion are important for perceiving depth in our natural environment. For example, when examining a skyline, people can identify which building is nearer to his position by identifying which building partially occludes another. Similarly, people can understand an object to be inside a translucent container, say a wine bottle, through partial occlusion. 2.2 Image-based Techniques Current methods for achieving AR X-ray relies on image-based techniques to determine important regions of an occluding real object. These regions are then preserved by rendering them on top of the virtual object, after the virtual object had been overlaid onto a real environment. AR X-ray requires an importance map which is an image representing the important regions of a real object. Figure 1 shows examples of real objects and their corresponding importance maps. For the edge-based AR X-ray, the importance map is based on the edges detected on the object. For the saliency-based AR X-ray, the importance map is based on the visual saliency map [9] of the object. In [10] and [11], Kalkofen et al. developed a visualization technique that partially occludes virtual objects with edges found on the occluding real object. In their visualization, the virtual objects are being viewed inside real.
(4) 4. Marc Ericson C. Santos et al.. Fig. 1 Left column shows the possible occluding objects. Middle and right columns are the possible importance map generated by detecting edges and salient regions, respectively. Darker areas are less important, whereas lighter areas are more important.. objects which serves as the context of visualization. By maintaining the edges of the occluding object, Kalkofen et al. achieves a context-preserving AR Xray visualization. They explained that preserving edges solves two important requirements of AR X-ray visualization. First, the edges are able to provide enough depth cues to convey the spatial relationship of the occluder and the occluded. Second, they provide important information about the occluder, such as its shape and prominent features. Avery et al. [1] applied the edge-based approach of Kalkofen et al. [10] to their AR X-ray system. They used an edge detection filter on live video images to detect sharp changes in the luminance of the occluder. Edges are represented by thin white lines and are then overlayed on live video images of the occluded. They explained that drawing these lines maintains the major shape of the occluder. Moreover, the occluded remains visible because there is very little occlusion. Sandor et al. [20] introduced another method for generating the importance map. Instead of detecting edges, they detect visually important regions based on the saliency computational model of Walther [25]. In their computation of the saliency map, Sandor et al. considered luminosity, color opponency, and motion as observed in the changes in the luminosity channel. This implementation follows the intuition that bright areas, highly-contrasted colors, and moving objects tend to capture people’s attention and are thus important to understanding the scene..
(5) Exploring Legibility of Augmented Reality X-ray. 5. Around the same time with [20], Zollman et al. [26] offered a more sophisticated method for creating the importance maps for their AR X-ray. In their work, the importance map is a combination of edges, saliency maps, textures, and synthetic details. Aside from considering edges and salient regions of an image to be important, they also considered highly-textured regions to be important to understanding the scene. In cases wherein few edges, salient regions, and textures are found, their method adds synthetic details to provide occlusion cues. Kalkofen et al. [12] improved on the work of Zollman et al. [26] by making the method adaptive. After maintaining important parts of the occluder, and deleting its unimportant parts, an additional module automatically adjusts the contrast to more clearly separate the occluder from the occluded virtual object.. 2.3 Past Empirical Evaluations Several studies have conducted empirical evaluations of various methods of achieving AR X-ray. Most of the past research revolves around understanding depth perception in AR X-ray. However, some insights have also been generated regarding the legibility issues of AR X-ray as reported by users. In [1], Avery et al. argues that their edge-based method provides a good sense of depth. However, they note that some visualization design is necessary when displaying the occluded. In some cases, it is possible to confuse the edges found on the occluded to be part of the occluder. This may hamper depth perception. They noted that their method is limited because the sensitivity to edges is fixed. As such, if the background is too cluttered, many edges will be drawn thereby making the occluded difficult to see. However, they did not conduct a formal evaluation of legibility. In this paper, we explored how this sensitivity to edges affects the X-ray visualization. In [20], Sandor et al. compared their edge-based and saliency-based AR Xray systems for the far-field (beyond 30 meters) distance. In their experiment, users are asked to find a target on a 640 x 480 pixel screen. The targets are either big (16 pixels) or small (9 pixels) red circles. Overall, they did not find significant differences on the time taken to find the target. However, participants were significantly faster with the edge-based X-ray than with the saliency-based X-ray when finding the small red circles. This is suggests that legibility becomes an issue when the targets become smaller. The participants preferred the edge-based AR X-ray over the saliency-based AR X-ray. However, this difference was not significant. In a follow up experiment, Sandor et al. confirmed that high levels of edges causes problems for edge-based AR X-ray, and that high levels of brightness causes problems in saliency-based AR X-ray. In this paper, we explore more on these problems in our experiments. The work of Kalkofen et al. [10] allows some user inputs to modify the X-ray visualization. This is their pre-emptive solution to address possible problems in depth perception and legibility. Kalkofen et al. allows users to select parts.
(6) 6. Marc Ericson C. Santos et al.. of the real object wherein the X-ray visualization will be applied. This allows the user to specifically input the part of the image wherein they need some help to understand the visualization. Similarly, Zollman et al. [26] foresaw possible problems in depth perception and legibility so they recommended a parameter that could be modified by the user to adjust the importance map. However, their system did not apply such user inputs. In our research, we applied mechanisms on how the importance maps of edge-based and saliencybased methods can be controlled by the user. Instead of user inputs, Kalkofen et al. [12] improved AR X-ray by adding another step that automatically adjusts the contrast of the occluder and the occluded. By adding this step, users performed significantly better in finding targets in the AR X-ray visualization. This approach is straight-forward because it applies the rule that previously important regions of the occluder must remain an important region by adjusting its contrast. Although this automatic method is good for target acquisition tasks, it does not consider the intention of the user, such as in the system of Kalkofen et al. [10]. We believe that it is still important to understand the cases wherein AR X-ray visualization methods result in illegible compositions, so that we can provide user inputs to adjust the X-ray visualization. Dey et al. [4] was first to compare depth perception in AR X-ray when using handheld devices, such as iPhones and iPads. They found that when using the current techniques for handheld AR, people underestimate distances in the medium-field (beyond arms-reach to 30 meters) and in the far-field distances. Overall, they did not observe any effects of AR X-ray on depth perception [5]. Users underestimated distances of virtual objects from themselves more on the iPad compared to the iPhone. However, using the iPad allowed for better estimation of distances between two virtual objects. Participants also expressed their preferences for the iPad over the iPhone for AR X-ray. Lastly, the varying screen resolutions of the iPad and the iPhone did not result in significant differences [4]. In our experiments, we implemented not only an edge-based AR X-ray, but also a saliency-based AR X-ray on an iPad mini. We agree with Dey et al. that tablets are appropriate platforms for AR X-ray. As such, we base our exploration of legibility of X-ray visualization on tablet computers. In [24] we talked about our first attempt to encourage an interdisciplinary effort in introducing AR X-ray to the classroom. We explain that the X-ray visualization is good for visualizing virtual information in the context of [21] a real object. AR X-ray visualization is one of the key applications that exemplifies how AR can relate educational content to the real world [22]. In comparing edge-based AR X-ray to simple virtual overlay [21] we did not find significant differences in the perception of depth, legibility, and realism. Moreover, teachers and school administrators believe that AR X-ray is applicable to their practice, and would help promote learning by experience. If designed well, AR X-ray can be used to motivate a generation students that are accustomed to using handheld devices for communication and entertainment..
(7) Exploring Legibility of Augmented Reality X-ray. 7. 3 Approach For developing AR systems, user studies are useful for gaining insights to address human factors issues found in novel interaction techniques [7]. In the case of X-ray visualization, comprehensibility or the ease of understanding the presented information will contribute significantly to the overall usability of an AR system [23]. Given the limitation of AR to currently available hardware, Livingston recommends confining human factors experiments to testing only with the well-designed components of the whole AR system [15]. In exploring legibility, we apply methods that have been used for studying legibility in other AR systems. Not surprisingly, legibility is an issue in annotating real environments with virtual texts. Various methods, such as label separation methods [19] and active text drawing styles [8], have been employed for this purpose. In both these studies, the researchers are proposing an improvement in the legibility of virtual texts drawn in the natural environment. To accomplish this, they followed this pattern: 1. Conduct a literature review to inform the design of the AR system. 2. Create a high-quality prototype that represents the idea. However, implement only the necessary parts of the system for testing [15]. 3. Execute an experiment to validate hypotheses or gain insights as to how the idea affects human perception. We also followed the pattern above for this research. We conducted a literature review in Section 2 to discover the proper implementation and find out the current problems reported by users. Then, we implemented two X-ray visualizations based on the edge-based method and the saliency-based method. In our prototype systems, we did not implement the tracking part of AR because we are only interested in how well the composed image of AR X-ray visualization is understood by the users. As such, we assumed that the AR system can be consistently held properly while doing the visual tasks. By doing this, we can separately study legibility issues due to X-ray visualization, and legibility issues due to unstable tracking [15]. In other words, we prevented tracking instability [4] from interfering with performing the visual tasks. In two experiments, we explored how edge-based and saliency-based AR X-rays affect the performance of users in some visual tasks. Similar to [19] and [8], our data set is composed of multiple perception judgements from the users. We then treat the users as random variables during the analysis. Note that we conducted usability evaluations such that, the object of the experiment is the AR X-ray system and not the human person [18]. The goal of this exploration is not to understand human perception, but to generate ideas on how to improve legibility in AR X-ray systems. 4 Implementation We implemented both the edge-based and saliency-based AR X-ray visualizations by following the diagram in Figure 2. The calculation requires the images.
(8) 8. Marc Ericson C. Santos et al.. Fig. 2 Calculating the AR X-ray visualization. Occluder, importance map and mask (inverted) are multiplied per pixel. Occluded, importance map (inverted) and mask are multiplied per pixel. The resulting images are then added per pixel.. of the occluder and its importance map, and the occluded and its mask. The occluder, importance map and mask (inverted) are multiplied per pixel. Then, the occluded, importance map (inverted) and mask are multiplied per pixel. The resulting images from these two operations are then added per pixel. To generate the importance map of the edge-based AR X-ray, we used OpenCV 2.4.3 1 to detect Canny edges. To generate that of the saliency-based AR X-ray, we used the visual saliency tracker of Nick’s Machine Perception Toolbox. 2 Our AR X-ray applications run entirely on iPad mini tablets (A7 processor, 512MB DDR2 RAM, 16GB, 308 grams). We used the back camera (357x288 pixels, 10 fps) for sensing, and a 7.9 inch LED-display for the display. We used the standard user interface elements of iOS 7.. 4.1 Thresholding Using Sliders As a simple mechanism for controlling the amount of partial occlusions, we modify the thresholds for the edge-based and saliency-based AR X-rays using 1 2. http://docs.opencv.org/ http://mplab.ucsd.edu/~ nick/NMPT/.
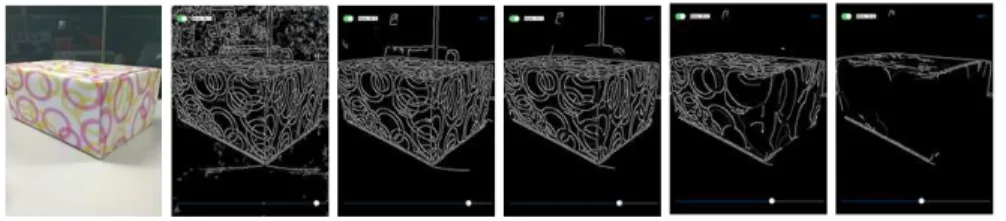
(9) Exploring Legibility of Augmented Reality X-ray. 9. Fig. 3 Edge-based importance map as threshold is increased using our slider. Fig. 4 Saliency-based importance map as threshold is increased using our slider. an iOS slider. By increasing or decreasing a threshold, we can decrease or increase the amount of important regions, thereby decreasing or increasing the amount of occlusion. Figures 3 and 4 show the importance maps generated as the thresholds are increased. The Canny edge detector already requires a threshold value for detecting the edges: a low threshold and a high threshold such that: 1) when the pixel gradient is higher than the high threshold, the pixel is an edge; 2) when the pixel gradient is lower than the low threshold, the pixel is not an edge; 3) when the pixel gradient is between the thresholds, then it is an edge only if it is adjacent to a pixel that passed condition 1. In our implementation, we fixed the high threshold to be twice the low threshold as recommended in the OpenCV documentation. Thus, we had only one value to control with the slider. For thresholding the saliency-based importance map, we first normalized the importance map to have a range of values from 0 to 255. We then suppress to zero the values that are below the threshold.. 5 Experiment In our experiments, we asked participants to use our system for accomplishing visual tasks that involve a combination of common AR tasks, namely distinguishing a virtual object and identifying it [15]. We designed two tasks that would generate insights on the appropriate amounts of occlusion which does not hamper the understanding of AR X-ray visualization..
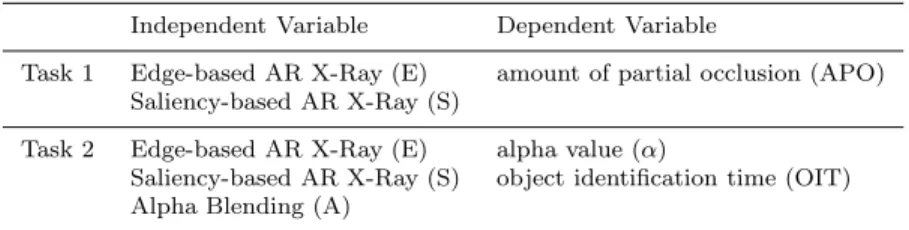
(10) 10. Marc Ericson C. Santos et al.. Table 1 Summary of Variables Independent Variable. Dependent Variable. Task 1. Edge-based AR X-Ray (E) Saliency-based AR X-Ray (S). amount of partial occlusion (APO). Task 2. Edge-based AR X-Ray (E) Saliency-based AR X-Ray (S) Alpha Blending (A). alpha value (α) object identification time (OIT). 5.1 Participants We envision that in the near future, AR X-ray will be integrated with handheld devices, such as smartphones and tablets. As such, we chose our participants to be regular smartphone and tablet users. We had a maximum sample size of 14 subjects (10 male, 4 female) with a mean age of 26 (SD = 2). All of them are daily smartphone users. Aside from smartphones, subjects uses tablet computers regularly. Four uses the tablet daily, three uses the tablet a few times a week, and two uses the tablet a few times a month. According to the demographics survey, 12 of the participants have used some form of AR technology before, however only two had previously experienced AR X-ray. 5.2 Variables The dependent variables in this study were amount of partial occlusion (APO), alpha value (α), and object identification time (OIT). The independent variables were the type of occlusion presented, namely edge-based AR X-ray (E), saliency-based AR X-ray and alpha blending (A). Alpha blending serves as a benchmark for the two AR X-ray methods. Table 1 summarizes the independent and dependent variables for Tasks 1 and 2. 5.3 Test Instruments and Materials Each independent variable in Table 1 correspond to an iOS application. In total, five different iOS apps were developed for an iPad mini for this study. Two apps correspond to E and S for measuring the level of tolerance in Task 1 and three apps (corresponding to E, S, and A) for measuring alpha value and identification time in Task 2. Each app consisted of one of the selected AR X-ray visualization methods to see through a real object. Although the real object was captured live using the devices camera, a predefined set of images representing the content of the boxes were used. For Task 2, we fixed the APO to 60/100 for the two X-ray methods. We chose this threshold by asking two participants (not part of the 14) to perform a task similar to task 1. However, instead of using Landolt C’s, we used the objects in Figure 8..
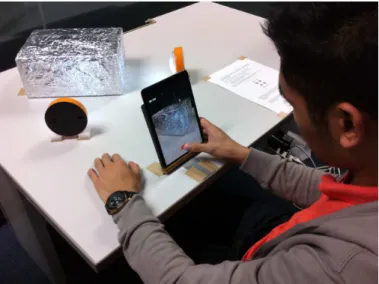
(11) Exploring Legibility of Augmented Reality X-ray. 11. Fig. 5 User study set up. We prepared a table with a tablet computer on it. The device was positioned close to the edge with its camera facing the table and its display facing a user sitting on a chair (Figure 5). We prepared a set of six boxes of the same size (10.6 in x 4.7 in x 7.7 in) with different textures to simulate occlusion conditions that challenge the AR X-ray methods. The boxes were selected to feature different kinds of lighting (Figure 6 e-h), edges (Figure 6 c-d) and colors (Figure 6 a-b). Light sources were also fixed on the table next to the marked position for the boxes. Two of the boxes (sil and crum) were used twice (with and without the lights on), totaling the number of box set ups to eight. Box set ups Red, Brown, Green and Crum were chosen to challenge edge-based AR X-ray; whereas Pink, Sil, Sil-light and Crum-light were chosen to challenge saliency-based AR X-ray.. 5.4 Procedure Prior to the experiment, we informally screened the subjects based on their vision health. We excluded subjects whose vision was impaired for any reason. We informed the subjects about the content of the research, and we asked them if they are willing to participate. Participants were then presented with two tasks. 5.4.1 Task 1 Task 1 measured the level of tolerance to occlusions when using the two X-ray methods E and S. We asked the participants to slowly lower the threshold value using a slider. Half of the participants used E first, whereas the other.
(12) 12. Marc Ericson C. Santos et al.. Fig. 6 Box set ups: (a) red, (b) pink, (c) brown, (d) green, (e) sil, (f) sil-light, (g) crum, and (h) crum-light. Fig. 7 Landolt Cs. half used S first, with a 5 minute break in between. We instructed them to decrease the threshold until they can finally see clearly all four Landolt Cs (Figure 7). The participants performed this task twice for each of the eight box set ups. For each time, the Landolt Cs were in two sizes, big (21x21 pixels) and small (7x7 pixels). We asked the participants to first adjust the scale, and then say the value corresponding to the threshold level. The values ranged from 0 to 100; 0 has the minimum occlusion whereas 100 has the maximum occlusion. 5.4.2 Task 2 Task 2 aimed at measuring the alpha value and the time taken to identify objects through the two X-ray methods (E and S) and a benchmark (A). For.
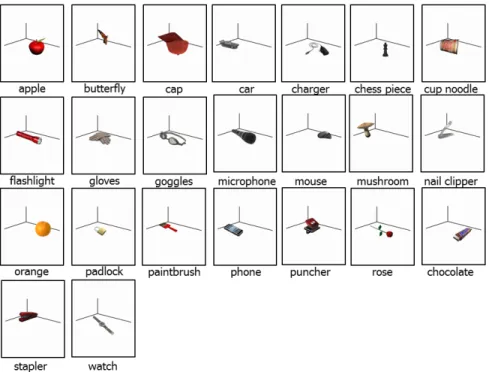
(13) Exploring Legibility of Augmented Reality X-ray. 13. Fig. 8 Objects used for the object identification task. Task 2, subjects had to identify two objects per box set up (one at a time) randomly picked from a predefined set of 23 (Figure 8) which were displayed in different positions within the box. We varied the order of A, E, and S for each participant with a 5 minute break in between. In this task, a start button was presented at the beginning before every object could be identified. Once the start button had been pressed, the parts of the box that did not constitute the occlusion had their alpha decreased over time (decrease of 0.02 per second), thus slowly revealing the object. Participants were asked to press the stop button and say what the object was, once they identified it. We then took note of the alpha value. Note that in this experiment, object identification time (OIT) in seconds and alpha value (α) are related such that α = 100 − OIT ∗ 0.02.. 5.5 Statistical Procedures and Data Analysis We conducted a within-subjects design for both Task 1 and Task 2. We try to minimize order effects (practice effect, fatigue effect, etc.) by varying the order of E, S, and A, and by having a 5 minute break in between treatments. We gathered mean scores from 14 subjects in Task 1 and 11 subjects in Task 2. Two means scores were compared for Task 1 using a Paired-Samples t-Test to observe differences between the two X-ray methods E and S. Furthermore,.
(14) 14. Marc Ericson C. Santos et al.. we conducted in depth comparisons between means scores for different box set ups within the same method. Three mean scores were analyzed for Task 2 using Repeated Measures ANOVA to observe differences among the three methods used (Alpha, Edges, and Saliency). For cases where ANOVA found a significant difference, post hoc tests using the Bonferroni correction were used to discover which specific means differed. All the statistical analyses were run using SPSSTM statistical software at a 0.05 level of significance.. 5.6 Hypotheses H1. To be legible, smaller objects require less occlusion cues than bigger objects when using both X-ray methods. H2. The edge-based AR X-ray will be less legible when there are many edges. This corresponds to box set ups Red, Brown, Green, and Crum. H3. The saliency-based AR X-ray will be less legible for when there are high contrast colors and lighting. This corresponds to box set ups Pink, Sil, Sil-Light, and Crum-light. H4. Objects will be identified faster when viewing through alpha blending than when viewing with the edge-based AR X-ray. H5. Objects will be identified faster when viewing through alpha blending than when viewing with the saliency-based AR X-ray. H6. Objects will be identified faster when viewing through the saliency-based AR X-ray than when viewing with the edge-based AR X-ray.. 6 Results and Discussion The first task is to recognize small targets. This task is aimed to represent judging small parts or details in the visualization. On the other hand, the second task is a higher-level task. From the abstract Landolt Cs, we moved to identifying meaningful virtual objects. The purpose of task 2 is to observe if partial occlusion prevents users from identifying the object inside the box. In task 1, we have gathered a total of 448 responses from 14 participants. Each participant viewed two sizes of Landolt Cs for each of the two AR Xray methods on each of the eight box set ups. In this experiment, we found evidences that support our hypotheses 1 and 2, but not 3. In task 2, we have gathered a total of 528 responses from 11 participants. Each participant viewed two objects in each of the eight box set ups using either the AR X-ray methods, or the alpha blending method. Results support our hypotheses 4 and 6, but not 5..
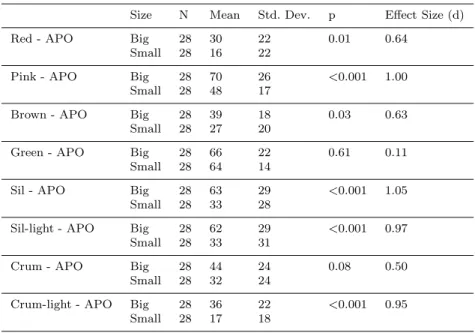
(15) Exploring Legibility of Augmented Reality X-ray. 15. Table 2 Overall APO for Big and Small Landolt Cs. Overall - APO. Size. N. Mean. Std. Dev.. p. Effect Size (d). Big Small. 224 224. 51 33. 29 27. <0.001. 0.62. Note: APO ranges from 0 to 100. Higher APO means that more occlusion can be tolerated.. Table 3 APO for Big and Small Landolt Cs per Box Set Up Size. N. Mean. Std. Dev.. p. Effect Size (d). Red - APO. Big Small. 28 28. 30 16. 22 22. 0.01. 0.64. Pink - APO. Big Small. 28 28. 70 48. 26 17. <0.001. 1.00. Brown - APO. Big Small. 28 28. 39 27. 18 20. 0.03. 0.63. Green - APO. Big Small. 28 28. 66 64. 22 14. 0.61. 0.11. Sil - APO. Big Small. 28 28. 63 33. 29 28. <0.001. 1.05. Sil-light - APO. Big Small. 28 28. 62 33. 29 31. <0.001. 0.97. Crum - APO. Big Small. 28 28. 44 32. 24 24. 0.08. 0.50. Crum-light - APO. Big Small. 28 28. 36 17. 22 18. <0.001. 0.95. 6.1 Less Occlusions for Smaller Objects We separated the APO specified by the participants according to the size of the Landolt Cs. Overall, they indicated a significantly lower APO for the small Landolt Cs with a moderate effect size, as shown in Table 2. This supports our hypothesis 1 that smaller target objects would require less occlusion cues to be legible. Although this result is not surprising, this result has an important implication for AR X-ray. Current AR X-ray methods extract occlusion cues regardless of the virtual object being viewed and the intention of the user. To improve the legibility of AR X-ray, future methods must consider knowledge of the virtual object and the user’s intention. For example, virtual objects can have an accompanying metadata that indicates which areas of the virtual object are small and important. With this information, the AR X-ray method can avoid occluding these parts. Another example would be to detect the area.
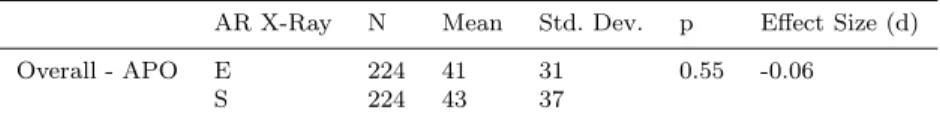
(16) 16. Marc Ericson C. Santos et al.. Table 4 Overall APO for AR X-Ray Methods. Overall - APO. AR X-Ray. N. Mean. Std. Dev.. p. Effect Size (d). E S. 224 224. 41 43. 31 37. 0.55. -0.06. of interest by tracking the user’s gaze. Similarly, the AR X-ray method could adapt by prioritizing the legibility of the area of interest. Aside from incorporating knowledge of the virtual object and the user’s intention in controlling partial occlusions, a straight-forward way to improve the legibility of AR X-ray is to control occlusion cues with user input. In our present work, we discussed in Section 4.1 how we implemented a simple slider for decreasing occlusion cues. Using such user input method is not only easier to implement, this approach also considers that different users can tolerate different levels of occlusions. In our experiments, we did observe high variability based on the standard deviations listed in Table 2. We can also see the same pattern for each box set up listed in Table 3. Except for Green and Crum set ups, users have indicated a significantly lower APO for the small Landolt Cs with a moderate to large effect size. Moreover, users have indicated different APO values for the different box set ups with high standard deviations.. 6.2 Variation in Tolerable Occlusions In this exploration, we selected various patterns on our box set ups to challenge the AR X-ray method. Our results in Table 4 shows that participants indicated almost equal APOs for the two methods. In other words, given our thresholding method discussed in Section 4.1, the participants indicated around the same threshold value for the two AR X-ray methods. However, the users did not indicate the same APO for each box set up listed in Table 5. Based on past empirical evaluations discussed in Section 2.3, researchers observed that edge-based AR X-ray becomes difficult to understand when there are many edges detected in the background. In our present work, we also observed that our edge-based AR X-ray was less legible than our saliency-based X-ray for box set ups with many edges. As shown in Table 5, participants indicated a lower APO for all boxes with many edges, namely, Red, Brown, Green, and Crum. However, it is only with the Brown box set up wherein the edge-based AR X-ray scored significantly lower with a moderate effect size. As such, only this result support our hypothesis 2. We observed marginal significance in the Crum box set up. We believe this particular set up is challenging for both AR X-ray methods. Aside from the many edges, the crumpled foil has sufficiently bright regions which hampers the saliency-based AR X-ray. Past empirical research indicates that saliency-based AR X-ray may suffer when high contrast color or bright lighting are concentrated in one area of the.
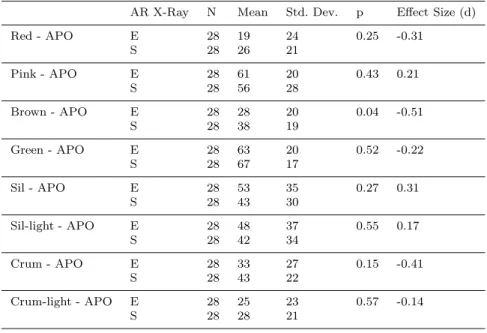
(17) Exploring Legibility of Augmented Reality X-ray. 17. Table 5 APO for AR X-Ray Methods per Box Set Up AR X-Ray. N. Mean. Std. Dev.. p. Effect Size (d). Red - APO. E S. 28 28. 19 26. 24 21. 0.25. -0.31. Pink - APO. E S. 28 28. 61 56. 20 28. 0.43. 0.21. Brown - APO. E S. 28 28. 28 38. 20 19. 0.04. -0.51. Green - APO. E S. 28 28. 63 67. 20 17. 0.52. -0.22. Sil - APO. E S. 28 28. 53 43. 35 30. 0.27. 0.31. Sil-light - APO. E S. 28 28. 48 42. 37 34. 0.55. 0.17. Crum - APO. E S. 28 28. 33 43. 27 22. 0.15. -0.41. Crum-light - APO. E S. 28 28. 25 28. 23 21. 0.57. -0.14. occluding object. For example, the pink box has thick pink and yellow rings on white background. Intuitively, the salient regions would be the entire pink and yellow areas. Another example would be the reflected light in sil-light and crum-light. The LED light caused an entire area to be bright. Intuitively, the salient regions would be these areas with high luminosity. In our present work, we observed that our saliency-based AR X-ray was less legible than our edge-based X-ray for some of the box set ups with high contrast color or bright lighting. As shown in Table 5, participants indicated a lower APO for boxes Pink, Sil, and Sil-light, but not Crum-light. However, all the differences we found are not significant, thus we do not have support for our hypothesis 3. We only observed a small effect size for box set ups Pink, Sil, and Sil-light. Although increasing the sample size could result in significant differences, we believe that this is unnecessary. Another improvement in the experimental design is to make an even more challenging lighting condition for saliencybased AR X-ray. However, this would also be unnecessary because such intense lighting conditions may not occur frequently in actual settings. In particular, we are interested in indoor applications, such as museums and classrooms, where lighting is not as dynamic compared to outdoors..
(18) 18. Marc Ericson C. Santos et al.. Table 6 Overall Descriptive Statistics for Task 2 Method. N. Mean (α). Std. Dev.. A E S. 11 11 11. 74 59 72. 7 10 4. Note: The α ranges from 0-100. Table 7 Summary of One-way Repeated Measures ANOVA for Alpha Values (α). Overall. df. df (Error). F. p. Effect Size (η2 ). 2. 20. 12.1. <0.001. 0.55. Table 8 Overall Pairwise Comparisons for Alpha Values I and J. Mean Diff. (I - J). Std. Error. p. A and E A and S E and S. 14 2 -13. 4 3 3. 0.009 1.000 0.006. 6.3 Faster Identification with Alpha Blending and Saliency-based AR X-Ray We computed the mean α for each participant, for each method. As discussed in Section 5.2, α and OIT have an indirect relationship. Higher α means faster identification time, and vice versa. We summarized the means and standard deviation of α in Table 6. Participants were faster in A, followed by S. We then conducted a repeated measures ANOVA to test these means scores. Mauchly’s Test of Sphericity indicated that the assumption of sphericity had not been violated, x2 (2) = 1.073, p = 0.585. There was a statistically significant difference in overall α among methods A, E, and S, F(2, 20) = 12.1, p<0.05 as shown in Table 7. Post hoc tests using the Bonferroni correction revealed that the mean difference between A and S was not significant. However, there was a significant difference between A and E, and E and S as shown in Table 8. This supports our hypotheses 4 and 6, but not 5. For the task of identifying an occluded object, participants using the saliencybased AR X-ray performed almost the same as when there are no preserved occlusion cues (alpha blending). However, we observed that edge-based AR X-ray significantly hampers object identification with a large effect size. 6.4 Object Identification for the Each Box Set Up We explored deeper into the results of Task 2 by conducting analysis on each box set up. Mauchly’s Test of Sphericity indicated that the assumption of.
(19) Exploring Legibility of Augmented Reality X-ray. 19. Table 9 Descriptive Statistics for Each Box Set Up Box Set Up. Method. N. Mean (α). Std. Dev.. Red. A E S. 11 11 11. 55 35 53. 11 23 12. Pink. A E S. 11 11 11. 81 77 80. 16 19 11. Brown. A E S. 11 11 11. 70 52 72. 15 15 10. Sil. A E S. 11 11 11. 84 78 82. 5 14 6. Sil-light. A E S. 11 11 11. 80 71 76. 9 14 10. Crum. A E S. 11 11 11. 72 57 73. 8 18 12. Crum-light. A E S. 11 11 11. 67 40 57. 10 25 16. Table 10 One-way Repeated Measures ANOVA for Alpha Values (α) for Each Box Set Up. Red Pink Brown Sil Sil-light Crum Crum-light. df. df (Error). F. p. Effect Size (η2 ). 2 2 2 2 2 2 2. 20 20 20 20 20 20 20. 5.2 0.2 8.5 1.5 1.5 6.2 5.8. 0.015 0.803 0.002 0.250 0.241 0.008 0.010. 0.34 0.22 0.46 0.13 0.13 0.38 0.37. sphericity had not been violated, except for the Green box set up x2 (2) = 8.499, p = 0.014. As such, we excluded the Green box set up in this discussion. Table 9 shows the descriptive statistics per box set up. The results for each individual box set up is similar to the overall results. It follows the pattern of almost equal α for A and S, with E lower than both. Results for Red, Brown, Crum, and Crum-light are significant with a large effect size (0.22 ≤ η 2 ≤ 0.46) as shown in Table 10. Post hoc tests using the Bonferroni correction identified significant differences between A and E, and between E and S. Looking at the pairwise comparisons in Table 11, E had a significantly lower α compared to A for Brown, Crum, and Crum-light. E had a significantly lower α compared to S.
(20) 20. Marc Ericson C. Santos et al.. Table 11 Summary of Pairwise Comparisons for Alpha Values (α) for Each Box Set Up Box Set Up. I and J. Mean Diff. (I - J). Std. Error. p. Red. A and E A and S E and S. 20 1 -18. 8 4 7. 0.113 1.000 0.090. Pink. A and E A and S E and S. 5 1 -3. 8 8 7. 1.000 1.000 1.000. Brown. A and E A and S E and S. 18 -2 -20. 6 5 5. 0.033 1.000 0.011. Sil. A and E A and S E and S. 7 2 -5. 4 3 5. 0.396 1.000 1.000. Sil-light. A and E A and S E and S. 9 4 -5. 5 5 6. 0.312 1.000 1.000. Crum. A and E A and S E and S. 15 -1 -16. 5 5 6. 0.037 1.000 0.056. Crum-light. A and E A and S E and S. 27 10 -17. 9 5 9. 0.042 0.293 0.249. for the Brown box set up. Moreover, there is partially significant differences between E and A, and between E and S for the Red box set up. Red, Brown, and Crum were among the four designs chosen particularly to challenge edge-based AR X-ray. These box set ups have plenty of edges that are kept as occlusion cues. Because of these edges, the occluded object becomes less legible. Thus, the participants needed significantly more time to identify the object. On the other hand, the saliency-based AR X-ray did not occlude as much for these four box set-ups. The box set ups Pink, Sil, Sil-light, and Crum-light were designs chosen to challenge saliency-based AR X-ray. Among these four, the saliency-based AR X-ray had the biggest difference with the Crum-light box set up. However, this difference was not significant.. 7 Conclusion Currently, many researchers are working on improving AR and its enabling technologies. AR X-ray is a useful visualization technique for many fields of application. To make successful applications, more user studies must be conducted to further understand how X-ray visualization methods affect depth perception and legibility of the virtual object..
(21) Exploring Legibility of Augmented Reality X-ray. 21. In our work, we designed two AR X-ray methods, namely edge-based AR X-ray and saliency-based AR X-ray. To create an X-ray illusion, we select important regions of the occluding real object and render it over the occluded virtual object. Logically, the more occlusion cues are placed over the virtual object, the more difficult it will be to see the virtual object. As such, it is important to control a parameter to adjust the amount of occlusion cues. We implemented these two AR X-ray methods on an iPad mini, using OpenCV and NMPT computer vision libraries. Using these computer libraries, we compute an importance map which represents the parts of the occluder that will be rendered on top of the occluded. For our application, we added a function to adjust the sensitivity for generating the importance map. We allowed the user to control this sensitivity using a slider. We used the prototypes to explore the legibility of the two AR X-ray methods. Our results confirmed smaller objects should have less occlusion cues to be legible. We observed that our edge-based AR X-ray was less legible when there are too many edges on the occluding real object. On the other hand, the saliency-based AR X-ray was less legible when there are high contrasts in color or bright lighting. For identifying larger objects, saliency-based AR X-ray allowed the users to perform better than with the edge-based AR Xray approach. Aside from automated adjustments, we recommend that future AR X-ray systems should have user inputs to adjust the amount of occlusion. This allows the user to fit the visualization according to his intentions and preferences. Insights from this work can be applied to developing future AR X-ray applications. For future work, it is necessary to conduct evaluations of AR X-ray for variations in occluding objects, lighting conditions and target audiences. Specific application areas, such as museums and educational settings would probably have differences in legibility requirements. As such, applying AR X-ray would also have to deal with the unique issues that arise due to the application area. Acknowledgements This work was supported by the Grant-in-Aid for JSPS Fellows, Grant Number 15J10186.. References 1. Avery, B., Sandor, C., Thomas, B.: Improving spatial perception for augmented reality x-ray vision. In: Procceedings of IEEE Virtual Reality Conference, pp. 79–82 (2009) 2. Bajura, M., Fuchs, H., Ohbuchi, R.: Merging virtual objects with the real world: Seeing ultrasound imagery within the patient. In: Proceedings of ACM SIGGRAPH Computer Graphics, vol. 26, pp. 203–210. ACM (1992) 3. Carmigniani, J., Furht, B., Anisetti, M., Ceravolo, P., Damiani, E., Ivkovic, M.: Augmented reality technologies, systems and applications. Multimedia Tools and Applications 51(1), 341–377 (2011) 4. Dey, A., Jarvis, G., Sandor, C., Reitmayr, G.: Tablet versus phone: Depth perception in handheld augmented reality. In: Proceedings of IEEE International Symposium on Mixed and Augmented Reality, pp. 187–196 (2012).
(22) 22. Marc Ericson C. Santos et al.. 5. Dey, A., Sandor, C.: Lessons learned: Evaluating visualizations for occluded objects in handheld augmented reality. International Journal of Human-Computer Studies 72, 704–716 (2014) 6. Furness, T.A.: The super cockpit and its human factors challenges. In: Proceedings of the Human Factors and Ergonomics Society Annual Meeting, vol. 30, pp. 48–52. SAGE Publications (1986) 7. Gabbard, J., Swan, J.: Usability engineering for augmented reality: Employing userbased studies to inform design. IEEE Transactions on Visualization and Computer Graphics 14(3), 513–525 (2008) 8. Gabbard, J., Swan, J., Hix, D., Kim, S.J., Fitch, G.: Active text drawing styles for outdoor augmented reality: A user-based study and design implications. In: IEEE Virtual Reality Conference, pp. 35–42 (2007) 9. Itti, L., Koch, C., Niebur, E.: A model of saliency-based visual attention for rapid scene analysis. Pattern Analysis and Machine Intelligence, IEEE Transactions on 20(11), 1254–1259 (1998) 10. Kalkofen, D., Mendez, E., Schmalstieg, D.: Interactive focus and context visualization for augmented reality. In: IEEE International Symposium on Mixed and Augmented Reality, pp. 191–201 (2007) 11. Kalkofen, D., Mendez, E., Schmalstieg, D.: Comprehensible visualization for augmented reality. IEEE Transactions on Visualization and Computer Graphics 15(2), 193–204 (2009) 12. Kalkofen, D., Veas, E., Zollmann, S., Steinberger, M., Schmalstieg, D.: Adaptive ghosted views for augmented reality. In: IEEE International Symposium on Mixed and Augmented Reality, pp. 1–9 (2013) 13. Kameda, Y., Takemasa, T., Ohta, Y.: Outdoor see-through vision utilizing surveillance cameras. In: IEEE International Symposium on Mixed and Augmented Reality, pp. 151–160 (2004) 14. Kourouthanassis, P., Boletsis, C., Lekakos, G.: Demystifying the design of mobile augmented reality applications. Multimedia Tools and Applications pp. 1–22 (2013) 15. Livingston, M.: Evaluating human factors in augmented reality systems. IEEE Computer Graphics and Applications 25(6), 6–9 (2005) 16. Livingston, M., Moser, K.: Effectiveness of occluded object representations at displaying ordinal depth information in augmented reality. In: IEEE Virtual Reality Conference, pp. 107–108 (2013) 17. Livingston, M.A., Dey, A., Sandor, C., Thomas, B.H.: Pursuit of x-ray vision for augmented reality. In: Human Factors in Augmented Reality Environments, pp. 67–107. Springer (2013) 18. Nielsen, J.: Usability Engineering. Elsevier (1994) 19. Peterson, S., Axholt, M., Cooper, M., Ellis, S.: Visual clutter management in augmented reality: Effects of three label separation methods on spatial judgments. In: IEEE Symposium on 3D User Interfaces, pp. 111–118 (2009) 20. Sandor, C., Cunningham, A., Dey, A., Mattila, V.V.: An augmented reality x-ray system based on visual saliency. In: IEEE International Symposium on Mixed and Augmented Reality, pp. 27–36 (2010) 21. Santos, M., Chen, A., Terawaki, M., Yamamoto, G., Taketomi, T., Miyazaki, J., Kato, H.: Augmented reality x-ray interaction in k-12 education: Theory, student perception and teacher evaluation. In: IEEE International Conference on Advanced Learning Technologies, pp. 141–145 (2013) 22. Santos, M.E.C., Chen, A., Taketomi, T., Yamamoto, G., Miyazaki, J., Kato, H.: Augmented reality learning experiences: Survey of prototype design and evaluation. IEEE Transactions on Learning Technologies 7(1), 38–56 (2014) 23. Santos, M.E.C., Polvi, J., Taketomi, T., Yamamoto, G., Sandor, C., Kato, H.: A usability scale for handheld augmented reality. In: ACM Symposium on Virtual Reality Software and Technology (2014) 24. Santos, M.E.C., Terawaki, M., Taketomi, T., Yamamoto, G., Kato, H.: Development of handheld augmented reality x-ray for k-12 settings. In: M. Chang, Y. Li (eds.) Smart Learning Environments, Lecture Notes in Educational Technology, pp. 199–219. Springer Berlin Heidelberg (2015).
(23) Exploring Legibility of Augmented Reality X-ray. 23. 25. Walther, D.: Interactions of visual attention and object recognition: computational modeling, algorithms, and psychophysics. Ph.D. thesis, California Institute of Technology (2006) 26. Zollmann, S., Kalkofen, D., Mendez, E., Reitmayr, G.: Image-based ghostings for single layer occlusions in augmented reality. In: IEEE International Symposium on Mixed and Augmented Reality, pp. 19–26 (2010).
(24)
図
+7

関連したドキュメント
Whereas tube voltages and HVLs for these four X-ray units did not significantly change over the 103-week course, the outputs of these four X-ray units increased gradually as
We used this software package to estimate percentage dose reduction values of the average organ dose (indicated as 'Average dose in total body' in PCXMC) and effective dose for
The general method of measuring the half-value layer (HVL) for X-ray computed tomography (CT) using square aluminum-sheet filters is inconvenient in that the X-ray tube has to be
Positions where the Nimsum of the quotients of the pile sizes divided by 2 is 0, and where the restriction is “the number of sticks taken must not be equivalent to 1 modulo
He thereby extended his method to the investigation of boundary value problems of couple-stress elasticity, thermoelasticity and other generalized models of an elastic
Keywords: continuous time random walk, Brownian motion, collision time, skew Young tableaux, tandem queue.. AMS 2000 Subject Classification: Primary:
More general problem of evaluation of higher derivatives of Bessel and Macdonald functions of arbitrary order has been solved by Brychkov in [7].. However, much more
Key words and phrases: higher order difference equation, periodic solution, global attractivity, Riccati difference equation, population model.. Received October 6, 2017,
