INTRODUCTION
Retinitis pigmentosa (RP) is a slowly progressive inherited retinal disease, and patients with RP have reduced visual function mainly because of degen-eration of the rod and cone photoreceptors and reti-nal pigment epithelium (RPE) (1-3). A clinical di-agnosis of RP is made based on the family history, presence of nyctalopia, visual field constriction, char-acteristic pigmentary retinal changes, bone spicule pigmentation in the periphery, and reduction of the
standard full-field electroretinograms (ERGs) con-sistent with rod-cone dystrophy (4). Currently, there is no treatment that can lead to a recovery of the decreased vision or halt the progression of the dis-ease process. RP is one of the main causes of ac-quired blindness in developed countries.
Abnormal ERGs are already present in the first decade of life (5), and the amplitudes of the ERGs and size of the visual fields decrease exponential during the course of RP. These changes are presum-ably due to a degeneration of the photoreceptors (6). The early decrease in the ERG taken with the histopathologic abnormalities found in postmortem human RP retinas (3) indicates that the retinas of eyes with RP are abnormal from early life and pro-gresses to greater severity. Several genetic muta-tions have been found to cause RP, e.g., X-linked,
REVIEW
Diagnostic imaging in patients with retinitis pigmentosa
Yoshinori Mitamura, Sayaka Mitamura-Aizawa, Toshihiko Nagasawa,
Takashi Katome, Hiroshi Eguchi, and Takeshi Naito
Department of Ophthalmology, Institute of Health Biosciences, the University of Tokushima Graduate School, Tokushima, Japan
Abstract : Retinitis pigmentosa (RP) is a progressive inherited retinal disease, and patients with RP have reduced visual function caused by a degeneration of the photoreceptors and retinal pigment epithelium (RPE). At the end stage of RP, the degeneration of the photoreceptors in the fovea reduces central vision, and RP is one of the main causes of acquired blindness in developed countries. Therefore, morphological and functional as-sessments of the photoreceptors in the macula area can be useful in estimating the re-sidual retinal function in RP patients. Optical coherence tomography (OCT) is a well-established method of examining the retinal architecture in situ. The photoreceptor in-ner/outer segment (IS/OS) junction is observed as a distinct, highly reflective line by OCT. The presence of the IS/OS junction in the OCT images is essential for normal visual func-tion. Fundus autofluorescence (FAF) results from the accumulation of lipofuscin in the RPE cells and has been used to investigate RPE and retinal function. More than one-half of RP patients have an abnormally high density parafoveal FAF ring (AF ring). The AF ring represents the border between functional and dysfunctional retina. In this review, we shall summarize recent progress on diagnostic imaging in eyes with RP. J. Med. Invest. 59 : 1-11, February, 2012
Keywords : diagnostic imaging, fundus autofluorescence, optical coherence tomography, retinal photoreceptor cell, retinitis pigmentosa
Received for publication September 20, 2011 ; accepted October 5, 2011.
Address correspondence and reprint requests to Yoshinori Mitamura, Department of Ophthalmology, Institute of Health Biosciences, the University of Tokushima Graduate School, 3 18 15 Kuramoto, Tokushima 770 8503, Japan and Fax : + 81 88 -631 - 4848.
autosomal dominant, and autosomal recessive con-ditions. However, RP without a known family his-tory can also occur (1). In spite of genetic diversity, many RP patients have similar symptoms, signs, and retinal histopathology (1-3).
In RP patient, the retinal degeneration usually starts with degeneration of the rod photoreceptors which leads to nyctalopia. With advancement, the retinal degeneration gives rise to a characteristic ring-shaped scotoma in the mid-periphery. The sco-toma can then expand to the periphery and macula. The earliest histopathologic change in all forms of RP is a shortening of the rod outer segments (3). As the disease progresses, the cone photoreceptors also degenerate which then reduces central vision (2, 3). Therefore, morphological and functional as-sessment of the photoreceptors in the macular area can be useful in estimating the remaining retinal function in advanced RP patients.
Optical coherence tomography (OCT) is a well-established method of examining the retinal archi-tecture in situ. Another method used to study the retina and RPE is by examining fundus autofluores-cence (FAF) which results from an accumulation of lipofuscin in the RPE cells. In this review, we shall summarize the recent findings on diagnostic imaging in eyes with RP.
OPTICAL COHERENCE TOMOGRAPHY
(OCT)
OCT was introduced to ophthalmology over a decade ago, and it has been used to obtain in situ images of the retina of eyes with various types of retinal diseases. The ease of obtaining informative images by OCT has changed the diagnostic strategy used by ophthalmologists.
OCT is an optical analog of ultrasound imaging (7). Light can replace ultrasound because of the clear optical media of the eye. Using light instead of ultrasound is advantageous because shorter wave-lengths permit higher resolution images. More-over, no contact medium is required, as the differ-ence in optical impedance, i.e., the differdiffer-ence in the refractive index between air and tissue, is not as large as the acoustic impedance. Unfortunately, the speed of light exceeds that of sound by a fac-tor 15
!
104, which means that the optical echoescannot be measured directly in contrast to ultra-sonic echoes. To detect light echoes, OCT relies on a classical optical technique known as low coherence
interferometry, in which the signal-carrying light returning from the eye interferes with light that has travelled a known path length.
Recently, a distinct, highly reflective line was de-tected just above the RPE layer in the images ob-tained by OCT (8, 9). This line has been identified as the photoreceptor inner/outer segment (IS/OS) junction (Figure 1). The integrity of this line is im-portant because a distinct and continuous line indi-cates a normal alignment of membranous discs in the photoreceptor outer segments (10). Because the alignment of the discs is necessary for the normal functioning of the photoreceptors, the presence of a normal IS/OS line in the OCT images most likely indicates normally functioning photoreceptors. We have reported that the presence of a distinct and continuous IS/OS line in the OCT images is corre-lated with the recovery of good vision after intraocu-lar surgery for macuintraocu-lar hole or epiretinal membrane (11-13). An intact IS/OS line was highly correlated with normal visual function.
Several OCT studies have been conducted on RP patients to determine whether there is a significant correlation between the retinal microstructures and visual function (14-16). Sandberg et al. (15) exam-ined the IS/OS line in RP patients, and they re-ported that an intact IS/OS line was significantly cor-related with the visual acuity. However, they exam-ined the IS/OS in only the central 1 mm area and examined the IS/OS using false-color images in which the IS/OS line is sometimes difficult to dif-ferentiate from the RPE layer especially in the high-signal areas of the OCT images (17). Witkin et al. (14) reported that the central foveal thickness and foveal outer segments lengths were significantly Figure 1. Histology of normal retina (A) and optical coherence tomographic (OCT) image (B) from a normal subject. Photore-ceptor inner/outer segment (IS/OS) junction line is clearly seen in the OCT image.
associated with the visual acuity. They suggested that the foveal thinning was primarily due to photo-receptor loss.
We have examined whether a significant corre-lation is present between the visual acuity or the central foveal thickness and the integrity of the IS/ OS line observed in the OCT grayscale images in 300 eyes of 163 patients with RP patients (18). Gray-scale OCT images were used because they provide a more accurate identification and measurement of the length of the IS/OS line (17). The appearance of the IS/OS line in the OCT images at the fovea was graded from 1 to 3 : Grade 1, IS/OS line not visible ; Grade 2, disrupted IS/OS line ; and Grade 3, normal continuous IS/OS line (Figure 2). To grade the cases, we measured the length of the IS/ OS which extended from just beneath the fovea, and defined eyes as Grade 3 when the length of the continuous IS/OS line was"0.5 mm. The central foveal thickness was measured manually using the internal program on the OCT images at the thinnest point of the fovea.
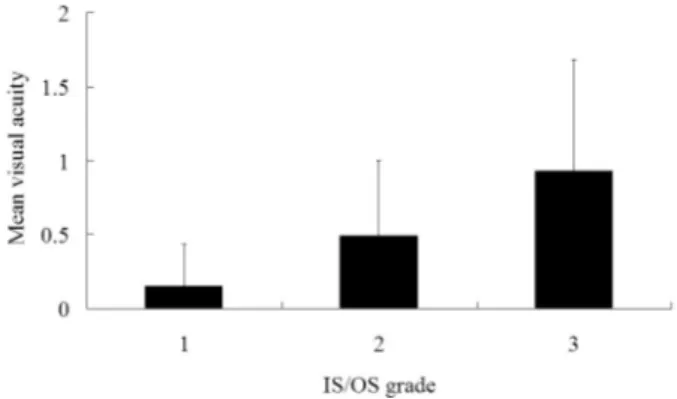
Our analyses showed that the IS/OS line was not detected (Grade 1) in 31.0% of the eyes, an abnor-mal IS/OS (Grade 2) was detected in 22.3%, and the IS/OS was normal (Grade 3) in 46.7% of the eyes in patients with RP. The correlation between the IS/OS grade and age was not significant (P =
0.5536), but the IS/OS grade was significantly cor-related with the visual acuity (Figure 3) and the cen-tral foveal thickness (both P!0.0001). The visual acuity was significantly better in Grade 3 eyes than Grades 1 and 2 (both P!0.0001). The central fo-veal thickness was significantly thinner in Grade 1 eyes than in Grades 2 and 3 (both P!0.0001). In Grade 3 eyes, the mean length of the IS/OS line was 2.51!1.42 mm (!SD), and the length of the IS/OS line was significantly correlated with the vis-ual acuity (r=0.375, P!0.0001).
We concluded that the presence of the IS/OS line was associated with better visual acuity and thicker fovea in RP patients. Our findings showed that OCT can be used to assess the integrity of the photoreceptor cells in situ, and the significant cor-relation between the visual acuity and presence or length of the IS/OS line indicated that the IS/OS line might be an important parameter that can be used to monitor RP patients.
The visual function of patients is usually assessed by the conventional visual acuity. However, the vis-ual acuity represents only the visvis-ual function at the foveal center. The retinal sensitivity is a better in-dicator of the quality of macular function because it represents the sensitivity of a larger retinal area than the conventional distant visual acuity (19, 20). The ability to perform daily tasks is strongly depend-ent on an intact cdepend-entral visual field, therefore the retinal sensitivity could be a better indicator of prac-tical visual capabilities of patients.
We examined whether a significant correlation was present between the retinal sensitivity and the length of the IS/OS line in RP patients (21).
Sixty-seven eyes of 36 consecutive patients with Figure 3 :Mean visual acuity in decimal units as a function of the grade of the photoreceptor inner/outer segment (IS/OS) junction. The difference in the mean visual acuity among the three groups is statistically significant (P!0.0001).
Figure 2. Grading of photoreceptor inner/outer segment (IS/ OS) junction.
The left column shows fundus photographs, and the right col-umn shows optical coherence tomographic (OCT) images. In the fundus photographs, the white lines indicate the direction of the OCT scan. (A, B) An eye classified as Grade 1 without an IS/OS line. (C, D) An eye classified as Grade 2 with an abnor-mal IS/OS line. White arrow indicates a disrupted IS/OS line. (E, F) An eye classified as Grade 3 with a normal IS/OS line. White arrow points to the continuous IS/OS line.
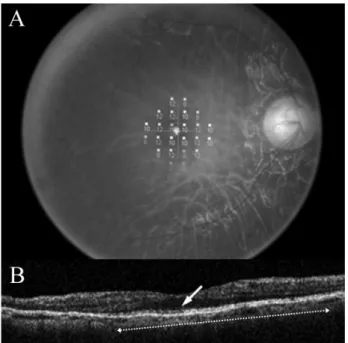
RP were examined. The recently introduced fundus-related microperimeter, Micro Perimeter-1 (MP-1) (Nidek, Gamagori, Japan) was used to determine the mean retinal sensitivity at 24 locations covering the central 10"(Figure 4). MP1 can be used to ob-tain quantitative and reliable measurements of the retinal sensitivity by tracking eye movements while
the patient is focused on a fixation target (19, 20). The length of the IS/OS line in the fovea was meas-ured using the internal program of the OCT. Our findings showed that the length of the IS/OS line was significantly correlated with the mean retinal sensitivity (r=0.614, P!0.0001 ; Figure 5).
Consistent with our results, Fischer et al. (22) reported that the area of the visual field (Goldmann perimetry isopter I4e) was significantly correlated with the IS/OS length. It has also been reported that the photoreceptor outer segment length (dis-tance between RPE to IS/OS line) decreases line-arly with a reduction of local field sensitivity (6). Jacobson et al. (23) reported that the extent of nor-mal laminar retinal architecture evaluated by OCT corresponded to the extent of normal visual function evaluated by static chromatic perimetry. These find-ings suggested that the length of the IS/OS line is most likely correlated with retinal function in RP patients.
FUNDUS AUTOFLUORESCENCE (FAF)
FAF imaging is another noninvasive method of assessing the retina and RPE. The autofluores-cence of the fundus results from the accumulation of lipofuscin pigment in the RPE cells, and it has been used to investigate eyes with different types of retinal diseases (24-27). Lipofuscin accumulates in lysosomes as a by-product of the degradation of the photoreceptor outer segments (28). A normal Figure 4. Microperimetric map and optical coherence
to-mographic (OCT) images from an eye in which a continuous photoreceptor inner/outer segment (IS/OS) junction was de-tected. (A) Microperimetric map image of a 60 - year - old man with retinitis pigmentosa. Twenty - four stimulus locations cov-ering the central 10"field were tested. The mean retinal sensi-tivity at the 24 locations is 9.6 dB. (B) OCT image of a 5 - mm horizontal scan. The IS/OS line can be observed as a distinct highly reflective line (white arrow). The length of the IS/OS was computed to be 3.6 mm (white dotted arrow).
Figure 5. Correlation between the length of the photoreceptor inner/outer segment (IS/OS) junction and the retinal sensitivity. There is a significant positive correlation between the length of the IS/OS line and the retinal sensitivity (r = 0.614, P!0.0001). The solid line represents the linear regression curve (y = 5.898 + 2.088x).
or near-normal FAF pattern indicates that the toreceptors are intact, and the integrity of the pho-toreceptor/RPE complex is normal (28). Normal photoreceptor function is dependent on normal RPE cell function, and its contribution to the visual cycle and the constant phagocytosis of shed distal outer segments, a process involved in the renewal of pho-toreceptor discs. Abnormally high levels of FAF in-dicate abnormal metabolism in the RPE cells ; viz., a high turnover of photoreceptor outer segments, disrupted phagocytosis, or an intrinsic defect in the ability of the RPE to recycle the phagosomes (29). Decreased or absent FAF indicates RPE atrophy, loss of photoreceptors, or the presence of materials between the RPE and camera that attenuate the FAF signal.
FAF images can be obtained with a confocal scan-ning laser ophthalmoscope or with a conventional fundus camera-based system. In the confocal scan-ning laser ophthalmoscope, the optically-pumped solid state laser (488 nm) is used for excitation, and a!500 nm barrier filter is used to detected the FAF. FAF images of a rectangular 30-degree field of view are recorded through a dilated pupil. Us-ing image analysis software, a series of images is summed to enhance the signal-to-noise ratio, and an averaged single image is analyzed. The fundus camera-based system used a conventional fundus camera with a band pass filter centered at 580 nm (bandwidth, 500-610 nm) for the excitation light and a matched barrier filter centered at 695 nm (bandwidth, 675-715 nm ; Spectrotech, Saugus, MA, USA) for the observation light (30, 31).
Several FAF patterns have been observed in tients with RP, and more than half of the RP pa-tients have an abnormally high density parafoveal FAF ring (AF ring ; Figure 6) (26). Murakami et al. (29) classified the eyes of RP patients according to three types of abnormal FAF pattern ; 1) those with an AF ring, 2) those with an abnormal central FAF, i.e., high density disciform FAF spreading centrifu-gally from the fovea, and 3) the absence of both patterns. They reported that an AF ring was de-tected in 59% of RP patients, an abnormal central FAF in 18%, and an absence of both patterns in 24% (29). We have found that the AF ring was present in 63 (57.8%) of 109 eyes with typical RP (32).
The AF ring is considered to represent the border between functional and dysfunctional retina, and the edge of the ring corresponds with the inner mar-gin of the visual field defect (25-27, 33). Popovic et al. (26) found that the radius of the AF ring was
strongly correlated with retinal sensitivity. We have also found that the diameter of the AF ring was significantly correlated with retinal sensitivity (32). Fleckenstein et al. (34) and Lima et al. (35) reported that a disruption of the IS/OS line and a decrease in the outer nuclear layer thickness were found across the AF ring using OCT. It has also been re-ported that the diameter of the AF ring was signifi-cantly correlated with the length of the IS/OS line in 20 patients with RP (29). We have reported that the diameter and area of the AF ring were signifi-cantly correlated with the length of the IS/OS line (32). Taken together, the AF ring is significantly associated with retinal function and the length of the IS/OS line.
Changes in RPE function in RP patients is con-sidered to be a secondary process that can result from increased metabolic load on the RPE due to photoreceptor apoptosis (26, 36). Abnormal hyper-fluorescence that is seen in the AF ring may indi-cate an abnormally high rate of phagocytosis of de-generated photoreceptors (29, 34, 35). Wakabayashi Figure 6. Fundus photograph (A) and fundus autofluorescence (FAF) image (B) of an eye with retinitis pigmentosa (58 year -old man). An abnormal parafoveal ring of high density FAF (AF ring) can be seen in the FAF image (black dotted line).
et al. (37) reported that the AF ring might represent the regional distribution of active photoreceptor de-generation and a region of higher rate of phagocy-tosis of outer segments by the RPE. When the lipo-fuscin accumulation reached a critical level, which would cause an FAF signal close to the maximum intensity, the RPE cells die with a concomitant loss of lipofuscin granules. The death of photoreceptor cells with RPE atrophy leads to the absence of FAF (26) that can be seen in the peripheral area of RP eyes. Murakami et al. (29) also suggested that pho-toreceptor death may occur before the RPE degen-eration in RP patients with an AF ring. However, clinicopathologic analysis is needed to determine whether a precise association exists between the AF ring and the photoreceptor status.
CHANGES OF IMAGING DURING THE
DIS-EASE PROGRESSION
In RP patients, several OCT studies have shown a significant correlation between the presence and
continuity of the IS/OS line and the visual function (14-16). On the other hand, the AF ring represents a transition between abnormal paracentral and nor-mal central cone system function and corresponds to the inner margin of the visual field defect (25-27). However, the changes in IS/OS or AF ring dur-ing the progression of RP was undetermined.
We had evaluated the changes of AF ring and IS/ OS line in relation to visual function during the pro-gression of RP (32). The AF ring was examined in 50 eyes of 26 patients with typical RP. In addition, OCT and microperimetry were performed on these patients. During the follow-up period of"2 years, the changes in the diameter and area of the AF ring, the length of the IS/OS line, visual acuity, and mean retinal sensitivity in the central 10#were determined (Figure 7). We found that the diameter and area of the AF ring, the length of the IS/OS line, visual acu-ity, and mean retinal sensitivity decreased signifi-cantly during the follow-up period (all, P!0.0001). The decrease in the AF ring diameter was signifi-cantly correlated with the decrease in retinal sen-sitivity (P=0.0105), visual acuity (P=0.0252), and
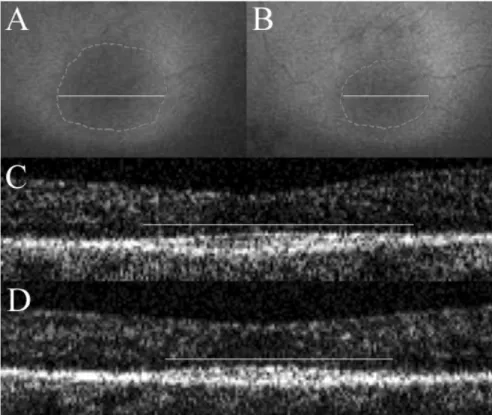
Figure 7. Fundus autofluorescence (FAF) images and optical coherence tomographic (OCT) images of an eye with retinitis pig-mentosa (59 - year - old woman).
(A, B) FAF images at the baseline (A) and the final visit (B). A progressive constriction of an abnormal parafoveal ring of high den-sity FAF (AF ring) can be seen. Gray dotted lines indicate the area of the AF ring and white lines indicate the diameter of the AF ring.
(C, D) OCT images of a horizontal scan at the baseline (C) and the final visit (D). The photoreceptor inner and outer segment (IS/ OS) junction line can be observed as a distinct highly reflective line. A slight decrease in the length of the IS/OS line can be seen. White lines indicate the IS/OS lengths.
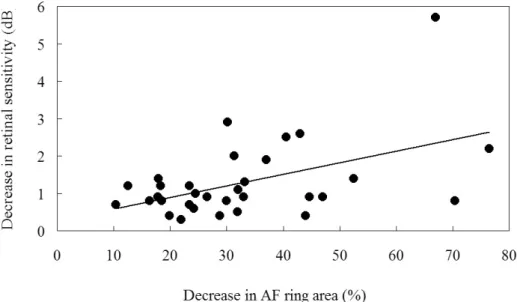
length of the IS/OS line (P=0.0015 ; Figure 8). The decrease in AF ring area was significantly correlated with the decrease in retinal sensitivity (P=0.0047 ; Figure 9), visual acuity (P=0.0026), and length of IS/OS line (P=0.0011). The decrease in the length of the IS/OS line was significantly correlated with the decrease in retinal sensitivity (P=0.0018), and visual acuity (P=0.0291).
Wakabayashi et al. (37) also reported that a pro-gressive reduction in the size of the AF ring was accompanied by a decrease in the area where the
IS/OS line was present during a mean follow-up pe-riod of 3.1 years. Most recently, Robson et al. (38) reported that the AF ring was progressively de-creased in 17 patients after a mean follow-up period of 3.9 years. They also reported that the radius of the AF ring was reduced by up to 40% with a mean rate of decrease between 0.8%/year to 15.8%/year. In addition, they observed that a small AF ring was replaced by areas of RPE atrophy with a consequent decrease in the visual acuity during 6 years of follow-up. Taken together, the progressive constriction of
Figure 8. Correlation between the decrease in the diameter of the autofluorescence ring (AF ring) and decrease in the length of the photoreceptor inner/outer segment (IS/OS) junction line. There is a significant positive correlation between decrease in the AF ring diameter and decrease in the IS/OS length (r = 0.531, P = 0.0015). The solid line represents the linear regression curve (y = 7.594 + 0.467x). A decrease in the AF ring diameter and the IS/OS length are presented as a ratio of the decrease from the baseline divided by the value at the baseline.
Figure 9. Correlation between decrease in the area of the autofluorescence ring (AF ring) and decrease in the retinal sensitivity. There is a significant positive correlation between decrease in the AF ring area and decrease in the retinal sensitivity (r = 0.482, P = 0.0047). The solid line represents the linear regression curve (y = 0.278 + 0.031x). Decrease in the AF ring area was presented as a ratio of the decrease from the baseline divided by the value at the baseline.
the AF ring reflects the morphological changes of the photoreceptors during the progression of RP and is associated with a worsening of visual function.
SPECTRAL-DOMAIN OPTICAL COHERENCE
TOMOGRAPHY (SD-OCT)
With the most recent improvements of OCT, the pathological changes of retina can be observed in much greater detail (13). Spectral-domain OCT (SD-OCT) uses low-coherence interferometry to detect light echoes, and uses a spectrometer and high-speed camera to obtain the images. The SD-OCT instrument is based on the mathematical basis of Fourier transformation (39). This eponym derives from the French mathematician Joseph Fourier, who described the decomposition of a periodic tion into a sum of simple sinusoidal oscillating func-tions. Because the application of his formula has the effect of measuring all echoes of light simultane-ously, as compared with sequentially in the case of conventional OCT, SD-OCT significantly increases the amount of data acquired in each session. This ability results in a significant reduction of motion artifacts and an increase in the signal-to-noise ratio compared with conventional OCTs.
The axial resolution of conventional OCT instru-ment, the time-domain OCT, was 10-20μm while the SD-OCT has a 5 to 6μm axial resolution. This has improved the ability to detect intraretinal mi-crostructures and to identify pathologic changes
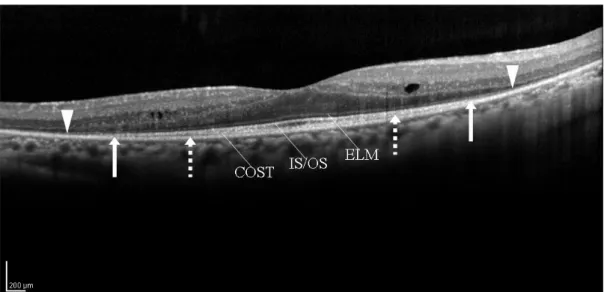
in the retinal architecture in various diseases. The imaging speed of SD-OCT is up to 100 times the speed of conventional OCT. Therefore, SD-OCT can clearly delineate not only the IS/OS junction but also the external limiting membrane (ELM ; junc-tion between the inner segments and the Müller cells) and the cone outer segment tips (COST) line (Figure 10).
Using SD-OCT, Wakabayashi et al. (37) reported that the diameter of the AF ring was correlated sig-nificantly with the length of the IS/OS line in eyes with RP. The area outside the AF ring corresponded with the area where the IS/OS junction and ELM were not detected. They reported that the border of the AF ring demarcated the border between the central retina with preservation of the IS/OS junc-tion and ELM, and the more peripheral retina with a loss of these microstructures. They also reported that the transverse extent of the preserved ELM was significantly larger than that of the IS/OS line in eyes with RP. In our preliminary study, we also observed that the length of the ELM was signifi-cantly longer than that of the IS/OS line, and it was significantly correlated with the length of the IS/ OS line. In addition, the length of the COST line was significantly shorter than that of IS/OS line. The lengths of the ELM, IS/OS, and COST lines were significantly associated with visual function. These results suggested that retinal layer may become disorganized first at the COST line, followed by the IS/OS line, and finally the ELM.
Figure 10. Spectral - domain optical coherence tomographic (SD- OCT) image of an eye with retinitis pigmentosa (52 - year - old man). In addition to photoreceptor inner/outer segment (IS/OS) junction line, the external limiting membrane (ELM) and cone outer seg-ment tips (COST) line are clearly seen in the SD- OCT image. White dotted arrows indicate an end point of COST line. White arrows indicate an end point of IS/OS line, and white arrow heads an end point of ELM line.
CONCLUSIONS
In RP patients, the presence and continuity of the IS/OS line is associated with good visual function. In addition, the large AF ring is associated with good retinal function and the good preservation of the IS/OS line. During the progression of RP, the size of AF ring decreases, and this is accompanied by a shortening of the length of the IS/OS line, a decrease in retinal sensitivity, and a worsening of visual acuity. The decrease in the diameter of the AF ring is significantly correlated with the decrease in retinal sensitivity, visual acuity, and length of the IS/OS line. Moreover, the decrease in area of the AF ring is significantly correlated with the decrease in retinal sensitivity, visual acuity, and IS/OS length. Taken together, the AF ring and the IS/OS line may be important parameters to monitor RP patients. Further studies with high resolution images of SD-OCT should lead to better understanding of the re-lationship between the microstructure of the macu-lar photoreceptor layer and visual function in RP patients.
CONFLICT OR COMMERCIAL INTEREST
None for each author
ACKNOWLEDGEMENTS
This work was supported in part by grant-in aid 22591929 (to Y.M.) from the Ministry of Education, Science, Sports and Culture, Japan.
REFERENCES
1. Berson EL : Retinitis pigmentosa : The Frieden-wald Lecture. Invest Ophthalmol Vis Sci 34 : 1659-1676, 1993.
2. van Soest S, Westerveld A, de Jong PT, Bleeker-Wagemakers EM, Bergen AA : Retini-tis pigmentosa : defined from a molecular point of view. Surv Ophthalmol 43 : 321-334, 1999. 3. Milam AH, Li ZY, Fariss RN : Histology of the
human retina in retinitis pigmentosa. Prog Retin Eye Res 17 : 175-205, 1998.
4. Marmor MF, Holder GE, Seeliger MW,
Yamamoto S : International Society for Clinical Electrophysiology of Vision. Standard for clinical
electroretinography (2004 update). Doc Oph-thalmol 108 : 107-114, 2004
5. Hartong DT, Berson EL, Dryja TP : Retinitis pigmentosa. Lancet 368 : 1795-1809, 2006 6. Rangaswamy NV, Patel HM, Locke KG, Hood
DC, Birch DG : A comparison of visual field sensitivity to photoreceptor thickness in retinitis pigmentosa. Invest Ophthalmol Vis Sci 51 : 4213-4219, 2010
7. van Velthoven ME, Faber DJ, Verbraak FD, van Leeuwen TG, de Smet MD : Recent devel-opments in optical coherence tomography for imaging the retina. Prog Retin Eye Res 26 : 57-77, 2007
8. Gloesmann M, Hermann B, Schubert C,
Sattmann H, Ahnelt PK, Drexler W : Histologic correlation of pig retina radial stratification with ultrahigh-resolution optical coherence tomogra-phy. Invest Ophthalmol Vis Sci 44 : 1696-1703, 2003
9. Anger EM, Unterhuber A, Hermann B,
Sattmann H, Schubert C, Morgan JE, Cowey A, Ahnelt PK, Drexler W : Ultrahigh resolution optical coherence tomography of the monkey fovea. Identification of retinal sublayers by cor-relation with semithin histology sections. Exp Eye Res 78 : 1117-1125, 2004
10. Ko TH, Fujimoto JG, Duker JS, Paunescu LA, Drexler W, Baumal CR, Puliafito CA, Reichel E, Rogers AH, Schuman JS : Comparison of ultrahigh- and standard- resolution optical co-herence tomography for imaging macular hole pathology and repair. Ophthalmology 111 : 2033-2043, 2004
11. Baba T, Yamamoto S, Arai M, Arai E, Sugawara T, Mitamura Y, Mizunoya S : Correlation of vis-ual recovery and presence of photoreceptor in-ner/outer segment junction in optical coher-ence images after successful macular hole re-pair. Retina 28 : 453-458, 2008
12. Mitamura Y, Aizawa S, Baba T, Hagiwara A, Yamamoto S : Correlation between retinal sen-sitivity and photoreceptor inner/outer segment junction in patients with retinitis pigmentosa. Br J Ophthalmol 93 : 126-127, 2009
13. Ooka E, Mitamura Y, Baba T, Kitahashi M, Oshitari T, Yamamoto S : Foveal microstruc-ture on spectral-domain optical coherence to-mographic images and visual function after macular hole surgery. Am J Ophthalmol 152 : 283-290, 2011
Drexler W, Schuman JS, Reichel E, Duker JS : Ultra-high resolution optical coherence to-mography assessment of photoreceptors in retinitis pigmentosa and related diseases. Am J Ophthalmol 142 : 945-952, 2006
15. Sandberg MA, Brockhurst RJ, Gaudio AR, Berson EL : The association between visual acuity and central retinal thickness in retinitis pigmentosa. Invest Ophthalmol Vis Sci 46 : 3349-3354, 2005
16. Matsuo T, Morimoto N : Visual acuity and peri-macular retinal layers detected by optical co-herence tomography in patients with retinitis pigmentosa. Br J Ophthalmol 91 : 888-890, 2007
17. Ishikawa H, Gürses-Ozden R, Hoh ST, Dou HL, Liebmann JM, Ritch R : Grayscale and pro-portion-corrected optical coherence tomogra-phy images. Ophthalmic Surg Lasers 31 : 223-228, 2000
18. Aizawa S, Mitamura Y, Baba T, Hagiwara A, Ogata K, Yamamoto S : Correlation between visual function and photoreceptor inner/outer segment junction in patients with retinitis pig-mentosa. Eye 23 : 304-308, 2009
19. Nakamura Y, Mitamura Y, Ogata K, Arai M, Takatsuna Y, Yamamoto S : Functional and morphological changes of macula after sub-threshold micropulse diode laser photocoagu-lation for diabetic macular oedema. Eye 24 : 784-788, 2010
20. Okada K, Kubota-Taniai M, Kitahashi M, Baba T, Mitamura Y, Yamamoto S : Changes in vis-ual function and thickness of macula after pho-todynamic therapy for age-related macular de-generationin. Clin Ophthalmol 3 : 483-488, 2009 21. Mitamura Y, Aizawa S, Baba T, Hagiwara A, Yamamoto S : Correlation between retinal sen-sitivity and photoreceptor inner/outer segment junction in patients with retinitis pigmentosa. Br J Ophthalmol 93 : 126-127, 2009
22. Fischer MD, Fleischhauer JC, Gillies MC, Sutter FK, Helbig H, Barthelmes D : A new method to monitor visual field defects caused by photoreceptor degeneration by quantitative optical coherence tomography. Invest Ophthal-mol Vis Sci 49 : 3617-3621, 2008
23. Jacobson SG, Roman AJ, Aleman TS, Sumaroka A, Herrera W, Windsor EA, Atkinson LA, Schwartz SB, Steinberg JD, Cideciyan AV : Normal central retinal function and struc-ture preserved in retinitis pigmentosa. Invest
Ophthalmol Vis Sci 51 : 1079-1085, 2010 24. Delori FC, Staurenghi G, Arend O, Dorey CK,
Goger DG, Weiter JJ : In vivo measurement of lipofuscin in Stargardt’s disease-Fundus flavimaculatus. Invest Ophthalmol Vis Sci 36 : 2327-2331, 1995
25. Robson AG, Saihan Z, Jenkins SA, Fitzke FW, Bird AC, Webster AR, Holder GE : Functional characterization and serial imaging of abnor-mal fundus autofluorescence in patients with retinitis pigmentosa and normal visual acuity. Br J Ophthalmol 90 : 472-479, 2006
26. Popovic P, Jarc-Vidmar M, Hawlina M : Abnor-mal fundus autofluorescence in relation to reti-nal function in patients with retinitis pigmen-tosa. Graefes Arch Clin Exp Ophthalmol 243 : 1018-1027, 2005
27. Robson AG, Egan CA, Luong VA, Bird AC, Holder GE, Fitzke FW : Comparison of fundus autofluorescence with photopic and scotopic fine matrix mapping in patients with retinitis pigmentosa and normal visual acuity. Invest Ophthalmol Vis Sci 45 : 4119-4125, 2004 28. Kennedy CJ, Rakoczy PE, Constable IJ :
Lipo-fuscin of the retinal pigment epithelium : a re-view. Eye 9 : 763-771, 1995
29. Murakami T, Akimoto M, Ooto S, Suzuki T, Ikeda H, Kawagoe N, Takahashi M, Yoshimura N : Association between abnormal autofluores-cence and photoreceptor disorganization in retinitis pigmentosa. Am J Ophthalmol 145 : 687-694, 2008
30. Spaide RF : Fundus autofluorescence and age-related macular degeneration. Ophthalmology 110 : 392-399, 2003
31. Spaide RF, Klancnik JM : Fundus autofluores-cence and central serous chorioretinopathy. Ophthalmology 112 : 825-833, 2005
32. Aizawa S, Mitamura Y, Hagiwara A, Sugawara T, Yamamoto S : Changes of fundus autofluo-rescence, photoreceptor inner and outer seg-ment junction line, and visual function in pa-tients with retinitis pigmentosa. Clin Experi-ment Ophthalmol 38 : 597-604, 2010
33. Robson AG, El-Amir A, Bailey C, Egan CA, Fitzke FW, Webster AR, Bird AC, Holder GE : Pattern ERG correlates of abnormal fundus autofluorescence abnormalities in patients with retinitis pigmentosa and normal visual acuity. Invest Ophthalmol Vis Sci 44 : 3544-3550, 2003 34. Fleckenstein M, Charbel Issa P, Helb HM, Schmitz-Valckenberg S, Scholl HP, Holz FG :
Correlation of lines of increased autofluores-cence in macular dystrophy and pigmented paravenous retinochoroidal atrophy by optical coherence tomography. Arch Ophthalmol 126 : 1461-1463, 2008
35. Lima LH, Cella W, Greenstein VC, Wang NK, Busuioc M, Smith RT, Yannuzzi LA, Tsang SH : Structural assessment of hyperautofluorescent ring in patients with retinitis pigmentosa. Retina 29 : 1025-1031, 2009
36. Wong F : Photoreceptor apoptosis in animal models. Implications for retinitis pigmentosa research. Arch Ophthalmol 113 : 1245-1247, 1995
37. Wakabayashi T, Sawa M, Gomi F, Tsujikawa
M : Correlation of fundus autofluorescence with photoreceptor morphology and functional changes in eyes with retinitis pigmentosa. Acta Ophthalmol 88 : e177-183, 2010
38. Robson AG, Tufail A, Fitzke F, Bird AC, Moore AT, Holder GE, Webster AR : Serial imaging and structure-function correlates of high-den-sity rings of fundus autofluorescence in retini-tis pigmentosa. Retina 31 : 1670-1679, 2011 39. Kiernan DF, Mieler WF, Hariprasad SM :
Spec-tral-domain optical coherence tomography : a comparison of modern high-resolution retinal imaging systems. Am J Ophthalmol 149 : 18-31, 2010