Abstract
This study constructs multi-item scales to measure key components of JIT production and Human Resource Management (HRM) and examines the relationship between them, and the impact of both on competitive performance for manufacturing industries in seven countries: Japan, Korea, USA, Germany, Austria, Sweden, and Finland. The relationship is examined for all the surveyed companies as one pooled sample. Additionally, cross-country and cross-industry differences are investigated for the impact of HRM practices on JIT production.
We find that HRM practices have a positive impact on JIT production. The results show that transportation industry, among industries, and Japan, among countries, have the strongest impact of HRM on JIT production. The results also show that high JIT users have higher levels of HRM implementation while old JIT users do not differ from new users concerning the level of HRM implementation. Finally, we find that both JIT and HRM have positive impact on competitive performance.
Keywords: Just-in-time production; Human Resource Management; International comparison; Empirical research
1..Introduction
Two decades ago, JIT production was seen as inapplicable outside Japan, and its success was often attributed to Japanese culture and management system such as life-time employment, team work, and seniority payment. In addition to that, the unique subcontracting system in Japan was regarded as one of the factors beyond the success of JIT production. Womack et al. (1990) concluded after a 5-year study that there is still a big gap between Japanese and Western companies, and that the greater part of Western industry doesn’t know how to close it. However, since that time JIT production was given a great attention by many researchers, and hundreds of researches were conducted and published. This led to narrowing the gap between Japanese and Western manufacturers. Increasing number of western companies has learnt how to make JIT production work successfully, and many of them have reported
The Relationship between Just-In-Time Production and
Human Resource Management,
and Their Impact on Competitive Performance
significant benefits from its implementation. Nonetheless, many other manufacturers in the West and less developing countries have failed in their attempts to implement JIT and to benefit from it. One of many factors that might potentially explain their failure, many consider neglecting human resource management practices associated with JIT production the most important.
Flynn et al. (1995) asserted that manufacturing competitiveness is based on a foundation of integrating and overlapping practices. Furthermore, Johnson and Manoochehri (1990) suggested that the full potential benefits of JIT can only be achieved by recognizing the changes in worker roles which have important implications for human resource management policies and practices. During our review of JIT literature, we noted that authors have often neglected the linkage between JIT practices and other functions and activities in the plant among which human resource management and we could find few papers that attempted to examine the relationship between JIT and HRM.
In this paper we try to fill this gap by empirically examining the impact of HRM on JIT production. We also examine the impact of JIT and HRM on competitive performance of the plant in an attempt to shed light on the superior performance in JIT environment.
Unlike other studies reported in the literature, the data used for this research were collected from seven countries and three industries that are regarded the most intensive users of JIT. The findings of this study are discussed to shed more light on HRM as a necessary infrastructure for successful JIT implementation.
2..Literature review 2.1 Just in time
JIT is an integrated set of activities designed to achieve high volume production using minimal inventories of raw materials, work-in-process, and finished goods. Parts arrive at the next station ‘just in time’ and are completed and move through the operation quickly. JIT is also based on the logic that nothing will be produced until it is needed (Chase et al., 2003). Schronberger (1982) defined JIT production as “ The JIT idea is simple: produce and deliver finished goods just in time to be sold, sub-assemblies just in time to be assembled into finished goods, fabricated parts just in time to go into sub-assemblies, and purchased materials just in time to be transformed into fabricated parts”. JIT aims to achieving excellence in manufacturing companies based on continuing elimination of waste and consistent improvement in productivity (Wallace, 1990). Waste occurs when activities are performed that do not add value to products. These non-value–adding activities can account for as much as 90 per cent of the total operations in a non-JIT process (Zhu et al., 1995). There are seven forms of waste that JIT production strives to eliminate: waste of overproduction, waste of inventory, waste of repair/defects, waste of motion (unnecessary movement), waste of processing, waste of waiting, and waste of transport (Womack and Roos, 1990; Imai, 1997; Taylor and Brunt, 2001; Liker, 2004). Schonberger (1987) asserted that JIT is the most important productivity enhancing management innovation in the last
century.
Most authors proposing JIT agreed that some of its objectives are to: (1) identify and solve fundamental problems; (2) reduce waste by eliminating all processes that do not add value to the product; (3) device appropriate systems that identify problems as they occur; (4) continuously improve operations (Moras and Dieck, 1992).
There is a general agreement among researchers that JIT production was initiated by Toyota motor company to meet their specific requirements. Toyota did not have space and money to hold a lot of inventory, could not afford to integrate vertically into all their parts business and Toyota needed to build vehicles for a relatively small market demanding a large variety of vehicles (Liker, 1998). Toyota’s objective was to develop in-house design skills, and a production system for small volumes capable of accepting frequent design changes (Hallihan et al., 1997). By the end of 1970s, JIT production was being diffused throughout the Japanese motor industry and into other industrial sectors (Lindberg et al, 1998). Since then, many consider JIT production as the main factor beyond Japanese competitive success in improving efficiency, productivity and effectiveness (e.g. Schonberger, 1982; Hall, 1983; Mehra and Inman, 1992; Young 1992; McLachlin, 1997; Imai, 1997).
The first requirement for JIT production is to enable all processes to know accurate timing and required quantity (Monden, 1983). This is achieved through pull action of Kanban where parts or components are not produced until needed by the downstream work centre (Byron et
al., 1986); Kanban card must be attached to every container of parts, therefore the amount of
inventory on the shop floor is controlled by the number of cards permitted (Flynn et al., 1995).The second major requirement of JIT is the use of cellular layouts of the machines. In cellular layout, each group of dissimilar but sequentially complementary machines is known as a cell, and each cell is set up to meet the processing needs of a particular class , or family, of parts (Brown and Michell, 1991).
Another important aspect of JIT production is set up time reduction. Early when Toyota started JIT Taiichi Ohno, the father of JIT production, realized that by shortening setup time the lot size is minimized and therefore the finished and WIP inventories are reduced (Monden, 1983).
Wafa and Yasin (1998) indicated that JIT failure was mainly attributed to the following reasons: lack of cooperation from vendors in the form of inconsistent lead times and capacity constraints imposed by suppliers, the lack of resources to invest in direct linkages with vendors, the unwillingness of workers to move from work center to other work centers as needed, management perception of JIT to equate workers in the floor with management, the attitude of “management knows what is best for the company”, and lack of accurate forecasting system.
During our review of JIT literature, we observed that there is no agreement among researchers concerning JIT practices. The number of JIT practices in the literature ranged from 3 unique JIT practices (Flynn et al., 1995) to as much as 21 practices (Shah and Ward, 2003). The latter authors included practices from Total Quality Management (TQM), Total
Productive Maintenance (TPM), and some elements of HRM to their definition of lean production which they used instead of JIT production. Our approach in this research is to focus on technical JIT practices that characterize JIT plants. We do not include elements from other operational practices to our definition of JIT production; therefore, we have selected nine JIT practices that were described in many research papers as unique JIT practices: 2.1.1 Daily Schedule Adherence (DSA): assesses whether there is time allotted for meeting each day’s schedule including catching up after stoppage for quality considerations or machine breakdown.
2.1.2 Equipment Layout (EL): use of manufacturing cells, elimination of forklifts and long conveyers, and use of smaller equipment designed for flexible floor layout, all associated with JIT.
2.1.3 JIT Delivery by Suppliers (JITDS): assesses whether vendors have been integrated into production in terms of using Kanban containers, making frequent (or just-in-time) delivery and quality certification.
2.1.4 JIT Link with Customers (JITLC): assesses whether the plant has applied the JIT delivery concept and the pull concept in the operational link with its customers.
2.1.5 Kanban/Pull System (K/PS): assesses whether or not the plant has implemented the physical elements of a Kanban system.
2.1.6 Repetitive Nature of Master Schedule (RNMS): assesses use of small lot sizes, mixed model assembly, and a level daily production schedule in the plant.
2.1.7 Setup Time Reduction (STR): assesses whether the plant is taking measures to reduce setup times and lower lot sizes in order to facilitate JIT.
2.1.8 Synchronization of Operations (SO): Assesses whether or not the manufacturing capacity is balanced throughout the manufacturing process and supply network.
2.1.9 Theory of Constraint (TC): Assesses whether or not efforts are undertaken to identify and control bottleneck (constraint) and to eliminate idle time of the bottleneck process. 2.2 Human Resource Management
Lado and Wilson (1994) defined a human resource system as “a set of distinct but interrelated activities, functions, and processes that are directed at attracting, developing, and maintaining (or disposing of) a firm’s human resources.”
behaviors, and performance. Individual performance depends on having the necessary skills and abilities for the job, as well as the motivation to apply those skills and abilities (Schroeder and Flynn, 2001).
Lau (2000) indicated that some JIT companies focus more on the technical aspects of JIT production rather than human aspects of implementation. However, HRM practices are essential for improvement efforts such as JIT production (Spenser and Guide, 1995; White et
al., 1999).
Generally, the literature has indicated a central place for employee involvement which has been regarded to be either an element of JIT or as a necessary condition for it. Respect for people and their involvement have been seen to be critical to the successful implementation of JIT (Schonberger, 1982; Monden, 1983; Hall, 1986; McLachlin, 1997). Team work and group problem solving allow decision making to be decentralized and therefore variance and uncertainty are easier to manage (Flynn et al., 1994).
Forza (1996) asserted that employee involvement will be enhanced by encouraging employee suggestions. He found that in JIT companies suggestions by employees were implemented higher than non-JIT companies, workers performed a higher variety of tasks, and more teams were used in problem solving than non-JIT companies. In addition to that, employee involvement will be enhanced by encouraging cooperation and coordination both vertically and horizontally (Aggrawal and Aggrawal, 1985). Hopkins (1989) further asserted that developing a problem solving teams, a cross-trained workers, and cooperation in decision making are critical to successful JIT implementation.
It is necessary to put a lot of emphasis on human resource management, the process factors, to succeed with the implementation of JIT. One key factor for successful implementation of JIT is to establish confidence among the people in the organization (Storhagen, 1995).
Power and Sohal (2000) have pointed Particular human resource management strategies and practices that can be expected to characterize companies using JIT production-open communication, participative management style, empowering employees, multi skilled and flexible workforce, team based structures, and effective employee development programs. They further suggested that the combination and emphasis of the overall human resource strategy employed in the JIT environment is potentially more important than the individual elements.
Johnson and Manoochehri (1990) have identified the importance of an increased level of technical skills and flexibility for workers for full scale implementation of JIT. Use of group technology and manufacturing cells requires multi skills workers. Workers must be assignable to different machines within a cell or to a different cell depending on production requirements for the cell.
Taylor and Brunt (2001) differentiated between mass and lean production concerning workforce as: workers are interchangeable and industrial engineer and foreman are responsible for improvements in mass production versus flexible teams work process, little management layers, and improvement responsibility throughout the organization in lean
production. Moreover, Promotion of employee responsibility, provision of training, promotion of teamwork, and demonstration of visible commitment are necessary conditions for JIT (McLachlin, 1997).
Technology alone does not provide companies with better performance. Rather, it is the joint use of technology and organizational practices that achieve improved performance (Challis and Samson, 2005). Therefore, top management involvement and proper employee training are essential for successful implementation of JIT production (Vora and Scraph, 1990), and firms considering implementing JIT are advised to invest extensively in modifying their workforce, and top manager’s involvement in the initiation of the JIT effort is critical (Yasin and Small, 1997).
A larger proportion of firms with high level of JIT success obtained top management commitment as their first step, and in order to have a higher success with JIT, there has to be a program to educate and train employees prior to implementation (Makhram and McCart, 1995).
Ramarapu et al. (1994) have pointed to Japanese approach to worker-orientation to be critical for JIT implementation and success. They described Japanese workers to be totally committed to their work and the company. To be loyal, cooperative, and flexible and willing to work long hours when needed. They further pointed that Japanese management is characterized by life time employment, approaching decision making from the bottom up, respect for their workers, and a paternalistic approach towards workers.
Salaheldin (2005) has found that Several human resource barriers may hinder manufacturing companies implementing JIT production successfully such as, lack of formal training for management and workers; lack of communications between workers and management; management and employees resistance; a lack of support from top management; lack of support from production and material management; plus a lack of support from supervisors. He further concluded that, as companies increase their investment in human resource modifications efforts undertaken in preparation for JIT, the operational efficiency and performance effectiveness are increased.
Based on our review of the literature, we found that seven HRM practices were associated with JIT production. Obviously, these are not the only HRM practices employed by JIT plants. Like in traditional plants, JIT plants implement several HRM practices which are out of the scope of this study. Our objective is to shed light on those HRM practices by which JIT plants are characterized.
2.2.1 Cooperation: assesses the internal cooperative relationships among employees rather than competition to achieve common goals as well as the external cooperation with suppliers and customers.
2.2.2 Employee Suggestion- Implementation and feedback (ES): assesses employee perceptions regarding management’s implementation and feedback on employee suggestions.
2.2.3 Flatness of Organizational Structure (FOS): Assesses whether or not there is many levels in the organizational structure between top and lowest level.
2.2.4 Multi-Functional Employees (MFE): This scale is used to determine if employees are trained in multiple tasks/areas; that is, receive cross training so that they can perform multiple tasks or jobs.
2.2.5 Small Group Problem Solving (SGPS): This scale is designed to assess the effective use of teams on the shop floor for continuous improvement.
2.2.6 Training for Employees (TE): This scale is used to determine if employees’ skill and knowledge are being upgraded in order to maintain a work-force with cutting edge skills and abilities.
2.2.7 Top Management Leadership for Quality (TMLQ): assesses top management commitment and personal involvement in pursuing continuous improvement.
2.3 Competitive performance
There are different ways to measure competitive performance. While reviewing the literature, we noted that the most widely used measures are cost, quality, flexibility, and delivery (e.g. Hayes and Wheelwright, 1984; Hill, 1989; Ward et al., 1995; Sakakibara et al., 1997;Cua et
al., 2001; McKone et al., 2001). In addition to theses measures, we include innovation and
new product launch as competitive performance measures. Since the plant does not control sales or costs outside the plants, overall financial measures of plant performance are not appropriate (McKone et al., 2001). Moreover, Ahmad et al. (2004) found that direct and indirect effects realized from the JIT practices on financial performance are almost non-existent. We use these six measures of competitive performance for our study as follows:
Cost: Unit cost of manufacturing (UCM).
Quality: Conformance to product specifications (CPS). Flexibility: Flexibility to change product mix (FCPM). Delivery: On time delivery performance (OTDP).
New product launch: On time new product launch (OTNPL) Innovation: Product innovativeness (PI).
3..Framework and research hypotheses
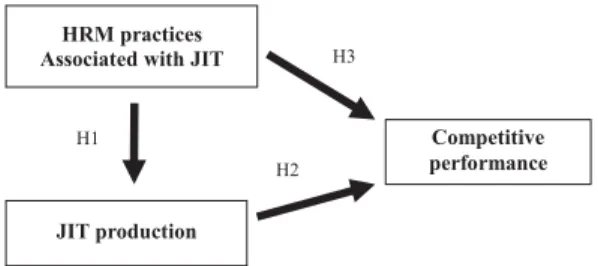
This research has been based on the proposed framework (Fig. 1). The framework considers the impact of HRM on JIT production and the impact of both on competitive performance. Our data were collected from seven different countries and three different industries.
As was discussed earlier, JIT production heavily depends upon employees involvement, team spirit, and commitment which are achieved through the proposed HRM practices, therefore we hypothesize that there is a significant positive impact of HRM practices on JIT implementation and development level.
Several studies have shown that JIT is associated with higher performance (e.g. Huson and Nanda, 1995; Lawrence and Hottenstein, 1995; Flynn et al., 1995; Cua et al., 2001; Fullerton and McWatters, 2001). However, Sakakibara et al. (1997) have concluded that JIT practices have value only when they are used to build infrastructure, and have no direct effect on performance. In addition to that, several studies have indicated that HRM is related to higher performance (e.g. MacDuffie, 1995; Youndt et al., 1996; Kock and McGrath, 1996; Delaney and Huselid, 1996; Huselid and Becker, 2000).We hypothesize that both JIT production and HRM have a positive impact on competitive performance, and the addition of HRM, given the impact of JIT production is expected to yield an additional incremental effect on competitive performance.
Our literature review of HRM showed that JIT success/failure was often attributed to adopting/neglecting HRM practices associated with JIT, therefore we propose that plants having higher levels of JIT implementation, or in other words more successful in implementing JIT are expected to have higher levels of HRM practices.
The literature suggests that plant age is expected to impede the adoption of new innovative changes due to factors such as resistance to change (e.g. Nelson and Winter, 1982; Pill and MacDuffie, 1996). However, it is rarely discussed in the literature how old users of JIT production differ from new users concerning the adoption of JIT infrastructure such as HRM practices. We expect that plants with longer experience with JIT implementation have had accumulated knowledge with JIT production and its infrastructure, therefore we propose that old users of JIT are expected to have higher levels of HRM practices.
In general, there is agreement among researchers concerning the positive impact of HRM practices on JIT. However, this relationship has mainly been described theoretically, and few studies have tried to investigate it empirically. Therefore, we offer the following hypotheses to guide our study:
H1a. HRM practices significantly contribute to JIT implementation level.
H1b. Manufacturing firms that are identified as high users of JIT have higher levels of implementation of HRM practices.
H1c. Manufacturing firms that are identified as old users of JIT have higher levels of implementation of HRM practices.
H2. JIT production positively influences competitive performance of the plant.
H3a. HRM practices associated with JIT positively influence competitive performance of the plant.
H3b. The addition of HRM, given the impact of JIT production, will further improve competitive performance of the plant.
Fig.1. Research framework
4..Methodology
4.1 Description of data
The data used for this empirical research were collected as part of an ongoing High Performance Manufacturing (HPM) project (previously called world class manufacturing project (WCM)), round 3 being conducted by a team of researchers in ten countries: Japan, Korea, USA, Germany, Italy, Austria, Sweden, Finland, Spain, and UK. The HPM database was assembled in 2003 and 2004 and consists of randomly selected world-class and traditional manufacturing companies from three different industries; machinery, electrical & electronics and transportation. For this study, our sample comprised of 210 manufacturing plants located in Japan, Korea USA, Germany, Sweden, Finland, and Austria. Table 1 shows the distribution of the plants used in this research classified by country and industry.
Table 1 Number of sample plants classified by country and industry
Country Industry Total
Machinery Electronics Transportation
Finland 6 14 10 30 USA 11 9 9 29 Japan 11 10 13 34 Germany 13 9 19 41 Sweden 10 7 7 24 Korea 10 10 11 31 Austria 7 10 4 21 Total 68 69 73 210
The measurement instrument of this project was developed after conducting an extensive review of relevant literature by project members. The developed scales were reviewed by a panel of 3-5 experts to assure content validity, and the scales were revised as needed. The questionnaire was designed for various managers, supervisors, and direct workers, and pre-tested at several manufacturing plants and with academics for pilot testing, and was revised as needed. The original questionnaire was translated into each county’s language by experts from those countries and then back translated to English to ensure equivalency.
The selected manufacturing companies were contacted personally by members of HPM in each country. The project members asked the executive in charge of manufacturing operations
for the voluntary participation in the project. About 60% of contacted companies agreed to participate and assigned one plant manager to be responsible for data collection. Participating plants were promised to receive a comprehensive feedback concerning their managerial and operational practices compared to other plants. The right respondents in terms of experience, specialty, and knowledge were agreed upon between the team members and the assigned plant manager.
Next, the questionnaires were completed by five direct workers, four supervisors, and ten managers who each received a different questionnaire, allowing respondents to address their particular area of expertise. In addition to that, multiple respondents were asked to complete each question in order to obtain greater reliability of the data and to eliminate potential respondent bias.
The items used to measure the different practices of JIT, HRM, and competitive performance can be found in appendixes A-C. For JIT and HRM questions, the respondents were asked to indicate their agreement or disagreement with the statements provided using seven-point Likert scales where 7 indicates strong agreement and 1 indicates strong disagreement. For competitive performance measures, respondents were asked to evaluate performances relative to their competitors in the same industry on a global basis, using five point Likert scales where 5 indicates superior to competitors and 1 indicates poor, low end of industry.
4.2 Measurement analysis and research variables
As has been discussed earlier, nine multi-item scales were selected to measure JIT production and seven multi-item scales to measure HRM. To measure competitive performance, six non-scale items were selected.
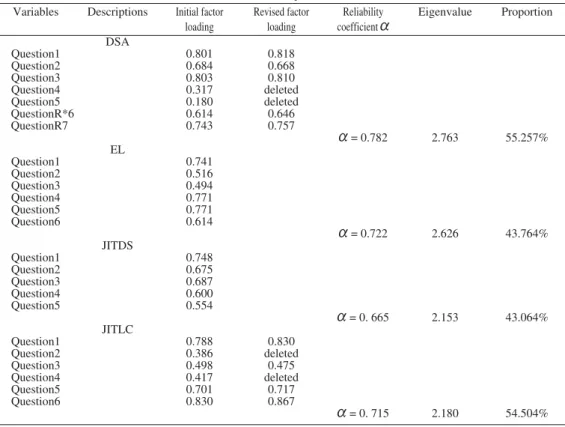
To ensure that JIT and HRM scales are reliable indicators of their constructs, factor analysis was carried out with principal components analysis (PCA) as the extraction method. We selected PCA as it is preferred for purposes of data reduction while the other type of factor analysis, principal factor analysis (PFA), is preferred when the research purpose is detecting data structure or casual modeling. The goal of PCA is to extract maximum variance from the data set with each component (Tabachnick and Fidell, 2001). Our purpose was to perform within scale factor analysis to verify that all items loaded onto one factor; therefore we did not use a rotation method. Only items that had a factor loading of at least 0.40 and eginevalue of at least 1 were retained. Table 2 shows that seven JIT variables failed to meet this cutoff loading and were deleted and one variable with factor loading of 0.417 loaded onto another factor and was also deleted leaving a total of 44 variables constructing the nine JIT constructs. Eginevalue of the scales ranged between 1.99 and 2.97.
Cronbach’s coefficient a, a widely used indicator for assessing internal consistency of scale variables, was used to evaluate the reliability of the scales. Seven scales of JIT have met the recommended standard of a≥ 0.70 and considered to be internally consistent (Nunnally, 1978). The reliability of the remaining two JIT scales, JIT Delivery by Suppliers and
Synchronization of Operations, has been 0.665 and 0.650 respectively. Nunnally recommended a minimum standard of 0.60 for newly developed scales; therefore we decided to retain these scales.
Additionally, we calculated the super scales for JIT production and competitive performance. As shown in Table 2, the Eginevalues of the super scales were 4.780 and 2.622 respectively. Cronbach’s coefficient awere 0.849 and 0.740 respectively.
Table 2 Factor analysis: JIT scales
Variables Descriptions Initial factor Revised factor Reliability Eigenvalue Proportion loading loading coefficient a
DSA Question1 0.801 0.818 Question2 0.684 0.668 Question3 0.803 0.810 Question4 0.317 deleted Question5 0.180 deleted QuestionR*6 0.614 0.646 QuestionR7 0.743 0.757 a= 0.782 2.763 55.257% EL Question1 0.741 Question2 0.516 Question3 0.494 Question4 0.771 Question5 0.771 Question6 0.614 a= 0.722 2.626 43.764% JITDS Question1 0.748 Question2 0.675 Question3 0.687 Question4 0.600 Question5 0.554 a= 0. 665 2.153 43.064% JITLC Question1 0.788 0.830 Question2 0.386 deleted Question3 0.498 0.475 Question4 0.417 deleted Question5 0.701 0.717 Question6 0.830 0.867 a= 0. 715 2.180 54.504%
Table 2 (continued)
Variables Descriptions Initial factor Revised factor Reliability Eigenvalue Proportion loading loading coefficient a
K/PS Question1 0.765 Question2 0.764 Question3 0.818 Question4 0.824 a= 0. 803 2.516 62.912% RNMS Question1 0.819 0.847 Question2 0.755 0.751 Question3 0.753 0.770 Question4 0.392 deleted Question5 0.812 0.823 QuestionR6 0.209 deleted a= 0. 811 2.553 63.824% STR Question1 0.702 Question2 0.617 Question3 0.602 Question4 0.728 Question5 0.768 QuestionR6 0.610 a= 0. 757 2.970 37.126% TC Question1 0.705 0.707 Question2 0.732 0.731 Question3 0.676 0.677 Question4 0.686 0.687 Question5 0.594 0.595 Question6 0.629 0.630 Question7 0.508 0.511 Question8 0.061 deleted a= 0. 766 2.977 42.533% SO Question1 0.788 0.794 Question2 0.771 0.803 Question3 0.672 0.684 QuestionR4 0.521 0.501 Question5 0.327 deleted a= 0. 650 1.995 49.881%
JIT super scale
DSA 0.773 EL 0.717 JITDS 0.813 JITLC 0.737 K/PS 0.592 RNMS 0.484 STR 0.781 SO 0.840 TC 0.750 a= 0. 849 4.780 53.114% Competitive performance super scale UCM 0.670 CPS 0.633 FCPM 0.607 OTDP 0.580 OTNPL 0.751 PI 0.709 a= 0. 740 2.622 43.701% *R: reversed question
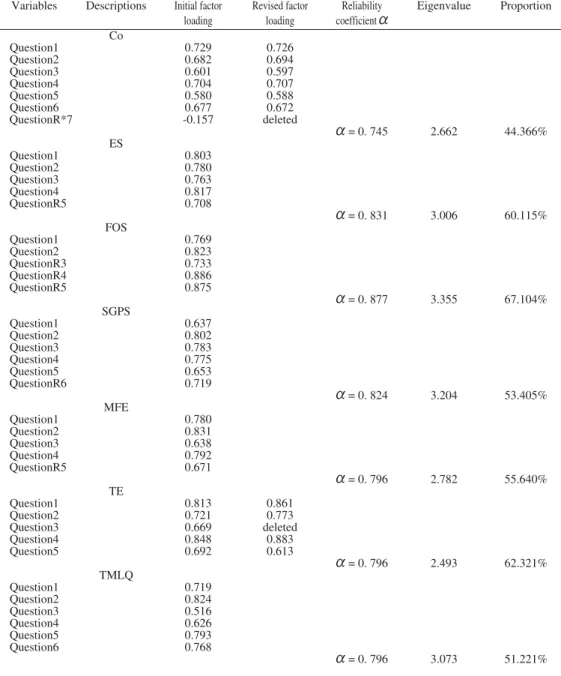
Table 3 shows factor analysis for HRM scales. One HRM variable failed to meet the cutoff loading of 0.40 and was deleted. Another variable loaded onto two factors and was also deleted leaving a total of 37 variables constructing the seven HRM constructs. Cronbach’s coefficient afor all HRM scales exceeded 0.70 and ranged between 0.745 and 0.877. Eginevalue of the scales ranged between 2.662 and 3.355. We also calculated the super scale of HRM scales. The Eginevalues of the super scale was 3.691and Cronbach’s coefficient a
was 0.814.
Table 3 Factor analysis: HRM scales
Variables Descriptions Initial factor Revised factor Reliability Eigenvalue Proportion loading loading coefficient a
Co Question1 0.729 0.726 Question2 0.682 0.694 Question3 0.601 0.597 Question4 0.704 0.707 Question5 0.580 0.588 Question6 0.677 0.672 QuestionR*7 -0.157 deleted a= 0. 745 2.662 44.366% ES Question1 0.803 Question2 0.780 Question3 0.763 Question4 0.817 QuestionR5 0.708 a= 0. 831 3.006 60.115% FOS Question1 0.769 Question2 0.823 QuestionR3 0.733 QuestionR4 0.886 QuestionR5 0.875 a= 0. 877 3.355 67.104% SGPS Question1 0.637 Question2 0.802 Question3 0.783 Question4 0.775 Question5 0.653 QuestionR6 0.719 a= 0. 824 3.204 53.405% MFE Question1 0.780 Question2 0.831 Question3 0.638 Question4 0.792 QuestionR5 0.671 a= 0. 796 2.782 55.640% TE Question1 0.813 0.861 Question2 0.721 0.773 Question3 0.669 deleted Question4 0.848 0.883 Question5 0.692 0.613 a= 0. 796 2.493 62.321% TMLQ Question1 0.719 Question2 0.824 Question3 0.516 Question4 0.626 Question5 0.793 Question6 0.768 a= 0. 796 3.073 51.221%
Table 3 (continued)
Variables Descriptions Initial factor Revised factor Reliability Eigenvalue Proportion loading loading coefficient a
HRM super scale Co 0.729 ES 0.743 FOS 0.486 MFE 0.813 SGPS 0.785 TE 0.836 TMLQ 0.629 a= 0. 814 3.691 52.728% *R: reversed question
4.3 High and low JIT users
To test hypothesis H1b, we have separated the pooled sample plants into two groups: high and low users of JIT. We have averaged JIT scales into one super-scale on a plant level. Next, we calculated the mean value of JIT super scale for the sample plants which was found 4.56. We used this mean value to separate the two groups where super-scales that are ≥ 4.56 have been classified as high users of JIT, and super-scales that are < 4.56 have been classified as low users of JIT.
4.4 Old and new users of JIT
To test hypothesis H1c, we have divided the sample plants into old and new users of JIT. We have decided to use a cutoff point of 5 years since JIT implementation where plants that have been implementing JIT production for more than 5 years, have been classified as old users, and plants that have been implementing JIT for 5 years or less, have been classified as new users of JIT. 5..Results and discussion
5.1 Correlation analysis
Once the measures were determined as reliable and valid, bivariate correlation was carried out for JIT and HRM practices separately. We have included the super scale of competitive performance in the correlations. Table 4 shows that all correlations within JIT scales were significant at p=0.01 level. All the correlations between JIT scales and competitive performance were positive, but the correlation between competitive performance and Repetitive Nature of Master Schedule was not significant. We can see that several independent variables are moderately or highly correlated. This level was expected and consistent with other literature as plants that are advanced on some scales of JIT tend generally to be more advanced on others.
As we later use regression models, analysis and interpretation should be given an additional care. Multicollinearity is a potential problem in regression analysis. In order to deal with this problem in our regression models presented later, we used the Variance Inflation Factor (VIF) Which measures the impact of collinearity among the variables in a regression model. All model variables were well within the VIF limit of 4, indicating that their multicollinearity did not have an unexpected influence on the least-squares estimates.
Table 4 Means, standard deviations, and correlations among JIT variables and competitive performance
Mean S.D. DSA EL JITDS JITLC K/PS RNMS STR SO TC
DSA 4.95 0.767 1 EL 5.06 0.670 0.490** 1 JITDS 4.46 0.760 0.498** 0.518** 1 JITLC 4.51 0.861 0.547** 0.381** 0.668** 1 K/PS 3.73 1.038 0.338** 0.480** 0.560** 0.397** 1 RNMS 3.89 1.155 0.225** 0.185** 0.428** 0.423** 0.228** 1 STR 4.65 0.764 0.611** 0.476** 0.530** 0.469** 0.340** 0.330** 1 SO 4.68 0.705 0.688** 0.638** 0.584** 0.513** 0.359** 0.291** 0.617** 1 TC 5.11 0.627 0.529** 0.467** 0.508** 0.414** 0.278** 0.302** 0.645** 0.665** 1 Perfor. 3.65 0.550 0.282** 0.360** 0.272** 0.224** 0.155* 0.096 0.320** 0.368** 0.376** *P ≤ 0.05 **P ≤ 0.01
Table 5 shows the correlation matrix among HRM scales together with competitive performance super scale. All the correlations within HRM scales were positive and significant at p=0.01 level except for the correlation between Top Management Leadership for Quality and Flatness of Organizational Structure which was not significant. All the correlations between HRM scales and competitive performance were positive and significant. Several independent variables are moderately or highly correlated, therefore it was essential to check for potential multicollinearity problems. We again used the Variance Inflation Factor (VIF) to measure the impact of collinearity among the variables in a regression model. All model variables were well within the VIF limit of 4, indicating that their multicollinearity did not have an unexpected influence on the least-squares estimates.
Table 5 Means, standard deviations, and correlations among JIT variables and competitive performance
Mean S.D. Co ES FOS MFE SGPS TE TMLQ
Co 5.75 0.413 1 ES 5.21 0.599 0.388** 1 FOS 4.47 0.995 0.395** 0.223** 1 MFE 5.34 0.603 0.541** 0.479** 0.441** 1 SGPS 5.06 0.643 0.523** 0.627** 0.307** 0.518** 1 TE 5.24 0.669 0.505** 0.588** 0.279** 0.716** 0.559** 1 TMLQ 5.51 0.624 0.396** 0.373** 0.134 0.407** 0.436** 0.493** 1 Perform 3.65 0.550 0.387** 0.222** 0.177* 0.329** 0.271** 0.359** 0.397** *P ≤ 0.05 **P ≤ 0.01
5.2 Test of hypothesis H1a
Multiple regression analysis has been produced to test this hypothesis where the independent variables of HRM scales have been regressed on the dependent variables of JIT scales (Table 6). We aware that our adj. R2
is not so high. However, we checked similar research papers and found their R2
and adj. R2
similar to us (e.g. Lawrence and Hottenstein, 1995; McKone et al., 1999; Sohel et al., 2003; Sohel et al., 20032
; Shah and ward, 2003). We concluded that it is common for such empirical studies of JIT and its infrastructure to have low adj. R2
.
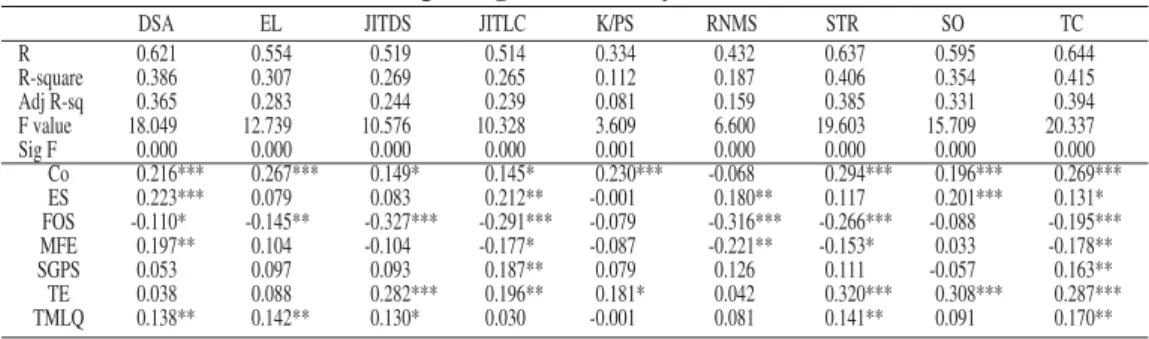
The results suggest that Cooperation and Training of Employees have the most significant and positive impact on JIT scales as they have significant relations to six and five JIT scales respectively. They are followed by Employee Suggestions and Top Management Leadership
for Quality where both have significant impact on four JIT scales. Small Group Problem Solving has significant impact on two JIT scales. It is interesting to note that while Multi-Functional Employees has significant and positive impact on only one scale of JIT, it has significant and negative impact on two JIT scales. Finally, Flatness of Organizational Structure has negative impact on all JIT scales including six significant.
We have evidence from the multiple regression to suggest that Flatness of Organizational Structure is not necessarily a prerequisite for JIT implementation and success. Of course we can neither claim that organizations should change their flat structures nor the existence of flat structures will impede JIT implementation. However, we do claim that while flatness of organizational structure might bring different benefits to some organizations, it does not has a direct positive impact on JIT production. Our sample consists of manufacturing plants from different countries with different cultures, and while in some countries flat organizations are a common practice, in others it might be seen as inapplicable practice due to cultural differences. Moreover, we have found for our sample that organizations with high JIT implementation have more levels of management than organizations with low JIT implementation. One important implication of this finding can be addressed to organizations considering JIT implementation either from developed or developing countries where local culture may impede the shift to flat structure.
All other HRM scales obviously have positive impact on JIT production and contribute to its implementation and development level. Again, we can not claim that Multi-functional employees should be ignored because it has two significant negative relations and only one positive with JIT scales. We do indeed insist on the importance of having Multi-functional employees to ensure smooth and successful implementation of JIT, and these negative relations could be attributed either to our multi-cultural international sample or to the high correlations among HRM scales so that the multiple regression sorted out the scales that had no additional positive explanatory power over the powerful scales.
If we look at the relationship from the perspective of JIT practices, we can see that Daily Schedule Adherence and Theory of Constraints are the most positively affected by HRM practices. This finding appears logical as involvement of people, their commitment, and the existing of team spirit and technical skills are crucial in JIT environment to meet daily schedules on time, and to identify and eliminate any potential bottlenecks. Then, we can note that Setup Time Reduction, Synchronization of Operations, and JIT link with Customers are positively affected by three practices each of HRM. Next, Equipment Layout is positively affected by Cooperation and Management Leadership for Quality. And finally, we see three the least affected JIT practices by HRM are JIT Delivery by Suppliers, Kanban, and Repetitive Nature of Master schedule. It is interning to note that while JIT link with customers is affected by three HRM practices, JIT link with suppliers is affected by only one. This can be explained by the nature of each link. JIT link with customers requires workers efforts and capabilities to ensure that customers receive their deliveries frequently and on time, while JIT link with suppliers depends mostly on the top management efforts to qualify and support
suppliers; therefore not surprisingly it is affected by training activities.
It is important to note that although HRM practices have a positive impact on JIT in isolation, their combination will yield the optimal impact on JIT production.
Hypothesis H1a has been mostly accepted.
Table 6 Results of multiple regression analysis for HRM and JIT scales
DSA EL JITDS JITLC K/PS RNMS STR SO TC
R 0.621 0.554 0.519 0.514 0.334 0.432 0.637 0.595 0.644 R-square 0.386 0.307 0.269 0.265 0.112 0.187 0.406 0.354 0.415 Adj R-sq 0.365 0.283 0.244 0.239 0.081 0.159 0.385 0.331 0.394 F value 18.049 12.739 10.576 10.328 3.609 6.600 19.603 15.709 20.337 Sig F 0.000 0.000 0.000 0.000 0.001 0.000 0.000 0.000 0.000 Co 0.216*** 0.267*** 0.149* 0.145* 0.230*** -0.068 0.294*** 0.196*** 0.269*** ES 0.223*** 0.079 0.083 0.212** -0.001 0.180** 0.117 0.201*** 0.131* FOS -0.110* -0.145** -0.327*** -0.291*** -0.079 -0.316*** -0.266*** -0.088 -0.195*** MFE 0.197** 0.104 -0.104 -0.177* -0.087 -0.221** -0.153* 0.033 -0.178** SGPS 0.053 0.097 0.093 0.187** 0.079 0.126 0.111 -0.057 0.163** TE 0.038 0.088 0.282*** 0.196** 0.181* 0.042 0.320*** 0.308*** 0.287*** TMLQ 0.138** 0.142** 0.130* 0.030 -0.001 0.081 0.141** 0.091 0.170** *P ≤ 0.1 **P ≤ 0.05 ***P ≤ 0.01
To shed light on the impact of HRM practices on JIT among industries and countries, we use a super-scale of HRM scales which has been defined as an independent variable, and has been regressed to each scale of JIT.
Table 7 shows the regression analysis for the impact of HRM on JIT practices among industries. The results show that transportation industry is the most positively affected by HRM, followed by machinery and electronics respectively. JIT production was initiated by Toyota which made intensive combination between technical and human practices, and then JIT was imitated by competitors and thereafter diffused among other industries. The results indicate that plants in the transportation (Auto) industry still in the leading position of heavily relying on the combination between HRM practices and JIT technical practices to achieve the desired results of JIT system in their competitive market.
Table 7 Results of regression analysis for HRM super-scale on JIT scales by industry
DSA EL JITDS JITLC K/PS RNMS STR SO TC
M 0.395*** 0.300** 0.133 0.240** 0.138 -0.047 0.332*** 0.468*** 0.445***
E 0.600*** 0.545*** 0.209* 0.103 0.127 -0.153 0.395*** 0.417*** 0.365***
T 0.656*** 0.553*** 0.366*** 0.419*** 0.361*** -0.146 0.525*** 0.642*** 0.598*** M: Machinery; E: Electronics; T: Transportation
*P ≤ 0.1 **P ≤ 0.05 ***P ≤ 0.01
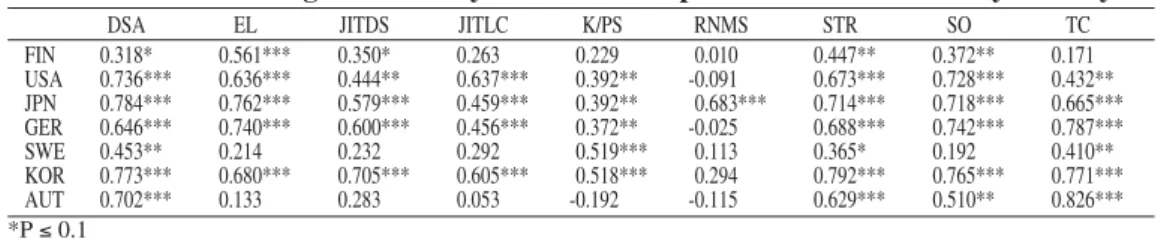
Table 8 shows the regression analysis for the impact of HRM on JIT practices among countries. Japan appears to have the strongest impact of HRM on JIT implementation and development level. This finding is natural as Japan is the origin of JIT production, and the reliance of Japanese companies on HRM practices and their unique management system are widely known. This finding provides support to the advocates of the synergy between HRM
and JIT as one of the main factors beyond the Japanese excellence in operations management. Next, we see a strong impact of HRM on JIT practices for three main competitors of Japan: USA, Germany, and Korea. Many companies in these countries have realized the potential benefits of JIT production and its crucial role of competing with Japanese companies. Finally, we see less impact in Austria, Finland, and Sweden. It seems these three countries rely more on technology rather than human factors.
Table 8 Results of regression analysis for HRM super-scale on JIT scales by country
DSA EL JITDS JITLC K/PS RNMS STR SO TC
FIN 0.318* 0.561*** 0.350* 0.263 0.229 0.010 0.447** 0.372** 0.171 USA 0.736*** 0.636*** 0.444** 0.637*** 0.392** -0.091 0.673*** 0.728*** 0.432** JPN 0.784*** 0.762*** 0.579*** 0.459*** 0.392** 0.683*** 0.714*** 0.718*** 0.665*** GER 0.646*** 0.740*** 0.600*** 0.456*** 0.372** -0.025 0.688*** 0.742*** 0.787*** SWE 0.453** 0.214 0.232 0.292 0.519*** 0.113 0.365* 0.192 0.410** KOR 0.773*** 0.680*** 0.705*** 0.605*** 0.518*** 0.294 0.792*** 0.765*** 0.771*** AUT 0.702*** 0.133 0.283 0.053 -0.192 -0.115 0.629*** 0.510** 0.826*** *P ≤ 0.1 **P ≤ 0.05 ***P ≤ 0.01 5.3 Test of hypothesis H1b
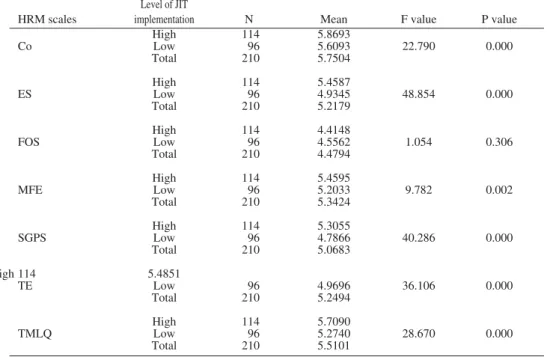
To test this hypothesis, one way ANOVA test was produced (Table 9). All sample plants were separated into low and high levels of JIT implementation based on a cutoff super-scale mean of 4.56. The purpose of this hypothesis is to shed more light on the relationship between intensive implementation of JIT practices and HRM practices. For each HRM practice, JIT groups were compared to investigate whether or not there is a significant difference between low and high users of JIT. The results showed that for six HRM practices: Cooperation, Employee Suggestions, Multi-Functional Employees, Small Group Problem Solving, Task-Related Training for Employees and Top Management Leadership for Quality, high users of JIT have higher levels of these practices and significantly differ from low users of JIT. For the seventh practice, Flatness of Organizational Structure, low users of JIT have higher implementation level, but with no significant difference. We can deduce from the results that there is a general awareness among the organizations that as the implementation of JIT increases, the level of HRM practices associated with JIT should be increased to ensure successful implementation and to achieve full potential of JIT production.
Hypothesis H1b has been mostly accepted. 5.4 Test of hypothesis H1c
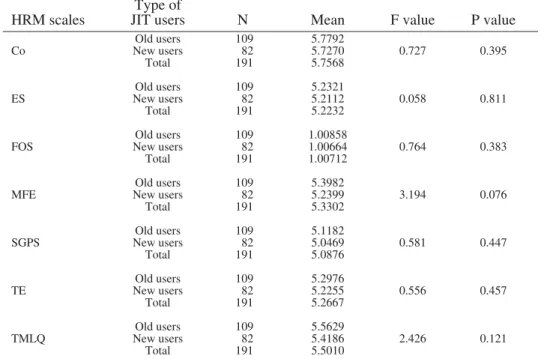
To test this hypothesis, one way ANOVA test has been produced (Table 10). All sample plants were separated into old and new users of JIT based on a cutoff point of 5 years since JIT adoption. Our purpose is to investigate the relationship between longer implementation of JIT production and HRM practices. For each HRM practice, JIT groups have been compared to examine whether or not there is a significant difference between them. The results showed that no significant differences between old and new users of JIT for all HRM practice. This
implies that longer implementation of JIT is expected neither to automatically change the organizational culture nor to affect HRM. Rather, organizational and human resource modifications should be undertaken prior to JIT introduction. Both managers and workers should fully understand the philosophy of JIT and what is expected from them in the preparation stage through intensive training to ensure smooth implementation. Hypothesis H1c has been rejected. Table 9 ANOVA analysis of means for changes in HRM practices for high and low users of JIT
Level of JIT
HRM scales implementation N Mean F value P value
High 114 5.8693 Co Low 96 5.6093 22.790 0.000 Total 210 5.7504 High 114 5.4587 ES Low 96 4.9345 48.854 0.000 Total 210 5.2179 High 114 4.4148 FOS Low 96 4.5562 1.054 0.306 Total 210 4.4794 High 114 5.4595 MFE Low 96 5.2033 9.782 0.002 Total 210 5.3424 High 114 5.3055 SGPS Low 96 4.7866 40.286 0.000 Total 210 5.0683 High 114 5.4851 TE Low 96 4.9696 36.106 0.000 Total 210 5.2494 High 114 5.7090 TMLQ Low 96 5.2740 28.670 0.000 Total 210 5.5101
5.5 Test of hypothesis H2 and H3
To test hypotheses H2, H3a and H3b concerning the impact of JIT and HRM on the competitive performance of the plant, we use hierarchical regression analysis with competitive performance as dependent variable (Table 11). We first entered JIT super scale to the model. The results showed that JIT explained a significant portion (13.2%) of the variance in competitive performance among responding plants. In the second equation, we added HRM super scale to the model so that we can measure the incremental impact of HRM on competitive performance given the impact of JIT production. The results showed that the addition of HRM resulted in an additional significant explanation (7.4%) of the variance in competitive performance. In equation (2'), HRM super scale has been regressed on competitive performance to test the direct impact of HRM on competitive performance not given the effect of JIT. Equation (2') shows that HRM explained a significant portion of 16.8% of the variance in competitive performance among the responding plants. All in all, hypotheses H2, H3a, and H3b have been supported.
Table 10 ANOVA analysis for changes in HRM practices for old and new users of JIT Type of
HRM scales JIT users N Mean F value P value
Old users 109 5.7792 Co New users 82 5.7270 0.727 0.395 Total 191 5.7568 Old users 109 5.2321 ES New users 82 5.2112 0.058 0.811 Total 191 5.2232 Old users 109 1.00858
FOS New users 82 1.00664 0.764 0.383
Total 191 1.00712
Old users 109 5.3982
MFE New users 82 5.2399 3.194 0.076
Total 191 5.3302 Old users 109 5.1182 SGPS New users 82 5.0469 0.581 0.447 Total 191 5.0876 Old users 109 5.2976 TE New users 82 5.2255 0.556 0.457 Total 191 5.2667 Old users 109 5.5629 TMLQ New users 82 5.4186 2.426 0.121 Total 191 5.5010
Table 11 Hierarchical regression analysis of competitive performance
Variables Eq. (1) Eq. (2) Eq. (2')
(Constant) 2.070*** 0.761* 1.077** JIT 0.364*** 0.221*** HRM 0.307*** 0.410*** R2 0.132 0.206 0.168 Adj. R2 0.128 0.198 0.163 F 28.634*** 24.283*** 37.918*** Change in R2 0.074 F change 28.634*** 17.430*** *P ≤ 0.1 **P ≤ 0.05 ***P ≤ 0.01
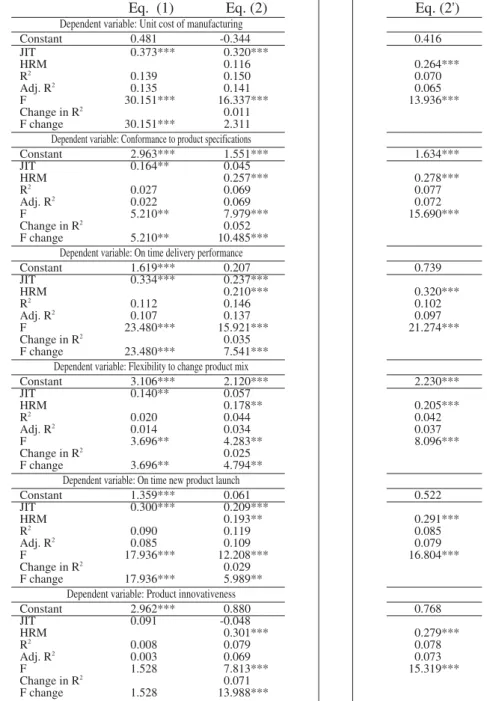
To further investigate the relationship between JIT, HRM and competitive performance, we performed additional analysis to test the impact of JIT and HRM on individual competitive performance measures (Table 12). We conducted hierarchical regression analysis separately for each competitive performance measure as a dependent variable. In a similar way to previous regression, we entered JIT super scale to the first equation. In the second equation, we added HRM super scale to measure the incremental impact of HRM on each individual measure of competitive performance given the impact of JIT production.
The results showed that JIT explained a significant portion of the variance for five individual measures of competitive performance. For the sixth measure, Product Innovativeness, the impact of JIT was insignificant. The addition of HRM to the models in the second equation resulted of an additional significant increase of R2
competitive performance. As for the sixth measure, Unit Cost of Manufacturing, the addition of HRM did not significantly increase R2
. Equation (2') shows that the direct impact of HRM, not given the effect of JIT, significantly explained a significant portion of the variance for all the individual measures of competitive performance.
Table 12 Hierarchical regression analysis of competitive performance measures
Eq. (1) Eq. (2) Eq. (2')
Dependent variable: Unit cost of manufacturing
Constant 0.481 -0.344 0.416 JIT 0.373*** 0.320*** HRM 0.116 0.264*** R2 0.139 0.150 0.070 Adj. R2 0.135 0.141 0.065 F 30.151*** 16.337*** 13.936*** Change in R2 0.011 F change 30.151*** 2.311
Dependent variable: Conformance to product specifications
Constant 2.963*** 1.551*** 1.634*** JIT 0.164** 0.045 HRM 0.257*** 0.278*** R2 0.027 0.069 0.077 Adj. R2 0.022 0.069 0.072 F 5.210** 7.979*** 15.690*** Change in R2 0.052 F change 5.210** 10.485***
Dependent variable: On time delivery performance
Constant 1.619*** 0.207 0.739 JIT 0.334*** 0.237*** HRM 0.210*** 0.320*** R2 0.112 0.146 0.102 Adj. R2 0.107 0.137 0.097 F 23.480*** 15.921*** 21.274*** Change in R2 0.035 F change 23.480*** 7.541***
Dependent variable: Flexibility to change product mix
Constant 3.106*** 2.120*** 2.230*** JIT 0.140** 0.057 HRM 0.178** 0.205*** R2 0.020 0.044 0.042 Adj. R2 0.014 0.034 0.037 F 3.696** 4.283** 8.096*** Change in R2 0.025 F change 3.696** 4.794**
Dependent variable: On time new product launch
Constant 1.359*** 0.061 0.522 JIT 0.300*** 0.209*** HRM 0.193** 0.291*** R2 0.090 0.119 0.085 Adj. R2 0.085 0.109 0.079 F 17.936*** 12.208*** 16.804*** Change in R2 0.029 F change 17.936*** 5.989**
Dependent variable: Product innovativeness
Constant 2.962*** 0.880 0.768 JIT 0.091 -0.048 HRM 0.301*** 0.279*** R2 0.008 0.079 0.078 Adj. R2 0.003 0.069 0.073 F 1.528 7.813*** 15.319*** Change in R2 0.071 F change 1.528 13.988*** **P ≤ 0.05 ***P ≤ 0.01
6..Conclusions
Based on our study, the following conclusions are drawn. First, HRM practices have a direct positive impact on JIT implementation and development. This study suggests that cooperation (team spirit) and Training of Employees are the most critical HRM practices that affect JIT production.
Employee Suggestions, Top Management Leadership for Quality, Multi-Functional Employees, and Small Group Problem Solving have positive impact on different practices of JIT. Flatness of Organizational Structure was found to have negative and significant impact on six JIT elements implying that it is not necessarily a prerequisite for JIT implementation and success.
Second, the results showed that as the implementation of JIT increases, the level of HRM practices is increased, emphasizing that HRM is an inherent part of JIT implementation and success. On the other hand, results showed that old and new users of JIT have similar levels of HRM, implying that human resource modifications should be undertaken prior to JIT implementation.
Third, this study indicated that JIT production has a positive impact on competitive performance of the plant. All the measures of cost, quality, flexibility, delivery, and new product launch were significantly and positively affected by JIT production. However, the impact of JIT on product innovativeness was insignificant.
Fourth, the results showed that HRM has significant and positive impact on all the measures of competitive performance. In addition to that, the addition of HRM, given the effect of JIT production, resulted in an additional significant impact on the competitive performance super scale as well as on the measures of quality, flexibility, delivery, new product launch, and innovation implying that to achieve full potential of JIT production and superior competitive performance, it is of crucial importance to adopt both JIT technical practices and HRM practices associated with JIT implementation. The findings emphasize that HRM practices are a prerequisite and main infrastructure for JIT production.
The limitation of our study is that, as in other empirical research in operations management, the measurement scales of JIT and HRM used for our research may not capture all the practices implemented by the surveyed plants. In addition to that, competitive performance was measured relative to competitors, not to performance prior to JIT introduction.
Similar research should be undertaken for less developed countries. Also, further research is needed with a larger sample and additional industries so that casual modeling techniques of analysis could be applied. Further research is also needed to investigate how other operational practices affect JIT and competitive performance. Finally, case studies are needed to investigate how culture affects JIT and HRM.
Appendix A Measures of JIT practices Daily Schedule Adherence
Question 1 We usually meet the production schedule each day. Question 2 Our daily schedule is reasonable to complete on time. Question 3 We usually complete our daily schedule as planned.
Question 4 We build time into our daily schedule to allow for machine breakdowns and unexpected production stoppages.
Question 5 We build extra slack into our daily schedule, to allow for catching up. QuestionR 6 We cannot adhere to our schedule on a daily basis.
QuestionR 7 It seems like we are always behind schedule. Equipment Layout
Question 1 We have laid out the shop floor so that processes and machines are in close proximity to each other.
Question 2 We have organized our plant floor into manufacturing cells.
Question 3 Our machines are grouped according to the product family to which they are dedicated.
Question 4 The layout of our shop floor facilitates low inventories and fast throughput. Question 5 Our processes are located close together, so that material handling and part
storage are minimized.
Question 6 We have located our machines to support JIT production flow. Just-in-Time Delivery by Suppliers
Question 1 Our suppliers deliver to us on a just-in-time basis. Question 2 We receive daily shipments from most suppliers.
Question 3 We can depend upon on-time delivery from our suppliers. Question 4 Our suppliers are linked with us by a pull system.
Question 5 Suppliers frequently deliver materials to us. Just-in-Time Link with Customers
Question 1 Our customers receive just-in-time deliveries from us. Question 2 Most of our customers receive frequent shipments from us. Question 3 We always deliver on time to our customers.
Question 4 We can adapt our production schedule to sudden production stoppages by our customers.
Question 5 Our customers have a pull type link with us. Question 6 Our customers are linked with us via JIT systems.
Kanban
Question 1 Suppliers fill our kanban containers, rather than filling purchase orders. Question 2 Our suppliers deliver to us in kanban containers, without the use of separate
packaging.
Question 3 We use a kanban pull system for production control.
Question 4 We use kanban squares, containers or signals for production control. *: Items are deleted
Repetitive Nature of Master Schedule
Question 1 Our master schedule repeats the same mix of products, from hour to hour and day to day.
Question 2 The master schedule is level-loaded in our plant, from day to day. Question 3 A fixed sequence of items is repeated throughout our master schedule. Question 4 Within our schedule, the mix of items is designed to be similar to the
forecasted demand mix.
Question 5 We use a repetitive master schedule from day to day. QuestionR 6 Our master schedule does not facilitate JIT production. Setup Time Reduction
Question 1 We are aggressively working to lower setup times in our plant.
Question 2 We have converted most of our setup time to external time, while the machine is running.
Question 3 We have low setup times of equipment in our plant.
Question 4 Our crews practice setups, in order to reduce the time required. Question 5 Our workers are trained to reduce setup time.
QuestionR 6 Our setup times seem hopelessly long. Synchronization of Operations
Question 1 Capacities are balanced in our supply network.
Question 2 Our manufacturing capacity is balanced throughout the entire manufacturing process.
Question 3 We can easily determine bottleneck operations in our supply chain. QuestionR 4 We have large in-process inventories between different operations. Question 5 Our suppliers do not use large inventories to supply us.
Theory of Constraints
Question 1 We consistently monitor work-in-process in front of each process to identify the bottleneck (constraint) in the production system.
Question 2 We make every effort to minimize or eliminate idle time of the bottleneck process.
Question 3 We control non-bottleneck processes’ levels of utilization and timing of the order release by taking into account the capacity of the bottleneck process. Question 4 We consistently make efforts to increase the capacity of the bottleneck
process.
Question 5 We assign parts to be processed in the bottleneck process by identifying those with the earliest due dates.
Question 6 We make sure that only good parts are processed through the bottleneck process.
Question 7 We consider an hour lost in the bottleneck process as an hour lost for the whole plant.
Question 8 We balance the flow of products through the production facility, rather than balancing the capacities of the processes.
*: Items are deleted
Appendix B
Measures of HRM practices Cooperation
Question 1 We work as a partner with our suppliers, rather than having an adversarial relationship.
Question 2 We encourage employees to work together to achieve common goals, rather than encourage competition among individuals.
Question 3 We work as a partner with our customers.
Question 4 We believe that cooperative relationships will lead to better performance than adversarial relationships.
Question 5 We believe that the need for cooperative relationships extends to both employees and external partners.
Question 6 We believe than an organization should work as a partner with its surrounding community.
QuestionR 7 Sometimes we encourage competition among employees, in order to improve their performance.
*: Item is deleted
Employee Suggestions – Implementation and Feedback
Question 1 Management takes all product and process improvement suggestions seriously.
Question 2 We are encouraged to make suggestions for improving performance at this plant.
Question 3 Management tells us why our suggestions are implemented or not used. Question 4 Many useful suggestions are implemented at this plant.
Flatness of Organization Structure
Question 1 Our organization structure is relatively flat.
Question 2 There are few levels in our organizational hierarchy. QuestionR 3 Our organization is very hierarchical.
QuestionR 4 There are many levels between the lowest level in the organization and top management.
QuestionR 5 Our organizational chart has many levels. Multi-Functional Employees
Question 1 Our employees receive training to perform multiple tasks. Question 2 Employees at this plant learn how to perform a variety of tasks.
Question 3 The longer an employee has been at this plant, the more tasks they learn to perform.
Question 4 Employees are cross-trained at this plant, so that they can fill in for others, if necessary.
QuestionR 5 At this plant, each employee only learns how to do one job. Small Group Problem Solving
Question 1 During problem solving sessions, we make an effort to get all team members’ opinions and ideas before making a decision.
Question 2 Our plant forms teams to solve problems.
Question 3 In the past three years, many problems have been solved through small group sessions.
Question 4 Problem solving teams have helped improve manufacturing processes at this plant.
Question 5 Employee teams are encouraged to try to solve their own problems, as much as possible.
QuestionR 6 We don’t use problem solving teams much, in this plant. Task-Related Training for Employees
Question 1 Our plant employees receive training and development in workplace skills, on a regular basis.
Question 2 Management at this plant believes that continual training and upgrading of employee skills is important.
Question 3 Employees at this plant have skills that are above average, in this industry. Question 4 Our employees regularly receive training to improve their skills.
Question 5 Our employees are highly skilled, in this plant. *: Item is deleted
Top Management Leadership for Quality
Question 1 All major department heads within the plant accept their responsibility for quality.
Question 2 Plant management provides personal leadership for quality products and quality improvement.
Question 3 The top priority in evaluating plant management is quality performance. Question 4 Our top management strongly encourages employee involvement in the
production process.
Question 5 Our plant management creates and communicates a vision focused on quality improvement.
Question 6 Our plant management is personally involved in quality improvement projects.
Appendix C
Manufacturing Performance Scales
Please circle the number that indicates your opinion about how your plant compares to its competition in your industry, on a global basis.
1: Poor, low end of industry; 2: Equivalent to competitors; 3: Average; 4: Better than average; 5: Superior
Unit cost of manufacturing 1 2 3 4 5
Conformance to product specifications 1 2 3 4 5
Flexibility to change product mix 1 2 3 4 5
On time delivery performance 1 2 3 4 5
On time new product launch 1 2 3 4 5
Product innovativeness 1 2 3 4 5
References
Aggrawal, S. C. and Aggrawal S., 1985. The management of manufacturing operations: an appraisal of recent developments. International Journal of Operations and Production Management, 5, 21-38. Ahmad A., Mehra S. and Pletcher M., 2004. The perceived impact of JIT implementation on firms'
financial/growth performance. Journal of Manufacturing Technology Management, Volume 15, Number 2, pp. 118-130.
Brown, K. and Mitchell, R. (1991). A comparison of Just-in-Time and Batch Manufacturing: The Role of Performance Obstacles. The Academy of Manufacturing Journal, Vol.34, No. 4.
Byron J., Finch, and James F. Cox, 1986. An examination of just-in-time management for the small manufacturer: with an illustration. Int. J. Prod. Res., Vol, 24, No. 2, pp. 329-342.
investment on employee and manufacturing performance: Australia and New Zealand evidence. International Journal of Production Research, Vol.43, No. 1, pp. 81-107.
Chase R., Jacobs F., Aquilano N., 2003. Operations Management for competitive advantage. Tata McGraw hill, New Delhi.
Cua, K., Mckone K., and Schroeder R., 2001. Relationship between implementation of TQM, JIT, and TRM and manufacturing performance. Journal of Operations Management, 19, pp. 675-694. Delaney, J. and Huselid, M. 1996. The Impact of Human Resource Management Practices on
Perceptions of Organizational Performance. Academy of Management Journal, 39, 949-969. Flynn B. B., Schroeder R.G. and Sakakibara S., 1995. A framework for quality management research
and associated measurement instrument. Journal of Operations management, 11, 339-366.
Flynn Barbara B., sakakibara Sadao and Schroeder Roger G., 1995. Relationship between JIT and TQM: Practices and performance. Academy of Management Journal, Vol.38, No. 5, pp. 1325-1360. Forza, C., 1996. Work organization in lean production and traditional plants: what are the differences?
International Journal of Operations and Production Management, 16, 42-62.
Fullerton R. and McWatters C., 2001. The production performance benefits from JIT implementation. Journal of operations Management, 19, pp. 81-96.
Hall, R. W., 1986. Attaining Manufacturing Excellence. Irwin, New York. Hall, R.W., 1983. Zero inventories. Dow-Jones Irwin, Homewood, IL.
Hallihan, A., Sackett, P. and Williams, G. M., 1997. JIT manufacturing: the evolution to an implementation model founded in current practice. International Journal of Production Research, vol. 35, No. 4, pp. 901-920.
Hayes, R. and Wheelwright S., 1984. Restoring our competitive edge: competing through manufacturing. Wily, New York.
Hill T., 1989. Manufacturing strategy Text and Cases. Irwin, Homewood, IL.
Hopkins, S. A., 1989. An integrated model of management and employee influences in just-in-time implementation. Advanced Management Journal, 54, 15-20.
Huselid M. and Becker B., 2000. Comment on measurement error in research on human resource and firm performance: How much error is there and how does it influence effect size? Personnel Psychology, 53, 835-854.
Huson, M., Nanda, D., 1995. The impact pf Just-In-Time manufacturing on firm performance in the US. Journal of Operations Management 12, 297-310.
Imai, M., 1997. Gemba Kaizen: A commonsense, low-cost approach to management. New York: McGraw-Hill.
Johnson Thomas and Manoochehri, G.H., 1990. Adopting JIT: Implications for Worker Roles and Human Resource Management, Industrial Management, May/June.
Koch, M. and McGrath, R., 1996. Improving Labor Productivity: Human Resource Management Policies Do Matter. Strategic Management Journal, 17, 335-54.
Lado, A.A., Wilson, M.C., 1994. Human resource systems and sustained competitive advantage: a competency-based perspective. Academy of Management Journal 19 (4), 699-727. p. 701.
No.9, 2037-2049.
Lawrence John and Hottenstein Michael, 1995. The relationship between JIT manufacturing and performance in Mexican plants affiliated with U.S. companies. Journal of Operations Management, 13, pp. 3-18.
Liker, J., 1998. Becoming lean: inside stories of U.S. manufacturers. Portland: Productivity Press. Liker, J., 2004. The Toyota Way: 14 management principles from the world’s greatest manufacturer.
New York: McGraw-Hill.
Lindberg, P., Voss, C. and Blackmon, K., 1998. International Manufacturing strategies: context, content and change. Boston: Kluwer Academic Publishers.
MacDuffie J., 1995. Human resource bundles and manufacturing performance: Organizational logic and flexible production systems in the world auto industry. Industrial and Labor Relations Review, 48, 197-221.
Markham, I. S. and McCart, C. D., 1995. The road to successful implementation of Just-In-Time systems. Production and Inventory Management Journal, 36, 3, pg.67.
McKone K., Schroeder R., Cua K., 2001. The impact of total productive maintenance on manufacturing performance. Journal of Operations Management 19, 39-58.
McLachlin Ron, 1997. Management initiatives and just-in-time manufacturing. Journal of Operations management, 15, pp.271-292.
Mehra, S. and Inman, R., 1992. Determining the critical elements of just-in-time implementation. Decision Sciences, 23, 1, pg. 160.
Monden, Y., 1983. Toyota production system. Institute of Industrial Engineering, Atlanta.
Moras, R. G. and Dieck, A. J., 1992. Industrial Applications of Just-In-Time: lessons to be learned. Production and Inventory Management Journal, 33, 3, pg. 25.
Nelson, R. and winter, S., 1982. An Evolutionary Theory of Economic Change. Harvard University Press, Cambridge, MA.
Nunnally, J., 1978. Psychometric Theory. 2nd ed. McGraw-Hill, New York.
Pil, F. and MacDuffie, J., 1996. The adoption of high-involvement work practices. Industrial Relations 35 (3), 423-455.
Power Damien and Sohal Amrik, 2000. Human resource management strategies and practices in Just-In-Time environments: Australian case study evidence. technovation, 20, pp.373-387.
Ramarapu, N.K., Mehra, S. and Frolick, M.N., 1995. A comparative analysis and review of JIT implementation research. International Journal of Operations & production management; Vol. 15, No. 1, pp.38-49.
Sakakibara S., Flynn B. B., Schroeder R. G., 1993. A framework and measurement instrument for Just-in-time manufacturing. Production and Operations Management, Vol. 2, No. 3.
Sakakibara Sadoa, Flynn Barbara B., Schroeder Roger G. and Morris William T., 1997. The Impact of Just-in-time Manufacturing and its Infrastructure on manufacturing Performance. Management Science, Vol. 43, No. 9, September.
Salaheldin, I. S., 2005. JIT implementation in Egyptian manufacturing firms: some empirical evidence. International Journal of operations & Production Management, Vol. 25, No. 4, pp.354-370.