Effect of repetitive transcranial magnetic
stimulation (rTMS) on local neural activity
examined by the simultaneous recording of
electrocorticogram (ECoG) and motor evoked
potential (MEP) in monkeys.
著者
Honda Yasutaka
学位授与機関
Tohoku University
学位授与番号
11301
博 士 論 文
Effect of repetitive transcranial magnetic stimulation (rTMS)
on local neural activity
examined by the simultaneous recording of electrocorticogram
(ECoG) and motor evoked potential (MEP) in monkeys.
反復経頭蓋磁気刺激による神経活動変化
- サル皮質硬膜下電位と誘発筋電図の同時計測 -
令和2年度
東北大学大学院生命科学研究科
脳生命統御科学専攻
本田 保貴
A part of this study was conducted as a collaborative research with Kentaro Ogawa, a Ph.D. course
student of the lab. Some ECoG and EEG data presented in this thesis contains those collected by
Kentaro Ogawa. Data analysis and figure productions were exclusively conducted by myself.
A part of this study was published in following paper.
Honda Y, Nakamura S, Ogawa K, Yoshino R, Tobler PN, Nishimura Y, Tsutsui KI (2021) Changes in beta and high-gamma power in resting-state electrocorticogram induced by repetitive transcranial magnetic stimulation of primary motor cortex in unanesthetized macaque monkeys.
1
Abstract
Introduction: Repetitive transcranial magnetic stimulation (rTMS) has been increasingly used in the fields
of basic and clinical neurosciences for facilitating or inhibiting local neural activity. Functional features of rTMS have mainly been studied in healthy human volunteers by measuring the changes in the amplitude of motor-evoked potential (MEP) evoked by single-pulse TMS of the primary motor cortex (MI) as an indirect index of the MI activity. In such evaluation, the increase and decrease of the amplitude of MEP after the rTMS can be interpreted as results of the facilitatory and inhibitory effects, respectively, of the specific pattern of trains used. From earlier studies, it has become as established fact that low-frequency stimulation (typically ≤ 1 Hz) induces the inhibition of local neural activity, whereas the intermittent high-frequency stimulation (typically ≥ 5 Hz) induces facilitation. However, there have been much fewer studies concerning the direct electrophysiological evaluation of neural changes induced by rTMS in the stimulated site of the brain. Inconsistent results have been obtained from studies by recording and evaluating resting-state electroencephalograms (EEGs) before and after rTMS. In this study, using awake and unanesthetized macaque monkeys as experimental subjects, we aimed to record the changes in the neural activity of a cortical area targeted by rTMS, in the form of electrocorticograms (ECoGs) recorded using subdurally implanted electrodes. Owing to the high signal-to-noise ratio, we expected that ECoG recordings would enable better evaluation of relatively higher frequency bands, such as gamma and beta bands, which could be difficult in conventional EEG recordings. Macaque monkeys are a suitable model of humans as rTMS subjects because their brains are big enough to limit the direct effect of rTMS to a small portion of cerebral cortex, while using the standard stimulation coil for humans (70 mm figure-of-eight coil).
Method: The resting-state ECoG signals recorded through subdurally implanted electrodes and the MEPs
in the abductor pollicis brevis muscle in the contralateral hand were repeatedly measured in two awake and unanesthetized macaque monkeys before and after the rTMS session. Repetitive and single-pulse TMS was applied targeting the unilateral MI. The intensities of TMS pulses were set to 150% and 100% of the resting motor threshold (rMT) of each monkey for rTMS and single-pulse TMS, respectively. The rMT of each monkey was defined as the machine output that produced a visible twitch in its thumb on 5 out of 10 TMS pulses delivered to the MI while the monkey quietly sat on the monkey chair. The stimulation frequency was set to 0.5, 1, 2, 5 and 10 Hz. At all stimulation frequencies, a total of 1200 pulses of rTMS were given in 20 min. Before and after an rTMS session, single-pulse TMS was applied at 1-min intervals for 60 min
2
and 120 min, respectively. In 1-Hz and 10-Hz conditions, we conducted additional experiments with the stimulation intensity of rTMS set to 125, 100 and 75% of rMT.
Result: A significant decrease in the beta band power was observed after 1-Hz rTMS with a significant
decrease in the MEP amplitude, whereas a significant increase in the high-gamma band power was observed after 10-Hz rTMS with a significant increase in the MEP amplitude. There were no significant changes in each ECoG band power and the amplitude of MEP after 0.5, 2, and 5-Hz rTMS. Consistent changes in ECoG and MEP, such as those observed with 150% rMT, were not observed at lower stimulus intensities. In monkey A, ECoG signals were also recorded from the electrode over the DLPFC and PPC. We found no significant changes in ECoG signals from the remote electrodes in terms of power of two frequency bands (beta and high-gamma) following either of the 1-Hz or 10-Hz rTMS application.
Discussion: The major findings of this study was that, in the resting-state ECoG signals of the stimulation
site, the decrease in beta band power and the increase in high-gamma band power were induced after 1-Hz and 10-Hz rTMS, respectively, in both monkeys. As indicated in previous studies that beta and high-gamma activities in the ECoG reflect the synchronous firing and the firing frequency, respectively, of cell assembly in local neural circuits, our results suggest that the 1-Hz rTMS inhibits the neural excitability by desynchronizing the local circuit activity, and that the 10-Hz rTMS facilitates the neural excitability by increasing the firing of neurons in the local circuits. Interestingly, neither of the changes of band powers in ECoG nor those of MEP amplitudes were observed in 0.5, 2 or 5 Hz rTMS conditions. These results suggest that 1-Hz and 10-Hz rTMS are the specific frequency working for inhibiting and facilitating the neural excitability, respectively. The band power changes appeared to be limited to the stimulation site, as no change was found in the power of beta or high-gamma band in the ECoG signals from remote electrodes such as those in the DLPFC or PPC. The examination of the effect of rTMS of different intensities have shown that only with the intensity of rMT 150% can the effects be stable, and with that of rMT 125, 100 or 75%, effects would be weak and unstable. To obtain stable effects of rTMS, it may be important to use high intensities.
3
Table of Contents
Abstract
1
Table of Contents
3
1. Introduction
4
2. Materials and methods
6
2-1. Subjects
6
2-2. Non-invasive head fixation and chair training
6
2-3. ECoG electrode arrays and surgery for implantation
8
2-4. TMS protocols
11
2-5. Data acquisition and analysis
12
2-6. Simulation of the electric field induced by single-pulse TMS
13
3. Results
14
3-1. Changes in different ECoG band powers and MEP amplitude.
15
3-2. Changes in ECoG band powers and MEP amplitude following rTMS sessions of
different stimulation frequencies.
16
3-3. Changes in ECoG band powers and MEP amplitude following rTMS sessions of
different stimulation frequencies.
19
3-4. Time courses of Changes in ECoG band powers and MEP amplitude.
20
3-5. The range of rTMS effects
22
3-6. The simulation of the electric field induced by single-pulse TMS
22
Discussion
25
Conclusions
28
Declaration of Collaboration
エラー! ブックマークが定義されていません。
Acknowledgements
29
4
1. Introduction
Repetitive transcranial stimulation (rTMS) has been increasingly used in the fields of basic and clinical neurosciences for facilitating or inhibiting local neural activity (Fitzgerald et al., 2006; Pell et al., 2011; Thut & Pascual-Leone, 2010). Functional features of rTMS have mainly been studied in healthy human volunteers by measuring the changes in the amplitude of motor-evoked potential (MEP) elicited by single-pulse TMS of the primary motor cortex (MI). In such evaluation, the increase and decrease in the amplitude of MEP after the rTMS can be interpreted as results of the facilitatory and inhibitory effects, respectively, of the specific pattern of trains used. From earlier studies, it has become an established fact that low-frequency stimulation (typically ≤ 1 Hz) induces the inhibition of local neural activity (Chen et al., 1997; Maeda et al., 2000a, 2000b), whereas the intermittent high-frequency stimulation (typically ≥ 5 Hz) induces facilitation (Maeda et al., 2000a, 2000b; Pascual-leone et al., 1994). However, there was no consistent outcomes due to different parameter settings, such as stimulation frequency, stimulation intensity, the number of stimulus and the length of the rTMS session. For the better understandings of the functional features of TMS and the discovery of the most effective parameter settings for inhibitory and facilitatory interventions, we considered that it would be necessary to conduct a systematic study with parametric condition settings and within-subject design.
Moreover, there have been much fewer studies concerning the direct electrophysiological evaluation of neural changes induced by rTMS in the stimulated site of the brain. Inconsistent results have been obtained from studies by recording and evaluating resting-state scalp electroencephalograms (EEGs) before and after rTMS (for low-frequency rTMS: Berger et al., 2013; Cincotta et al., 2015; Piccione et al., 2011; Pripfl et al., 2014; Woźniak-Kwaśniewska et al., 2014; for high-frequency rTMS: Berger et al., 2013; Brignani et al., 2008; Kim et al., 2012; Qiu et al., 2019; Woźniak-Kwaśniewska et al., 2014). Some of the inconsistencies of the results in those studies may be due to scalp EEGs being a relatively indirect and noisy measure of neural activity. Here we used awake and unanesthetized macaque monkeys as experimental subjects, and recorded the changes in the neural activity of a cortical area targeted by rTMS, in the form of electrocorticograms (ECoGs) recorded using subdurally implanted electrodes. Owing to the high signal-to-noise ratio, we expected that ECoG recordings would enable better evaluation of relatively higher frequency bands, such as the gamma and beta bands, which could be difficult in conventional scalp EEG recordings. Macaque monkeys are a suitable model of humans as rTMS subjects, because their brains are big enough to limit the direct effect of rTMS to a small portion of the cerebral cortex, while using the standard
5
stimulation coil for humans (70 mm figure-of-eight coil). In this study, by taking the advantage of invasive animal study, we aimed to investigate systematically the various stimulation parameter settings (stimulation frequencies and intensities) by recording ECoG and MEP repeatedly in same subjects.
6
2. Materials and methods
2-1. Subjects
Two Japanese monkeys (Macaca fuscata; both aged 4 years; body weight, 7.7 kg and 6.6 kg; sex, male and female for monkeys A and B, respectively; the ages and weights were those at the start of the study) served as experimental animals in this study. All experimental and surgical procedures were conducted in accordance with the Guide for the Care and Use of Laboratory Animals of the National Institutes of Health and Guidelines for Animal Care and Use of Tohoku University. This project was approved by the Center for Laboratory Animal Research of Tohoku University and the committee of the National BioResource Project (NBRP Core Facility Upgrading Program, Kyoto University Primate Research Institute and National Institute for Physiological Sciences).
2-2. Non-invasive head fixation and chair training
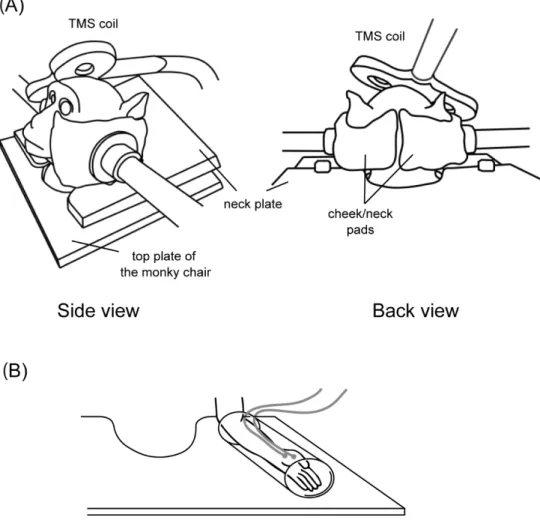
The monkeys were trained to sit relaxed on a monkey chair with their head and one arm restrained for TMS and simultaneous ECoG and MEP recordings. For the head restraint, we used a non-invasive head fixation device developed in our lab (Figure 1). This device tightly restrains the head movement by applying pressure to the lower part of the head with a pair of “cheek/neck pads”. Leaving the upper part of the head free, it allows relatively good access to the skull with TMS coils from the top or at a perpendicular angle. The inner sides of the cheek/neck pads were covered with urethane cushion for comfort. The forearm contralateral to the TMS target hemisphere was loosely restrained in a tube.
7
Figure 1. Non-invasive head and arm fixation device. (A) Monkeys were trained to sit relaxed in a
monkey chair, with their head fixed by a pair of cheek/neck pads that apply pressure from both sides of the face. (B) The forearm contralateral to the TMS was loosely fixed in a tube attached to the horizontal lumber plate of the monkey chair for the recording of MEPs. MEPs were recorded from the APB muscle on the hand contralateral to the TMS.
8
2-3. ECoG electrode arrays and surgery for implantation
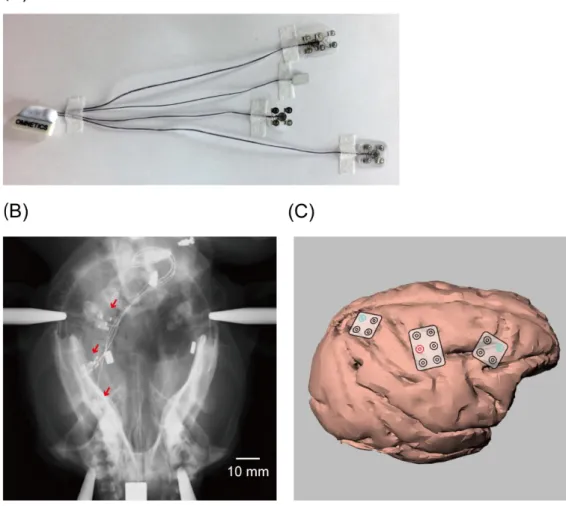
We used custom-designed ECoG electrode arrays (Unique Medical Co, Ltd, Tokyo, Japan; Figure 2Aand 3A) for the recording of cortical neural activity. In each electrode array, platinum electrodes of 1 mm diameter were embedded in a silicon sheet at intervals of 4 mm. Lead lines from the electrodes were connected to a connector (Omnetics Connector Corporation, Minnesota, USA).
Preceding the implantation surgery, MR and CT images of the head were taken for each monkey under anesthesia induced with a combination of medetomidine (0.04 mg/kg, i.m.), midazolam (0.3 mg/kg, i.m.), and butorphanol (0.4 mg/kg, i.m.). A three-dimensional (3D) model of the brain and skull were reconstructed for each monkey on the basis of these images (Osirix, Pixmeo SARL, Geneve, Switzerland). For the implantation surgery, the animals were anesthetized initially with ketamine (10 mg/kg, i.m.) and xylazine (0.5 mg/kg, i.m.), which was followed by isoflurane (1–2%) inhalation for maintenance. In monkey A, the ECoG electrode arrays were implanted subdurally over the primary motor and sensory cortices (MI/SI), dorsolateral prefrontal cortex (DLPFC), and posterior parietal cortex (PPC). A 3 × 2 array was used for the MI/SI, and 2 × 2 arrays were used for the DLPFC and PPC. In monkey B, a 4 × 5 array was implanted subdurally over the MI/SI. The lead connector was set in an acrylic chamber and fixed to the posterior part of the skull with dental cement (Super-Bond, Sun Medical, Shiga, Japan). After the implantation of the electrodes and the installation of the connector and the chamber on the skull, the opening of the skull was covered by fixing the original bone flap, and the muscle and skin were sutured back in place to cover the entire skull. After recovery from the surgery, X-ray images of the head were taken for monkey A (Figure 2B). The precise locations of the electrodes were estimated by superimposing the X-ray images onto the 3D model constructed from the MR and CT images (Figure 2C). The locations of the electrodes in monkey B were estimated by digital photographs taken during the surgery (Figure 3B).
Monkey B served for an additional experiment which was conducted to evaluate the two-dimensional spread of the TMS effect over the cortical surface. Under a surgical procedure, the 4 × 5 electrode array was removed from the right hemisphere and a new 5 × 6 electrode array with intervals of 5 mm between each electrode was implanted to the contralateral (left) hemisphere to cover a wide area centering in the MI/SI (Figure 3C). The locations of the electrodes were estimated using X-ray images as described above (Figures 3D–E).
9
Figure 2. Implantation of ECoG electrode sheets (monkey A). (A) ECoG electrode sheets used in the
study. (B) X-ray image of the monkey head taken after the ECoG electrode implantation. Red arrows indicate the ECoG electrode sheets. (C) Location of the ECoG electrode arrays on the brain reconstructed from the postoperative X-ray image and the preoperative CT and MR images. Three ECoG electrode sheets were implanted over the DLPFC, MI/SI, and PPC. We analyzed the data obtained from the electrode covering the MI hand area (marked in red) and those covering the DLPFC and PPC (marked in blue).
10
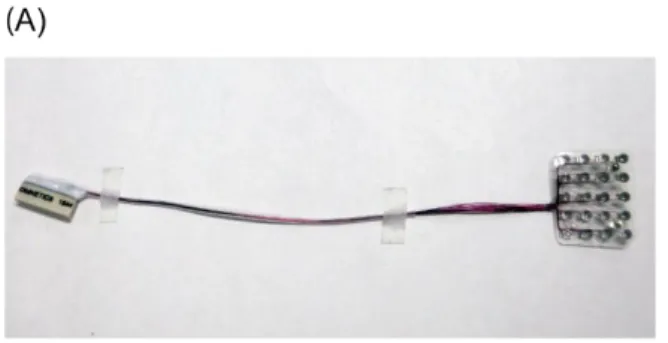
Figure 3. Implantation of ECoG electrode sheets (monkey B). (A) The first ECoG electrode sheet used
in the study. (B) The location of the first ECoG electrode array on the brain estimated from pictures taken during the surgery for the electrode implantation. The ECoG electrode sheet was implanted over the MI. We analyzed the data obtained from the electrode covering the MI hand area (marked in red). (C) The second electrode sheet used in the additional experiment. (D) The X-ray image of the monkey head taken after the ECoG electrode implantation. (E) The location of the second ECoG electrode arrays on the brain reconstructed from the postoperative X-ray image and the preoperative CT and MR images. An electrode
11 covering the MI hand area is marked in red.
2-4. TMS protocols
Repetitive and singe-pulse TMS was applied targeting the unilateral MI through a 70-mm figure-of-eight coil with a Magstim Rapid2 stimulator (Magstim, UK). The coil was placed tangentially to the scalp with
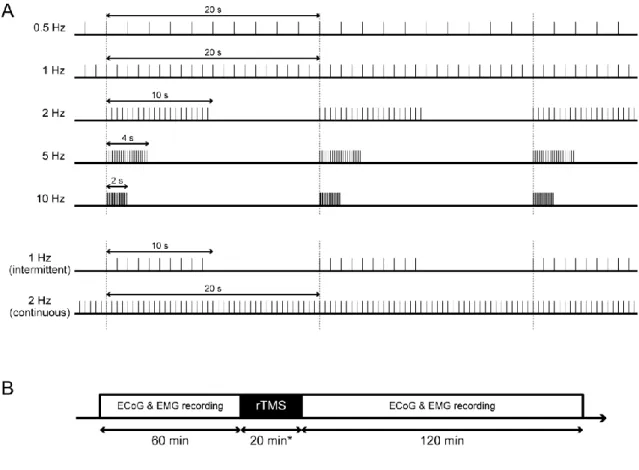
the handle pointing backwards and laterally at a 45° angle to the sagittal plane inducing a posterior–anterior current in the brain (Gilio et al., 2003; Laakso et al., 2018). The location of the coil was determined so that the maximum amplitude of MEP can be obtained in the abductor pollicis brevis (APB) muscle contralateral to the TMS site. The orientation and location of the TMS coil were kept constant during the entire daily session. The intensities of TMS pulses were set to 150% and 100% of the resting motor threshold (rMT) of each monkey for rTMS and single-pulse TMS, respectively. The rMT of each monkey was defined as the minimal machine output required to induce MEPs of at least 50 μV amplitude in 5 out of 10 TMS pulses delivered to the MI while the monkey quietly sat on the monkey chair. The stimulation frequency was set to 0.5, 1, 2, 5 and 10 Hz (Figure 3A). In 0.5- and 1-Hz conditions, TMS pulses were delivered continuously for 40 and 20 min, respectively. In 2-, 5- and 10-Hz conditions, a 10-, 4- and 2-s train of TMS pulses at each frequency (20 pulses) were delivered 60 times at 10-, 16- and 18-s intervals, respectively. At all stimulation frequencies, a total of 1200 pulses of rTMS were given in 20 min (except the 0.5-Hz condition: 40 min). Before and after an rTMS session, single-pulse TMS was applied at 1-min intervals for 60 min and 120 min, respectively (Figure 3B). In 1- and 10-Hz conditions, we conducted additional experiments with the stimulation intensity of rTMS set to 125, 100 and 75% of rMT (The experiment with 75%-intensity condition was conducted only for monkey A.). In monkey A, 1-Hz rTMS with 10-s intervals for every 10 s (1200 pulses, 40 min) and 2-Hz rTMS without intervals (1200 pulses, 10 min) were applied as additional conditions.
12
Figure 3. rTMS protocols. (A) In 0.5- and 1-Hz rTMS protocol, TMS pulses were continuously delivered
for 40 and 20 min, respectively. In 2-, 5- and 10-Hz rTMS protocol, a 10-, 4- and 2-s application of each frequency rTMS (20 pulses) was repeated with a 10-, 16- and 18-s interval, respectively. Note that the numbers of TMS pulses per unit time were the same between these protocols (20 pulses per 20 s, *except the 0.5-Hz protocol: 10 pulses per 20 sec for 40 min). In 1-Hz rTMS with interval, a 10-s application of rTMS (10 pulses) was repeated with a 10-s interval (totally 1200 pulses in 40 min). In 2-Hz continuous rTMS, TMS pulses were continuously delivered for 10 min (totally 1200 pulses). (B) Before and after the rTMS session, single-pulse TMSs were applied with 1 min intervals for 60 and 120 min, respectively, while the resting-state ECoG signals and the evoked MEPs were recorded.
2-5. Data acquisition and analysis
In a daily session, ECoG and electromyogram (EMG) signals were recorded for 60 and 120 min, before and after the application of rTMS, respectively, as single-pulse TMS was applied at 1-min intervals. Each daily experimental session was followed by a minimum of 2 days of rest to ensure the complete recovery from rTMS aftereffects. The order of all frequency and intensity conditions was pseudorandomized. ECoG
13
signals from each electrode were amplified and digitalized at 10 kHz using a digital signal processing unit (CerebusTM system, Blackrock Microsystems, USA) and stored in a computer for offline analysis. The EMG
signals from two disposable surface electrodes (Vitrode F-150S G210C, Nihon Kohden, Japan) attached along the APB muscle contralateral to the stimulated hemisphere were amplified (BA1104, TEAC, Japan), digitalized at 10 kHz, and stored in the computer.
The ECoG signals obtained 100 ms before and 500 ms after the onset of each TMS pulse were excluded from analysis to exclude artifacts of TMS pulses. In addition, to exclude segments of ECoG or EMG signals with apparently large noise, such as movements of the monkey, we conducted automated artifact rejections by using a homemade software written in MATLAB (Math Works Inc., MA, USA). For the ECoG data, following notch filtering (50, 100, 150, and 200 Hz) and band-pass filtering (low-cut filtering, 3 Hz; high-cut filtering, 500 Hz), frequency spectrograms were obtained using a signal processing toolbox in MATLAB (sliding window size, 200 ms; overlap, 100 ms). ECoG frequency bands were defined as follows: beta (12–32 Hz), low-gamma (32–80 Hz), and high-gamma (80–200 Hz) (Buzsáki & Draguhn, 2004; Ray & Maunsell, 2011). The MEP was defined as a biphasic EMG wave evoked around 12 ms after single-pulse TMS, and the peak-to-peak amplitude was measured for every MEP wave induced.
2-6. Simulation of the electric field induced by single-pulse TMS
A three-dimensional model was created from a standard monkey brain template MRIs (National Institute of Mental Health Macaque Template: NMT) by using simNIBS (simulation of Non-invasive Brain Stimulation Methods (Opitz et al., 2011; Romero et al., 2019; Thielscher et al., 2015)). Five different tissue types were defined, and the conductivity values were fixed: 0.126 S/m (white matter; WM), 0.275 S/m (gray matter; GM), 1.654 S/m (CSF), 0.01 S/m (skull), 0.465 S/m (scalp). The rate of change of the coil current (dI/dt) was set to 1.0 × 10⁶ A/s (70 % of maximum stimulator output = 150% of rMT of monkey B).
A Magstim 70 mm figure-of-eight coil with 15 mm distance from MI surface, as measured in the standard brain MRIs, was applied in this simulation.
14
3. Results
The effects of each rTMS condition on resting-state ECoG signals in the stimulated MI and the MEPs in the APB muscle in the contralateral hand were repeatedly monitored in the two monkeys. Typical examples of frequency spectrograms derived from ECoG signals and EMG traces recorded before and after the 1-Hz and 10-Hz rTMS are shown in Figure 4. As shown in the spectrograms (Figure 4, top in each panel), 1-Hz rTMS induced an overall decrease in the low-frequency band power, whereas 10-Hz rTMS induced an overall increase in the high-frequency band power. The MEP amplitude decreased following the 1-Hz rTMS, whereas it increased after the 10-Hz rTMS (Figure 4, bottom in each panel).
15
Figure 4. Typical ECoG spectrograms and MEP traces before and after applying rTMS over MI.
Color maps illustrate frequency analysis (spectrograms) of ECoG signals recorded before and after the rTMS sessions with 1 Hz (top) and 10 Hz (bottom). Data around single pulses was excluded from the analysis because of stimulation artifacts (white area in each plot). Lower traces in the panels illustrate EMG signals recorded simultaneously with ECoG signals. Insets show enlarged traces of post-TMS EMG signals, in which the MEPs clearly appeared approximately 12 ms after the onset of stimulation artifacts.
3-1. Changes in different ECoG band powers and MEP amplitude.
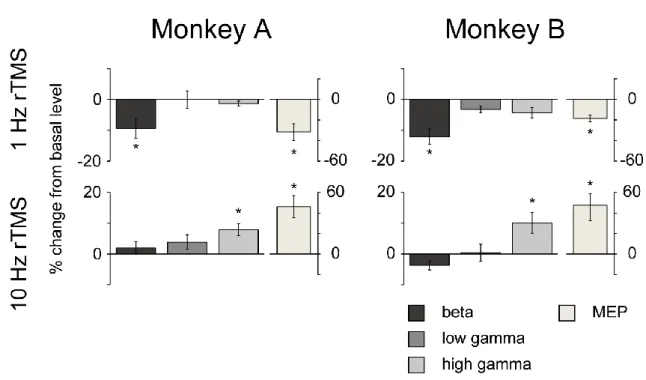
Average percent changes of ECoG signals of different frequency bands [beta (12–32 Hz), low-gamma (32– 80 Hz), and high-gamma (80–200 Hz)] and those of the amplitudes of MEPs in the two monkeys are shown in Figure 5. Following the 1-Hz rTMS application, significant decreases in ECoG beta band power and MEP amplitude were observed in both monkeys. Following the 10-Hz rTMS application, significant increases in ECoG high-gamma power and MEP amplitude were observed in both monkeys.
Figure 5. Changes in ECoG band powers and MEP amplitude following 1-Hz and 10-Hz rTMS.
16
and MEP amplitude for the 1-Hz (top) and 10-Hz (bottom) rTMS. Significant decreases were observed in the beta power (p = 4.1 × 10⁻² and 8.5 × 10⁻³ for monkeys A and B, respectively) and MEP amplitude (p =
1.2 × 10⁻² and 2.5 × 10⁻³ for monkeys A and B, respectively) after the 1-Hz rTMS, whereas significant
increases were observed in the high-gamma power (p = 1.1 × 10⁻² and 3.0 × 10⁻² for monkeys A and B,
respectively) and MEP amplitude (p = 7.4 × 10⁻³ and 8.3 × 10⁻³ for monkeys A and B, respectively) after
the 10-Hz rTMS. Error bars represent SEM. *p < 0.05, paired t-test (uncorrected) between 60 min before and 60 min after rTMS on the MI.
3-2. Changes in ECoG band powers and MEP amplitude following rTMS sessions of different
stimulation frequencies.
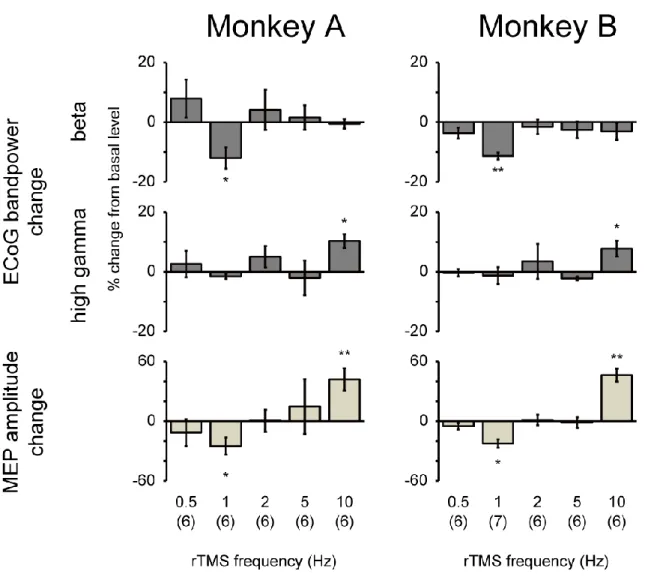
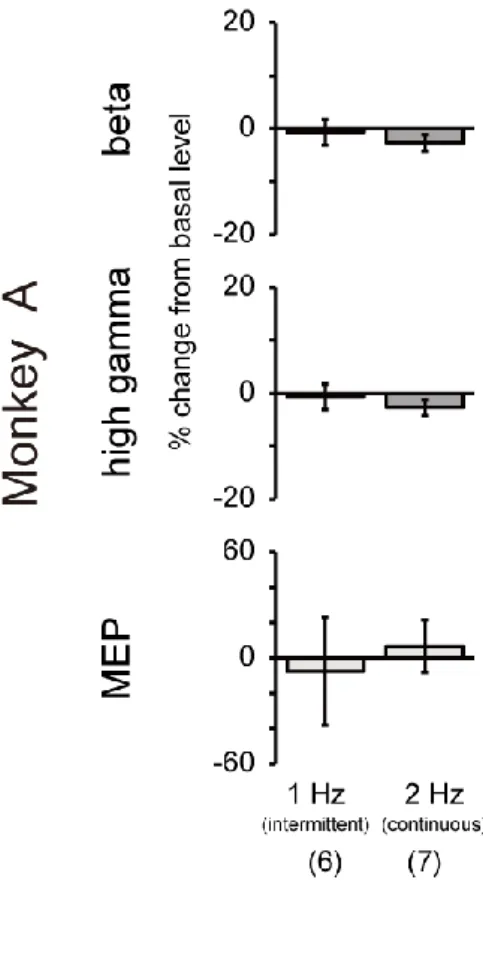
Average percent changes of beta and high-gamma powers and MEP amplitude in the two monkeys after the various stimulation frequencies of rTMS are shown in Figure 6. A significant decrease in the beta band power was observed after 1-Hz rTMS with a significant decrease in the MEP amplitude, whereas a significant increase in the high-gamma band power was observed after 10-Hz rTMS with a significant increase in the MEP amplitude. There were no significant changes in each ECoG band power and the amplitude of MEP after 0.5, 2, and 5-Hz rTMS. To confirm whether intervals affect the efficacy of low-frequency rTMS, 1-Hz rTMS with 10-s intervals for every 10 s (1200 pulses, 40 min) and 2-Hz rTMS without intervals (1200 pulses, 10 min) were applied to monkey A (Figure 7). There were no significant changes in either condition.
17
Figure 6. Changes in ECoG band powers and MEP amplitude following rTMS sessions of different stimulation frequencies. Percent changes in beta (12–32 Hz) and high-gamma (80–200 Hz) band powers
and MEP amplitude for 0.5-, 1-, 2-, 5- and 10-Hz rTMS. Significant decreases were observed in the beta power (p = 2.7 × 10⁻² and 7.1 × 10⁻⁴ for monkeys A and B, respectively) and MEP amplitude (p = 3.6 ×
10-3 and 10-3.7 × 10⁻³ for monkeys A and B, respectively) after the 1-Hz rTMS, whereas significant increases
were observed in the high-gamma power (p = 1.2 × 10⁻² and 8.5 × 10⁻³ for monkeys A and B, respectively)
and MEP amplitude (p = 9.6 × 10⁻³ and 1.1 × 10⁻² for monkeys A and B, respectively) after the 10-Hz rTMS.
Error bars represent SEM. *p < 0.05 and **p < 0.01, paired t-test (uncorrected) between 30 min before and 30 min after rTMS on the MI.
18
Figure 7. Changes in ECoG band powers and MEP amplitude following 1-Hz (intermittent) and 2-Hz (continuous) rTMS in monkey A. Percent changes in
beta (12–32 Hz) and high-gamma (80–200 Hz) powers and MEP amplitude for 1-Hz (with interval) and 2-Hz (without interval) rTMS in monkey A. Error bars represent SEM. There were no significant changes in either condition.
19
3-3. Changes in ECoG band powers and MEP amplitude following rTMS sessions of different
stimulation frequencies.
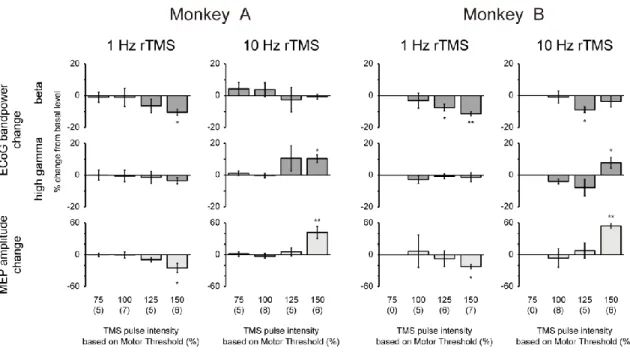
Average percent changes of beta and high-gamma powers and MEP amplitude in the two monkeys after the various stimulation intensities of rTMS are shown in Figure 8. Although significant decreases in the beta band power were observed in monkey B after 1-Hz and 10-Hz rTMS with 125% intensity of rMT, consistent changes in ECoG and MEP, such as those observed with 150% intensity of rMT, were not observed at lower stimulus intensities.
Figure 8. Changes in ECoG band powers and MEP amplitude following rTMS sessions of different stimulation intensities. Percent changes in beta (12–32 Hz) and high-gamma (80–200 Hz) band powers
and MEP amplitude for 75, 100, 125 and 150% rMT of rTMS. Significant decreases and increases were observed in the conditions of 150% intensity of rMT (see a legend of Figure 5). Significant decreases were observed in the beta power (p = 1.6 × 10⁻² and 5.6 × 10⁻³ for 1-Hz and 10-Hz rTMS, respectively, with
125% intensity of rMT). Error bars represent SEM. *p < 0.05 and **p < 0.01, paired t-test (uncorrected) between 30 min before and 30 min after rTMS on the MI.
20
3-4. Time courses of Changes in ECoG band powers and MEP amplitude.
Time courses of average percent changes of beta and high-gamma powers and MEP amplitude in the two monkeys after rTMS (1- and 10-Hz, 150% of rMT) are shown in Figure 9. After 1-Hz rTMS, significant decreases in the beta power lasted for 120 min in monkey A and B, respectively, whereas significant decreases in MEP amplitude lasted for 60 and 90 min in monkey A and B, respectively. After 10-Hz rTMS, significant increases in the high-gamma power lasted for 30 and 90 min in monkey A and B, respectively, whereas significant increases in MEP amplitude lasted for 90 and 120 min in monkey A and B, respectively. The beta band power in monkey B after the 10-Hz rTMS tended to keep lower for 120 min.
21
Figure 9. Time courses of changes in ECoG band powers and MEP amplitudes following the rTMS sessions of different protocols. Percent changes in beta (12-32 Hz) and high-gamma (80-200 Hz) power
and the MEP amplitude at each time point after the 1-Hz and 10-Hz rTMS. In monkey A, significant decreases in the beta power (p = 2.7 × 10⁻², 4.5 × 10⁻³ and 3.1 × 10⁻³ at 30, 90 and 120 min, respectively)
and MEP amplitude (p = 1.9 × 10⁻² and 8.7 × 10⁻³ at 30 and 60 min, respectively) after the 1-Hz rTMS,
whereas significant increases in the high-gamma power (p = 1.2 × 10⁻² at 30 min) and MEP amplitude (p =
4.8 × 10⁻³, 1.5 × 10⁻² and 1.5 × 10⁻³ at 30, 60 and 90 min, respectively) after the 10-Hz rTMS. In monkey
B, significant decreases in the beta power (p = 7.1 × 10⁻⁴, 1.4 × 10⁻² and 7.4 × 10⁻³ at 30, 90 and 120 min,
respectively) and MEP (p = 1.1 × 10⁻² and 1.7 × 10⁻² at 30 and 60 min, respectively) amplitude after the
1-Hz rTMS, whereas significant increases in the high-gamma power (p = 3.4 × 10⁻² and 4.1 × 10⁻² at 30 and
90 min, respectively) and MEP amplitude (p = 3.7 × 10⁻³ and 3.3 × 10⁻² at 30 and 120 min, respectively)
after the 10-Hz rTMS. The beta power from 30 to 60 min after the 10-Hz rTMS in monkey was also significantly decreased (p = 3.0 × 10⁻²). Error bars represent SEM. *p < 0.05 and **p < 0.01, paired t-test
22
3-5. The range of rTMS effects
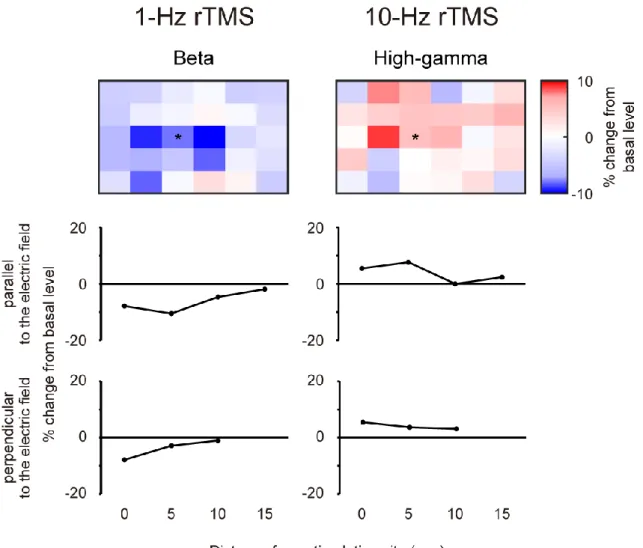
In monkey A, ECoG signals were recorded from the electrode over the DLPFC and PPC (Figure 10). We found no significant changes in ECoG signals from the remote electrodes in terms of power of two frequency bands (beta and high-gamma) following either of the 1-Hz or 10-Hz rTMS application. In monkey B, ECoG signals from were recorded from the 5 × 6 electrode array (Figure 11). For both 1-Hz and 10-Hz rTMS, the range of rTMS effects tended to be localized in 10 mm and 5 mm parallel and perpendicular to the electric field, respectively. Note that statistical tests were not applied due to the low number of sessions (n = 3).
Figure 10. Changes in ECoG band powers recorded from different areas after rTMS session
on the MI (monkey A).
Percent changes in beta (12-32 Hz), and high-gamma (80-200 Hz) band power for the 1 Hz (top) and 10 Hz (bottom) rTMS recorded in DLPFC (left) and PPC (right). Error bars represent SEM.23
Figure 11. The range of rTMS effects after 1-Hz and 10-Hz rTMS session (monkey B).Color maps illustrate averaged percent changes recorded from all of electrodes 30 min before and 30 min after the 1-Hz (top left) and 10-Hz (top right) rTMS (n=3). The electrode marked by an asterisk (*) means the location targeted by rTMS. The middle and bottom panels show the percent changes recorded from the electrodes which located parallel and perpendicular, respectively, to the electric field. X-axis shows the distance from the electrode targeted by rTMS.
24
3-6. The simulation of the electric field induced by single-pulse TMS
To study the range of TMS effects on neural activity, I performed simulations of electric field induced by single-pulse TMS by using SimNIBS. The coil was positioned over the MI hand area, and stimulation intensity was set to 70% of maximum of stimulator output (= 150% of rMT in monkey B). Figure 12 shows the distribution of the electric field induced by single-pulse TMS. With this electromagnetic simulation, the spread width measured ~20 mm in the AP direction and ~10 mm in the medio-lateral direction, respectively.
Figure 12. The model of electric field induced by single-pulse TMS.(A) A brain model reconstructed by using MRI data of a standard monkey brain template (National Institute of Mental Health Macaque Template: NMT). A yellow marker shows the target point (MI) in this simulation. The red and green line shows the direction parallel and perpendicular to the electrical current flow, respectively. (B) The distribution of simulated electric field induced by single-pulse TMS with the figure-of-eight coil. The color bar indicates the normalized electric field from minimum (blue) to maximum (red).
25
Discussion
Using two awake and unanesthetized macaque monkeys as subjects, we conducted a study to evaluate the effect of rTMS at different frequencies and intensities parametrically on the neural activity of the MI. Resting-state ECoG signals in the stimulation site as well as MEPs in the contralateral hand were recorded before and after the rTMS application. The amplitude of MEPs decreased and increased after the application of the 1-Hz and 10-Hz rTMS, respectively, in both monkeys. This result was consistent with a part of previous human studies evaluating the changes in MEP amplitude following rTMS application (Chen et al., 1997; Maeda et al., 2000a, 2000b; Pascual-leone et al., 1994), indicating the inhibitory and facilitatory effects of low-frequency and high-frequency rTMS on cortical neural activity, respectively. We found no significant changes in MEP amplitude after the application of the 0.5-, 2- and 5-Hz rTMS. We also found no significant changes after intermittent 1-Hz rTMS and continuous 2-Hz rTMS. These results indicate that the inhibition of local neural activity is a very specific phenomenon induced by continuous 1 Hz stimulation.
In the resting-state ECoG signals of the stimulation site, the decrease in beta band power and the increase in high-gamma band power were induced after the 1-Hz and 10-Hz rTMS, respectively, in both monkeys. Such effects were limited to (the vicinity of) the stimulation site (Figure 11), and no change was found in the power of beta or high-gamma band in the ECoG signals from remote electrodes such as those in the DLPFC or PPC (Figure 10). This finding is inconsistent with the electromagnetic simulation that showed the electrical current induced by single-pulse TMS was broadly spread around the stimulation site. The results of this simulation was consistent with previous simulation study in human (Opitz et al., 2011; Thielscher & Kammer, 2004). Recently, Romero et al., (2019) reported that the single-pulse TMS induced a highly localized excitation of single neurons in monkeys and mentioned that there was a gap of the spatial selectivity of the TMS effect between the results of simulation and neurophysiological experiments. Further studies are needed to elucidate the inconsistencies between real measurements and the results of simulations concerning the spread of the effect of TMS.
In previous human studies, scalp EEG with surface electrodes has been used to evaluate the changes in resting-state neural activity after rTMS (Berger et al., 2013; Brignani et al., 2008; Cincotta et al., 2015; Kim et al., 2012; Piccione et al., 2011; Pripfl et al., 2014; Qiu et al., 2019; Woźniak-Kwaśniewska et al., 2014). Many of those studies showed some changes in specific frequency bands, but the effect was generally weak and inconsistent across studies. In contrast, we took advantage of the possibilities provided by more invasive animal research. Specifically, we used a higher rTMS intensity (150% of rMT, compared
26
to 90% to 120% of rMT generally used in humans) and higher signal-to-noise ratios enabled by subdurally implanted electrodes. The combination of these two factors may explain why we observed robust changes in neural activity following the 1-Hz and 10-Hz rTMS in two subjects. As shown in Figure 8, the intensity of 150% of rMT in both of 1-Hz and 10-Hz significantly affected in ECoG band power and MEP amplitude consistently in two monkeys, and we found no consistent changes in the lower intensity of rTMS. The tendency that the higher intensity of rTMS induced the larger changes in MEP amplitude appear to be characterized in several studies (Chen et al., 1997; Fitzgerald et al., 2002, 2005, 2006; Gerschlager et al., 2001; Stinear & Byblow, 2004). However, since the higher intensity of rTMS can cause epileptic seizures, there is a trade-off between the strong effects of rTMS and the risk of causing epilepcy. Recently, continuous and intermittent theta burst stimulation (cTBS/iTBS), specific patterned rTMS protocols, have got known to produce a very powerful effect with lower stimulation intensity (usually 80% of the rMT) (Huang et al., 2005; Klomjai et al., 2015; Simonetta-Moreau, 2014). These methods may solve the problem of the trade-off in conventional rTMS.
To the best of our knowledge, this is the first electrophysiological recording study using awake and unanesthetized subjects demonstrating the differential changes in the resting-state neural activity following low- and frequency rTMS. Papazachariadis et al., (2014) reported the increase in high-gamma band power in ECoG after intermittent theta-burst rTMS using anesthetized monkeys. Benali et al., (2011) also reported the increase in gamma band power in LFP after iTBS using anesthetized rodents. However, it has been known that the resting-state neural activity can be greatly altered by the application of anesthesia (Alkire et al., 2008). To study the resting-state neural activity, it is desirable to conduct experiments in the unanesthetized state. We consider that the key to the success of this study was the development of an rTMS-compatible non-invasive head fixation device combined with behavioral training until monkeys remained relaxed during rTMS application.
This study may be one important step forward understanding the mechanisms by which rTMS works. By the simultaneous recordings of ECoG and single unit activity, it was suggested that beta and high-gamma signals in the ECoG reflect the synchronous firing and firing frequency, respectively, of cell assembly in local neural circuits (Buzsáki et al., 2012; Kramer et al., 2008; Rasch et al., 2008; Ray & Maunsell, 2011; Roopun et al., 2006; Yamawaki et al., 2008). Therefore, the results of this study suggest that the low-frequency rTMS inhibits neural excitability by desynchronizing the firing activity of the local circuits, whereas the high-frequency rTMS facilitates the neural excitability by increasing the firing rate in the local circuits. In vitro studies using rodents have provided important results that clarify the mechanisms
27
by which rTMS modulates neural excitability at the local circuit level. The expression of the calcium-binding proteins parvalbumin (PV) and calbindin (CB) has been reported to be changed differently by low-frequency rTMS or cTBS/iTBS, which may reflect the changes in the activity of PV- or CB-containing interneurons (Benali et al., 2011; Funke & Benali, 2011). Further investigation is required to clarify why different rTMS protocols induce changes in the different parts of the local neural circuits, and how such changes lead to the increase or decrease in specific frequency bands in ECoG signals or the inhibition or facilitation of the overall local neural activity.
For clinical applications, the results of this study suggest that the resting-state scalp EEG could be a reliable measure of the effectiveness of rTMS. To date, the most reliable measure of the effectiveness of rTMS on the neural activity of the stimulation site has been the MEP (Fitzgerald et al., 2006). However, the MEP can only be used in the motor-related cortices, typically in the MI. Alternatively, somatosensory evoked potentials (SEPs), or event-related potentials (ERPs) such as P300 have been used as measures of the effectiveness of rTMS (Enomoto et al., 2001; Jing, Takigawa, Hamada, et al., 2001; Jing, Takigawa, Okamura, et al., 2001; Restuccia et al., 2007). If the rTMS-induced changes in the intensities of ECoG signals shown in this study commonly occur in different parts of the cerebral cortex, it can be used as a general measure of the effectiveness of rTMS on local neural activity in different parts of the cerebral cortex. Considering the recent technological advancement of scalp EEG measurement (Mitra et al., 2015; Tikka et al., 2015), both in the fields of recording devices and computational data processing, the measurement and evaluation of beta and high-gamma band power of scalp EEG data in clinical practice may become possible.
28
Conclusions
The effects of 1-Hz and 10-Hz rTMS on the resting-state ECoG signals in the stimulated MI and the MEPs in the muscle in the contralateral hand were evaluated in awake, unanesthetized monkeys. Following the 1-Hz rTMS application, significant decreases in ECoG beta band power and MEP amplitude were observed. Following the 10-Hz rTMS application, significant increases in ECoG high-gamma power and MEP amplitude were observed. The intensity of 150% of the rMT induced significant changes in ECoG band power and MEP amplitude, whereas the effects were not clear-cut with lower intensities. Combined with previous studies showing that beta and high-gamma activities reflect the synchronous firing and firing frequency, respectively, of cell assembly in the local neural circuits, these results suggest that low-frequency rTMS inhibits neural excitability by desynchronizing local circuit activity, whereas high-frequency rTMS facilitates neural excitability by increasing the firing of neurons in the local circuits.
29
Acknowledgements
I would like to express my heartfelt gratitude to Prof. Ken-Ichiro Tsutsui, Dr Shinya Nakamura, and Prof Philippe Tobler for their constructive guidance and advice throughout the project.
30
References
Alkire, M. T., Hudetz, A. G., & Tononi, G. (2008). Consciousness and anesthesia. In Science
(Vol. 322, Issue 5903, pp. 876–880). NIH Public Access.
https://doi.org/10.1126/science.1149213
Benali, A., Trippe, J., Weiler, E., Mix, A., Petrasch-Parwez, E., Girzalsky, W., Eysel, U. T.,
Erdmann, R., & Funke, K. (2011). Theta-burst transcranial magnetic stimulation alters
cortical inhibition. Journal of Neuroscience, 31(4), 1193–1203.
https://doi.org/10.1523/JNEUROSCI.1379-10.2011
Berger, C., Domning, T., Thome, J., & Höppner, J. (2013). P 27. rTMS and eeg-investigations
in healthy subjects. Clinical Neurophysiology, 124(10), e76–e77.
https://doi.org/10.1016/j.clinph.2013.04.105
Brignani, D., Manganotti, P., Rossini, P. M., & Miniussi, C. (2008). Modulation of cortical
oscillatory activity during transcranial magnetic stimulation. Human Brain Mapping,
29(5), 603–612. https://doi.org/10.1002/hbm.20423
Buzsáki, G., Anastassiou, C. A., & Koch, C. (2012). The origin of extracellular fields and
currents-EEG, ECoG, LFP and spikes. In Nature Reviews Neuroscience (Vol. 13, Issue 6,
pp. 407–420). Nature Publishing Group. https://doi.org/10.1038/nrn3241
Buzsáki, G., & Draguhn, A. (2004). Neuronal olscillations in cortical networks. In Science (Vol.
304, Issue 5679, pp. 1926–1929). American Association for the Advancement of Science.
https://doi.org/10.1126/science.1099745
Chen, R., Classen, J., Gerloff, C., Celnik, P., Wassermann, E. M., Hallett, M., & Cohen, L. G.
(1997). Depression of motor cortex excitability by low-frequency transcranial magnetic
stimulation. Neurology, 48(5), 1398–1403. https://doi.org/10.1212/WNL.48.5.1398
Cincotta, M., Giovannelli, F., Chiaramonti, R., Bianco, G., Godone, M., Battista, D., Cardinali,
C., Borgheresi, A., Sighinolfi, A., D’Avanzo, A. M., Breschi, M., Dine, Y., Lino, M.,
Zaccara, G., Viggiano, M. P., & Rossi, S. (2015). No effects of 20 Hz-rTMS of the
primary motor cortex in vegetative state: A randomised, sham-controlled study. Cortex,
71, 368–376. https://doi.org/10.1016/j.cortex.2015.07.027
Enomoto, H., Ugawa, Y., Hanajima, R., Yuasa, K., Mochizuki, H., Terao, Y., Shiio, Y.,
Furubayashi, T., Iwata, N. K., & Kanazawa, I. (2001). Decreased sensory cortical
31
excitability after 1 Hz rTMS over the ipsilateral primary motor cortex. Clinical
Neurophysiology, 112(11), 2154–2158. https://doi.org/10.1016/S1388-2457(01)00667-8
Fitzgerald, P. B., Benitez, J., Oxley, T., Daskalakis, J. Z., De Castella, A. R., & Kulkarni, J.
(2005). A study of the effects of lorazepam and dextromethorphan on the response to
cortical 1 Hz repetitive transcranial magnetic stimulation. NeuroReport, 16(13), 1525–
1528. https://doi.org/10.1097/01.wnr.0000177005.14108.f1
Fitzgerald, P. B., Brown, T. L., Daskalakis, Z. J., Chen, R., & Kulkarni, J. (2002).
Intensity-dependent effects of 1 Hz rTMS on human corticospinal excitability. Clinical
Neurophysiology, 113(7), 1136–1141. https://doi.org/10.1016/S1388-2457(02)00145-1
Fitzgerald, P. B., Fountain, S., & Daskalakis, Z. J. (2006). A comprehensive review of the
effects of rTMS on motor cortical excitability and inhibition. In Clinical Neurophysiology
(Vol. 117, Issue 12, pp. 2584–2596). Clin Neurophysiol.
https://doi.org/10.1016/j.clinph.2006.06.712
Funke, K., & Benali, A. (2011). Modulation of cortical inhibition by rTMS - findings obtained
from animal models. In Journal of Physiology (Vol. 589, Issue 18, pp. 4423–4435). J
Physiol. https://doi.org/10.1113/jphysiol.2011.206573
Gerschlager, W., Siebner, H. R., & Rothwell, J. C. (2001). Decreased corticospinal excitability
after subthreshold 1 Hz rTMS over lateral premotor cortex. Neurology, 57(3), 449–455.
https://doi.org/10.1212/WNL.57.3.449
Gilio, F., Rizzo, V., Siebner, H. R., & Rothwell, J. C. (2003). Effects on the right motor
hand-area excitability produced by low-frequency rTMS over human contralateral homologous
cortex. Journal of Physiology, 551(2), 563–573.
https://doi.org/10.1113/jphysiol.2003.044313
Huang, Y. Z., Edwards, M. J., Rounis, E., Bhatia, K. P., & Rothwell, J. C. (2005). Theta burst
stimulation of the human motor cortex. Neuron, 45(2), 201–206.
https://doi.org/10.1016/j.neuron.2004.12.033
Jennum, P., Winkel, H., & Fuglsang-Frederiksen, A. (1995). Repetitive magnetic stimulation
and motor evoked potentials. Electroencephalography and Clinical Neurophysiology/
Electromyography, 97(2), 96–101. https://doi.org/10.1016/0924-980X(94)00293-G
Jing, H., Takigawa, M., Hamada, K., Okamura, H., Kawaika, Y., Yonezawa, T., & Fukuzako,
32
event-related potentials. Clinical Neurophysiology, 112(2), 304–313.
https://doi.org/10.1016/S1388-2457(00)00540-X
Jing, H., Takigawa, M., Okamura, H., Doi, W., & Fukuzako, H. (2001). Comparisons of
event-related potentials after repetitive transcranial magnetic stimulation. Journal of Neurology,
248(3), 184–192. https://doi.org/10.1007/s004150170224
Kim, W. S., Lee, M., Han, J. M., Kim, S. E., Kim, H.-J., Kim, B. S., Kim, B. G., & Lee, H. W.
(2012). Acute and chronic effects of repeated 1 Hz rTMS on the temporal cortex.
NeuroReport, 23(9), 540–545. https://doi.org/10.1097/WNR.0b013e328354036f
Klomjai, W., Katz, R., & Lackmy-Vallée, A. (2015). Basic principles of transcranial magnetic
stimulation (TMS) and repetitive TMS (rTMS). In Annals of Physical and Rehabilitation
Medicine (Vol. 58, Issue 4, pp. 208–213). Elsevier Masson SAS.
https://doi.org/10.1016/j.rehab.2015.05.005
Kramer, M. A., Roopun, A. K., Carracedo, L. M., Traub, R. D., Whittington, M. A., & Kopell,
N. J. (2008). Rhythm Generation through Period Concatenation in Rat Somatosensory
Cortex. PLoS Computational Biology, 4(9), e1000169.
https://doi.org/10.1371/journal.pcbi.1000169
Laakso, I., Murakami, T., Hirata, A., & Ugawa, Y. (2018). Where and what TMS activates:
Experiments and modeling. Brain Stimulation, 11(1), 166–174.
https://doi.org/10.1016/j.brs.2017.09.011
Maeda, F., Keenan, J. P., Tormos, J. M., Topka, H., & Pascual-Leone, A. (2000a).
Interindividual variability of the modulatory effects of repetitive transcranial magnetic
stimulation on cortical excitability. Experimental Brain Research, 133(4), 425–430.
https://doi.org/10.1007/s002210000432
Maeda, F., Keenan, J. P., Tormos, J. M., Topka, H., & Pascual-Leone, A. (2000b). Modulation
of corticospinal excitability by repetitive transcranial magnetic stimulation. Clinical
Neurophysiology, 111(5), 800–805. https://doi.org/10.1016/S1388-2457(99)00323-5
Mitra, S., Nizamie, S. H., Goyal, N., & Tikka, S. K. (2015). Evaluation of resting state gamma
power as a response marker in schizophrenia. Psychiatry and Clinical Neurosciences,
69(10), 630–639. https://doi.org/10.1111/pcn.12301
Opitz, A., Windhoff, M., Heidemann, R. M., Turner, R., & Thielscher, A. (2011). How the brain
tissue shapes the electric field induced by transcranial magnetic stimulation. NeuroImage,
33
58(3), 849–859. https://doi.org/10.1016/j.neuroimage.2011.06.069
Papazachariadis, O., Dante, V., Verschure, P. F. M. J., Del Giudice, P., & Ferraina, S. (2014).
iTBS-Induced LTP-Like Plasticity Parallels Oscillatory Activity Changes in the Primary
Sensory and Motor Areas of Macaque Monkeys. PLoS ONE, 9(11), e112504.
https://doi.org/10.1371/journal.pone.0112504
Pascual-leone, A., Valls-solé, J., Wassermann, E. M., & Hallett, M. (1994). Responses to
rapid-rate transcranial magnetic stimulation of the human motor cortex. Brain, 117(4), 847–858.
https://doi.org/10.1093/brain/117.4.847
Pell, G. S., Roth, Y., & Zangen, A. (2011). Modulation of cortical excitability induced by
repetitive transcranial magnetic stimulation: Influence of timing and geometrical
parameters and underlying mechanisms. In Progress in Neurobiology (Vol. 93, Issue 1, pp.
59–98). Prog Neurobiol. https://doi.org/10.1016/j.pneurobio.2010.10.003
Piccione, F., Cavinato, M., Manganotti, P., Formaggio, E., Storti, S. F., Battistin, L., Cagnin, A.,
Tonin, P., & Dam, M. (2011). Behavioral and neurophysiological effects of repetitive
transcranial magnetic stimulation on the minimally conscious state: A case study.
Neurorehabilitation and Neural Repair, 25(1), 98–102.
https://doi.org/10.1177/1545968310369802
Pripfl, J., Tomova, L., Riecansky, I., & Lamm, C. (2014). Transcranial magnetic stimulation of
the left dorsolateral prefrontal cortex decreases cue-induced nicotine craving and EEG
delta power. Brain Stimulation, 7(2), 226–233. https://doi.org/10.1016/j.brs.2013.11.003
Qiu, S., Wang, S., Yi, W., Zhang, C., & He, H. (2019). The lasting effects of 1Hz repetitive
transcranial magnetic stimulation on resting state EEG in healthy subjects. Proceedings of
the Annual International Conference of the IEEE Engineering in Medicine and Biology
Society, EMBS, 5918–5922. https://doi.org/10.1109/EMBC.2019.8857184
Rasch, M. J., Gretton, A., Murayama, Y., Maass, W., & Logothetis, N. K. (2008). Inferring
spike trains from local field potentials. Journal of Neurophysiology, 99(3), 1461–1476.
https://doi.org/10.1152/jn.00919.2007
Ray, S., & Maunsell, J. H. R. (2011). Different Origins of Gamma Rhythm and High-Gamma
Activity in Macaque Visual Cortex. PLoS Biology, 9(4), e1000610.
https://doi.org/10.1371/journal.pbio.1000610
high-34
frequency (600 Hz) somatosensory-evoked potentials after rTMS of the primary sensory
cortex. European Journal of Neuroscience, 26(8), 2349–2358.
https://doi.org/10.1111/j.1460-9568.2007.05828.x
Romeo, S., Gilio, F., Pedace, F., Ozkaynak, S., Inghilleri, M., Manfredi, M., & Berardelli, A.
(2000). Changes in the cortical silent period after repetitive magnetic stimulation of
cortical motor areas. Experimental Brain Research, 135(4), 504–510.
https://doi.org/10.1007/s002210000541
Romero, M. C., Davare, M., Armendariz, M., & Janssen, P. (2019). Neural effects of
transcranial magnetic stimulation at the single-cell level. Nature Communications, 10(1).
https://doi.org/10.1038/s41467-019-10638-7
Roopun, A. K., Middleton, S. J., Cunningham, M. O., LeBeau, F. E. H., Bibbig, A.,
Whittington, M. A., & Traub, R. D. (2006). A beta2-frequency (20-30 Hz) oscillation in
nonsynaptic networks of somatosensory cortex. Proceedings of the National Academy of
Sciences of the United States of America, 103(42), 15646–15650.
https://doi.org/10.1073/pnas.0607443103
Simonetta-Moreau, M. (2014). Neuromodulation corticale non invasive (NIBS) et récupération
motrice post-AVC. In Annals of Physical and Rehabilitation Medicine (Vol. 57, Issue 8,
pp. 530–542). Elsevier Masson SAS. https://doi.org/10.1016/j.rehab.2014.08.003
Stinear, C. M., & Byblow, W. D. (2004). Impaired modulation of corticospinal excitability
following subthreshold rTMS in focal hand dystonia. Human Movement Science, 23(3-4
SPE. ISS.), 527–538. https://doi.org/10.1016/j.humov.2004.08.022
Thielscher, A., Antunes, A., & Saturnino, G. B. (2015). Field modeling for transcranial
magnetic stimulation: A useful tool to understand the physiological effects of TMS?
Proceedings of the Annual International Conference of the IEEE Engineering in Medicine
and Biology Society, EMBS, 2015-November, 222–225.
https://doi.org/10.1109/EMBC.2015.7318340
Thielscher, A., & Kammer, T. (2004). Electric field properties of two commercial figure-8 coils
in TMS: Calculation of focality and efficiency. Clinical Neurophysiology, 115(7), 1697–
1708. https://doi.org/10.1016/j.clinph.2004.02.019
Thut, G., & Pascual-Leone, A. (2010). A review of combined TMS-EEG studies to characterize
lasting effects of repetitive TMS and assess their usefulness in cognitive and clinical
35