Preliminary Results of Doppler Temperature
Observation of the Oxygen Green and Red Lines
in Aurora
著者
Kamiyama Hiroshi, Okano Shoichi
雑誌名
Science reports of the Tohoku University. Ser.
5, Geophysics
巻
24
号
4
ページ
133-160
発行年
1977-12
URL
http://hdl.handle.net/10097/44747
Sci. Rep. Thhoku Univ., Ser. 5, Geophysics, Vol. 24, No. 4, pp. 133-160, 1977.
Preliminary Results of Doppler Temperature Observation
of the Oxygen Green and Red Lines in Aurora
HIROSHI KAMIYAMA and SHOICHI OKANO
Upper Atmosphere and Space Research Laboratory
Thhoku University,
Sendai 980, Japan
(Received October 31, 1977)
Abstract:
With a specially designed Fabry-Perot
interferometer,
a ground-based
observation
of the Doppler broadening of the oxygen green and red lines in aurora
was carried out at Poker Flat Research Range near Fairbanks,
Alaska in January
1977.
The intensity
of the emission line concerned was monitored
simultaneously
by a photoelectric
photometer,
and thereby the output of the
interferometer
was
normalized automatically
by the signal processor for a constant input intensity.
The
Doppler temperature
can be inferred from a normalized fringe pattern
by finding the
best fit theoretical
curve based on the instrumental
response function.
This paper
presents preliminary results of the observation.
Observed temperatures
in auroras are
ranging in general from bout 300°K to 500°K for the green line and from about 500°K
to 800°K for the red line.
The change in the temperature
is more likely dependent on
an altitude with which a measurement concerns rather than on the brightness of aurora.
1. Introduction
Auroral temperatures have so far been inferred mainly from measurements of the
rotational structure of the NZ First Negative bands or the OH Meinal bands.
In
recent years, some attempts have also been made to measure the Doppler widths of the
atomic oxygen lines by employing interferometers.
Although these methods have
been successful for stable airglows at middle latitudes (Bens, et al., 1965; Hays, et al.,
1969; Hernandez, 1976), a serious difficulty arises mainly from rapid changes in
brightness in the case of aurora.
To minimize this difficulty, our Fabry-Perot
interferometer employs a monitoring photometric system and a signal processor by
which the interferometric output is normalized for a constant input intensity.
In order
to obtain a kinetic temperature at a given condition of an aurora, it is also desirable to
complete a scanning of the interferometer as fast as possible. For this purpose, an
annular slits system is employed successfully without reducing the aperture finess
appreciably (Kamiyama, et al., 1975a).
With the Fabry-Perot interferometer thus specially designed, line profiles of the
OI A5577A and A8300A lines were measured in January 1977 at Poker Flat Research
Range, University of Alaska, locating at about 30 miles north of Fairbanks, Alaska.
Experimental descriptions and the preliminary results of the observation are reported
in this paper.
134 H. KAMIYAMA and S. OKANO
2. Instrumentation
A block diagram of the instrumentation is shown in Figure 1.
All of the
instruments were arranged in the optical laboratory on the hill in the Research Range.
The interferometer was placed horizontally at a suitable position beneath the optical
dome made of a high quality plastic semi-sphere having a 2-meter diameter.
Auroral
lights are led to the interferometer through a reflection on a plane mirror by which a
sighting is adjustable to any direction in a range to 50° from the zenith.
INT' FILTER 1APERTURE _.---GATE 1 SIGNAL CONTROL I pRocEs
Figure 1. Block diagram of the instrumentation.
The interferometer has an effective 60 mm aperture etalon and a 19.9 mm spacer
giving a nominal free spectral range of 0.09A at A6000A. An interference filter having
a bandwidth of 20A is used as a premonochromator.
The photomultiplier,
ITT-FW-130 tube, with a 9 mm photo-cathode, is cooled by a freon refrigerator system.
The
specially designed annular slits system is mounted just behind the filter, so that the
interference can be detected through a pin-hole slits at the focal distance of the
output lense. The position of the annular slits is adjusted in a way in which the
transparent portions of the illuminated annular slits coincide completely with their
images reflected from the etalon surface.
By use of this annular slits system, a
detectable photon flux is gained largely and a scanning can be made so quickly that one
free spectral range is observed in a minute for a moderately bright aurora.
Through a reflection on a small mirror installed behind the collimating lense, a
small portion of the filtered light flux is led to the photometer and the intensity of the
emission line concerned is monitored.
This photometer is of an usual photoelectric
counting type employing EMI-9558B with a freon cooling system.
The output is
referred to in the signal processor to compensate a defective output from the
interferometer.
In the signal processor, a numerical calculation is carried out in real
time for each of the interferometric output counts, S1, following the formula,
A = C(Si—N,V(S2—N2)
Here, S2 is a photometric output count in a corresponding gate time, N1 and N2 are the
noise levels contained in S1 and S2, respectively, and C is an arbitrary constant giving
the same order of magnitude for A as those of S1 and S2. The values for N1, N2, and C
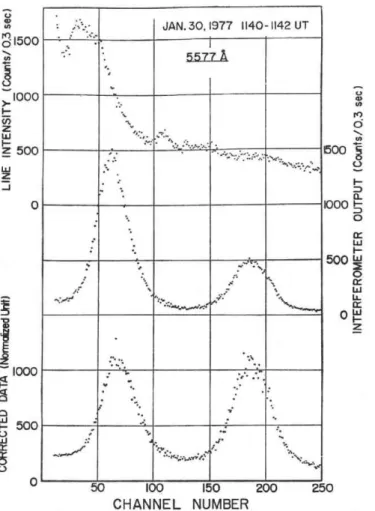
DOPPLER TEMPERATURE IN AURORA 135 7.) . 0 ul .% JAN.30, 1977 1140-1142 UT ro.
01500
-..-I
-. .•• ..-.•u)'5577
..{
A
I000
-.
H
C7)•.„,.
Z
.,
In (.5
W..•
• . ..
.
\
i--cr,
z 500
1500
i
LL.1 .,' , (..) ...- ..5 - i- n 0_ o 1000 _,1— : ... 5 . cc w 1— .. - 500 Lo .. m . i ..::o --..--.., ix ..: S. :- • bi '...."....,..., 4: CC0IfY_ V
Z
1
--. 1000 ... .%.
• • . :. • ,.. 1— .. - % .':- .,..•., ca. i..T. 4 -1i . F-500-..: . V...„ ct6
...--,
.,,0
...,,,1
0
50
100
150
200
250
CHANNEL NUMBER
Figure 2. An exmaple showing an intensity variation (upper), defected fringes (middle), and
normalized data for a constant input intensity (bottom).
can be choosed freely in accord with an observational condition.
Figure 2 shows an
example of the primary data, S, (middle), S2 (upper), and the normalized data, A
(lower), for a very rapidly changing aurora. As seen from the S2 trend, a very rapid
depression of the auroral brightness introduced a serious defection in the fringes
obtained directly from the interferometer, but the data are corrected properly for the
intensity variation.
In this case, the gate time is settled as 0.3 sec so that one free
spectral range is scanned in about one minute.
Another important function of the signal processor is the control of the operation of
the counters and the multi-channel analyser. After a speed of pressure scanning of
the interferometer is adjusted with a leak valve, a measurement starts and ends
automatically at the pressures settled to cover two or three cycles of the free spectral
range. The gate time of the counters is also controlled by the processor and the signals,
S, and S2, and the normalized result, A, in each gate time are stored in the assigned
channels of the analyzer in accord with an output voltage from the pressure transducer.
I
I JAN.30,1977
1140-1142
UT
55111
" ' •:I
f
' 1 I II
II
47.
...• • • 1 , • • • •. ••• • I • • I r. % 1 1 1, S. I I I I •- I ". 1 .4. ...136 H. KAMIYAMA and S. OKANO
For our convenience, the first 10 channels are assigned to memorize automatically the
fundamental data such as date, starting time, and the instrumental parameters adopted.
The interferometric outputs, S1, the photometric outputs, S2, and the noramlized data
are assigned to the channels from No. 11 to No. 250, from No. 251 to No. 490, and
from No. 491 to 730, respectively. The channels from No. 731 to No. 970 memorize
the dead times between the successive gates. By watching the displaying cathode-ray
tube on the analyzer, an instrumental stability is monitored and an aptitude of the
slection of the instrumental parameters can be checked.
The data stored in the multi-channel analyzer are punched on a paper tape which
is subjected afterward to a computer analysis to deduce a Doppler temperature.
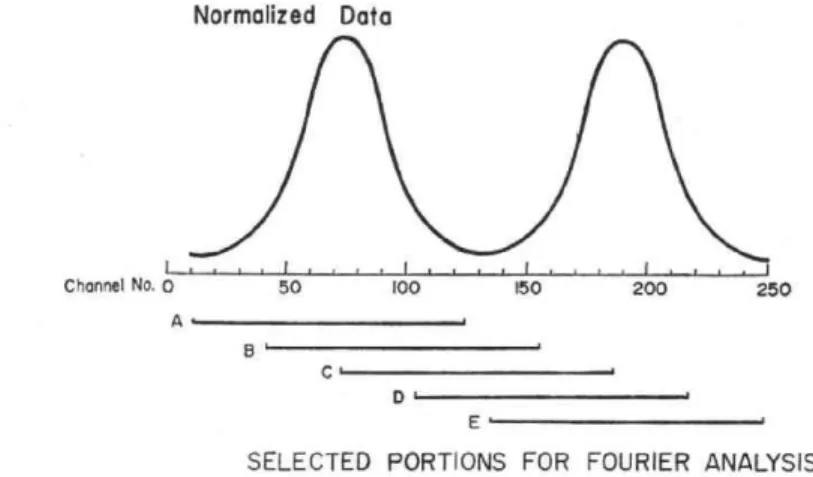
3. Data Reduction
For this auroral observation, the pressure scanning speed and the gate time for
photon counting are settled so as to cover two cycles of interferometer fringes with 240
data points. The Doppler temperature can be determined from any set of successive
points covering a complete one cycle. The method is basically following the technique
developed by Hays and Robbie (1971).
First, from the statistical analysis of the normalized data, the number of data
points completing one cycle of the fringe is determined.
Owing to the favorable
conditions in the laboratory, the pressure scanning of the interferometer ran quite
steadily throughout the whole period of observations, and it is found that one cycle
of the fringe is covered by 114 successive data points for the green line and by 106
points for the red line. Then, any portion of the normalized data covering a
complete cycle of the fringe can be subjected to a Fourier analysis. In our case, five
displaced portions of a set of data are employed to derive Doppler temperatures.
Although the calculated results are not fully independent of each other except between
the first and the fifth ones, they are useful in checking the analysis and, in some
cases, inquiring into a temporal change. The first five sets of the coefficients derived
from a Fourier analysis are employed to obtain a smooth curve which idealizes the
observed fringe.
For recovering of the original source profile, it is necessary to know the instrumental
broadening function relating to the bandpass characteristics.
For this purpose, an
instrumental calibration is made before and after observations on each night, with a
reference to the linearly polarized light source at A6329.91Ã created from a He-Ne
gas laser. A fringe profile obtained as a reference in a calibration is considered to be the
convolution of the well-known source profile and the instrumental response function.
From comparisons of the reference profile with models convoluted by assuming
various combinations of the instrumental
parameters such as a reflectivity of the
etalon, a microscopic defect, a spherical defect, and an aperture defect, a set of
parameters leading to the best fit of the calibration experiment is employed in the
reduction of a Doppler temperature.
Then, based upon the instrumental parameters
DOPPLER
TEMPERATURE
IN AURORA
137
interval
of 1°K.
From comparisons
of these profiles
with the idealized
fringe
retrieved
with the first five Fourier
coefficients
derived
from the data
analysis,
the best fit
tem-perature,
T0, can be obtained
in a least squares
manner
by minimizing
the quantity,
X,
given
by
ft
X — E (Ri—C1)2
i=
where Ri is the value on the retrieved curve and Ci is theoretical value calculated with
an assumed temperature.
Check points i are settled at same phase angles as those of
the original data.
An experimental error is estimated as follows. First, the sum, Y, of the squares
of deviations of data, Ai, from the most probable theoretical profile is calculated by
Y = f (A 1-1 31)2
,
i=i
where Ai is normalized values as already mentioned and r), is the values of the most
probable theoretical profile at the temperature, T0. Next, calculations are carried out
for
E (C1--Pi)2 .
i=1
Here, Ci is again the theoretical
values calculated
at different temperatures,
To+ AT.
With changing AT at a step of 1°K, an equivalent error, 4T, is estimated
by minimizing
117-Z1.
4. Results
During the scheduled period in Alaska, interferometric measurements were made
for the oxygen green line on three nights and for the red line on three other nights.
As mentioned earlier, each measurement requires some time to obtain 240 data points.
Therefore, a derived Doppler temperature is considered to be an average over a period
in which data points covering a complete one cycle are obtained.
For this reason,
each of the measurements is analyzed for five different portions of data by sliding the
head of a data train by 31 or 32 channels as shown in Figure 3, and periods with which
the analysis concerns are given in UT in the Tables.
To minimize the error resulting
from the uncertainty of the number of data covering a complete cycle, averaged values
are also given. An observing direction is settled northerly at indicated angles from
the zenith in the geomagnetical meridian plane.
Table 1 tabulates the results derived from the green line data obtained on January
17 (UT). Before 9h UT on this night, no aurora was seen from Poker Flat and afterward
the sky became cloudy.
Therefore, most of the results obtained on this night are
pertaining to the airglow at a high latitude except for the result at about 11h UT when
an auroral activity was recognized in spite of a very cloudy condition.
138 H. KAMIYAMA and S. OKANO
Table 2 gives the results derived also from the green line on January 18 (UT). A
typical diffuse aurora caused presumably by the precipitation of protons was seen
during most of the night. A comparison is made in Figure 4 of these results with those
obtained in the preceding night before midnight (10hUT) when there was no aurora.
It is interesting to note that Doppler temperatures of the OI green line in this diffuse
aurora are considerably higher than those in a quiet airglow. Around 6h UT on January
18, green line temperatures exceeded 500°K.
These high temperatures are considered
to be greatly due to a change in the altitude with which the observation concerns.
Normalized Data
Channel No. 0 50 100 I50 200 250
A' B' •
C,
D'
E •
SELECTED PORTIONS FOR FOURIER ANALYSIS
Figure 3. Five portions of the data train employed for the reduction of Doppler temperatures.
Each of the portions
covers a complete one cycle of a fringe consists of 114 data points
for the green line and of 106 points for the red line.
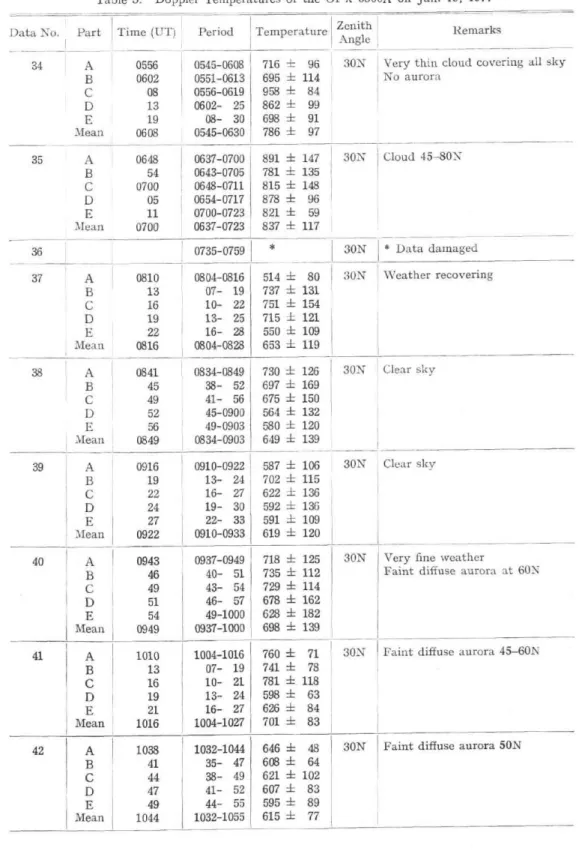
Table 1. Doppler Temperatures
of the 01 A.
5577A on Jan. 17, 1977
Data No. Part
Time (UT)
Period1 A B D E Mean 0357 0404 12 19 26 0412
I 0343-0412
0350-0419 0357-0426 0404- 33 12- 40I 0343-0440
Temperature Zenith Angle Remarks 28 70 34 25 26 37 251 ± 331 ± 169 ± 168 ± 179 ± 220 ± 0No aurora (Airglow)
2 A B C D E Mean 0517 24 30 37 44 0530 0504-0530 11- 37 17- 44 24- 50 30- 57 0504-0557 180 ± 15 163± 6 150 ± 37 220 ± 8 209 ± 10 184 ± 15 30NNo aurora (Airglow)
3 A B C D E Mean 0620 27 33 40 46 0633 0607-0633 14- 40 20- 46 ' 27 - 53 33- 59 0607-0659 20 35 36 40 35 33 240 ± 248 ± 189 ± 218 ± 219 ± 223 ± 30N No aurora139
DOPPLER TEMPERATURE IN AURORA
Table 1. cont'd Remarks Zenith Angle Temperature Period
Time (UT)
Part D ata No. No aurora 30N 207 198 157 245 241 210 ± 96 ± 91 ± 113 ± 103 ± 105 ± 102 0706-0711 07- 12 08- 13 10- 15 11- 16 0706-0716 0708 10 11 12 13 0711 A B C D E Mean 4 No aurora 30N 18 43 45 62 72 48 255 ± 288 ± 261 ± 258 ± 256 ± 264 ± No aurora 30N 64 46 45 55 65 55 260 ± 231 ± 210 ± 262 ± 254 ± 243 ± 0720-0725 21- 26 22- 27 24- 29 25- 30 0720-0730 0735-0740 36- 41 37- 42 39- 44 40- 45 0735-0745 0722 24 25 26 27 0725 A B C D E Mean 5 0737 39 40 41 42 0740 A B C D E Mean 6 No aurora 30N 37 62 30 55 61 49 212 1 228 ± 205 ± 270 ± 285 ± 240 ± 0800-0805 01- 06 02- 07 04- 09 05- 10 0800-0810 0802 04 05 06 07 0805 A B C D E Mean 7 Cloudy 30N 59 32 50 31 26 40 350 ± 357 ± 235 ± 245 ± 238 ± 285 ± 0829-0834 30- 35 32- 37 33- 38 34- 39 0829-0839 0832 33 34 35 37 0834 A B C D E Mean 8 Cloudy 30N 306 ± 96 303 ± 70 318 ± 56 296 ± 76 270 ± 37 299 ± 67 0842-0847 43- 48 44- 49 46- 51 47- 52 0842-0852 0844 46 47 48 49 0847 A B C D E Mean 9 Cloudy 30N 338 ± 31 340 + 21 322 ± 14 360 29 358 ± 30 344 ± 25 0900-0926 07- 33 13- 40 20- 46 26- 53 0900-0953 Very cloudy Active aurora 45°Nabove the cloud at 30N 377 375 306 374 394 365 ± 27 ± 28 ± 21 ± 13 ± 13 ± 20 0913 20 26 33 40 0926 1103-1108 04- 09 05- 10 07- 12 08- 13 1103-1113 A B C D E Mean 10 1105 07 08 09 10 1108 A B C D E Mean 11
140
Table 2.
H. KAMIYAMA and S. OK ANO
Doppler Temperatures of the OI A. 5577A on Jan. 18, 1977
Data No. Part
Time (UT)
Period Temperature12 A B C D E Mean 0355 0402 09 17 24 0409 0341-0409 0348-0417 0355-0424 0402- 31 09- 38 0341-0438 344 ± 18 432 ± 25 372 ± 44 300 ± 123 362 ± 53 Zenith Angle i I Remarks 13 A B C D E Mean 0500 06 12 18 24 0512 0448-0512 0454-0518 0500- 24 06- 30 12- 36 0448-0536 14 A B C D E Mean 0551 52 53 55 56 0553 0548-0553 49- 55 51- 56 52- 57 53- 59 0548-0559 15 A B C D E Mean 0605 05 06 07 08 0606 0603-0606 04- 07 05- 08 05- 09 06- 10 0603-0610
30N Weak proton aurora
* Data unreliable * * * * * * 30N Moderate proton aurora at the zenith
30N 650 ± 111 650 ± 117 611 ± 106 371 ± 110 378 ± 109 532 ± 111 * Data unreliable 531 ± 567 ± 645 ± 584 + 589 ± 583 ± 12 21 28 27 26 23 Diffuse aurora 10-50N
SON Diffuse aurora 20-60N
16 A B C D E ' Mean 0615 15 16 17 18 0616 0613-0616 14- 17 15- 18 15- 19 16- 19 0613-0619 464 ± 495 ± 562 ± 496 ± 505 ± 504 ± 32 60 22 37 40 38 30N 17 A B C D E Mean 0625 25 26 27 28 0626 0623-0626 24- 27 25- 28 25- 28 26- 29 0623-0629 18 I A B C D E I Mean -0748 48 49 50 51 0749 0746-0749 47- 50 48- 51 48- 52 49- 53 0746-0753 19 A B C D E I Mean 0758 58 59 08 00 01 0759 0756-0759 0757-0800 0758-0801 0758-0801 0759-0802 0756-0802 Aurora 40-70N Cloudy 505 ± 500 ± 550 ± 500 ± 510 ± 513 ± 36 34 53 28 31 36 465 ± 450 ± 380 ± 352 ± 350 ± 399 ± 77 67 60 40 37 56
30N Aurora at N horizon cloud 0-60N
30N
~
I
Diffuse aurora 0-45N Patchy cloud 383 ± 383 + 266 ± 319 ± 315 ± 333 ± 17 20 63 37 30 33 30N Diffuse aurora 0-45N141
DOPPLER TEMPERATURE IN AURORA
Table 2. coned Remarks TemperatureZenithA ngle Period
Time (UT)
Part Data No.Faint diffuse aurora 10-45N 30N * Tape damaged 41 34 15 20 18 26 363 ± 366 ± 428 ± 406 ± 402 ± 393 ± 0806-0809 07- 10 08- 11 08- 11 09- 12 0806-0812 0808 08 09 10 11 0809 A B C D E Mean 20 * 21 Diffuse aurora 10-20N 30N 34 34 43 10 11 26 394 ± 399 ± 337 d 340 ± 352 ± 364 ± Diffuse aurora 10-30N 0828-0831 29- 32 30- 33 30- 33 31- 34 0828-0834 0830 30 31 32 33 0831 A B C D E Mean 22 30N 53 49 45 34 32 43 415 ± 423 ± 325 ± 332 ± 338 ± 367 ±
Faint diffuse aurora at 45N 30N 538 ± 42 536 ± 42 378 ± 110 390 ± 51 370 ± 56 442 ± 60 0838-0841 39- 42 40- 43 40- 43 41- 44 0838-0844 0840 40 41 42 43 0841 A B C D E Mean 23 0859-0902 0900-0903 01- 04 01- 04 02- 05 0859-0905 0901 01 02 03 04 0902 Slightly cloudy 30N 31 35 36 84 86 54 432 ± 446 ± 428 ± 359 ± 362 ± 405 ± 0944-0947 45- 48 46- 49 46- 49 47- 50 0944-0950 0946 46 47 48 49 0947 A B C D E Mean A B C D E Mean 24 25 Cloudy 30N 28 28 26 39 32 31 415 ± 394 ± 427 ± 415 ± 426 ± 415 ± 1030-1033 31- 34 32- 35 32- 35 33- 36 1030-1036 1032 32 33 34 35 1033 A B C D E Mean 26 Clear sky
Faint aurora at N horizon 30N 55 40 37 57 58 49 405 ± 398 ± 415 ± 401 ± 381 ± 400 ± 1103-1106 04- 07 05- 08 05- 08 06- 09 1103-1109 1 1105 05 06 07 08 1106 A B C D E Mean 27 Diffuse aurora 45-55N 30N 35 26 26 71 77 47 427 ± 443 ± 427 ± 477 ± 479 ± 451 ± 1129-1132 30- 33 31- 34 31- 34 32- 35 1129-1135 1131 31 32 33 34 1132 A B C D E Mean 28
142 H. KAMIYAMA
Table
and S. OKANO
2. cont'd
Data No.
Part
Time (UT)
A
1151
B
51
C
52
D
53
E
54
Mean
1152
Period 29 30 Temperature 1149-1152 50- 53 51- 54 51- 54 52- 55 1149-1155 370 390 391 332 331 363 386 374 417 434 415 405 ± 55 ± 63 ± 61 •65 ± 56 ± 60 Zenith Angle 30N Remarks 1Diffuse aurora at about 60N
A D Mean 1201 01 02 03 04 1202 ; 1159-1202 1200- 03 01- 04 1 01- 04 02- 05 1159-1205 , ± 54 ± 58 ± 36 ± 67 ± 60 ± 55 1 30N I I Same as before 31 A B C D E Mean 1212 12 13 14 15 1213 i ~i 1210-1213 11- 14 12- 15 12- 15 13- 16 12104216 32 404 418 551 524 517 483 •75 ± 83 ± 39 1 41 ± 42 ± 56 30N Same as before A B C D E Mean 1224 24 25 26 27 1225 12224225 23- 26 24- 27 24- 27 25- 28 1222-1228 443 450 447 423 409 434 33 A B C D E Mean 1234 34 35 36 37 1235 •38 ± 34 ± 29 ± 26 ± 29 ± 31 30N Same as before 1232-1235 33- 36 34- 37 34- 37 35- 38 1232-1238 397 431 454 403 407 418 ± 8 ± 26 ± 51 ± 33 ± 36 ± 31 30N Same as before
Doppler temperatures of the oxygen red line were measured on January 19, 20, and
29, the results are given in Tables 3, 4, and 5. A temperature averaged for five values
derived from a set of 240 data points is plotted in Figures 5, 6, and 7 as a function
of time. Figure 6 for January 20 also gives intensities of the red line. The red line
temperature ranges in general from 500°K to 800°K and does not seem to be related
to the intensity.
This suggests that the temperature change is more likely to be
related to an altitude with which a measurement concerns.
On Janaury 30, the wavelength was again tuned at A5577A. The results are
given in Table 6 and Figure 8. The line intensities are also plotted in this figure.
In Figure 9, Doppler temperatures are given as a function of the line intensity.
As
seen in Figures 8 and 9, there seems to be no obvious relationship between the Doppler
temperature and the line intensity.
DOPPLER TEMPERATURE IN AURORA 143
Figure 4.
(UT).
Jan.
8002
— 600
,t 400
o_
Lu 200
1--0 11 Jan. 17 Jan. 18I
[ 4
6 Jan 8 . 17 a18,
10 1977 12 UTDoppler temperatures derived from the oxygen green line The results with equivalent errors are shown by circles for 18. on
Jan.
January
17 and
17 and 18 by dots for w LL m I-4 cc w a_ 2 w i--1200 800 400 oL 6I
1 6300_!
8Jan.
10
19.
1977
12 14 UTFigure 5. Doppler temperatures derived from the oxygen red line on
January
19 (UT).
Y ...- W Er M F-CC W 0- M W I-1200 800 400 0
6300 A
• • •-•4 • • • •• ••• ••• z 6 8 10 12 UT )-I, 4001—a, (7) ,,200 6 t
1- 0 Z (-) 0 Jan. 20, 1977 Figure 6. also Doppler plotted.H. KAMIYAMA and S. OKANO 144
Doppler Temperatures of the
OI x 6300A on Jan.
19, 1977 Table 3. Remarks Zenith Angle Temperature PeriodTime (UT)
Very thin No auroracloud covering all sky 30N 716 695 958 862 698 786 + 96 ± 114 + 84 ± 99 ± 91 ± 97 Cloud 45-80N 0545-0608 0551-0613 0556-0619 0602- 25 08- 30 0545-0630 0556 0602 08 13 19 0608 Part A B C D E Mean 30N 891 + 147 781 ± 135 815 ± 148 878 ± 96 821 ± 59 837 ± 117 0637-0700 0643-0705 0648-0711 0654-0717 0700-0723 0637-0723 0648 54 0700 05 11 0700 A B D E Mean 30N Data damaged 30N Weather recovering * 0735-0759 514 737 751 715 550 653 ± 80 ± 131 ± 154 ± 121 ± 109 ± 119 Clear sky 30N 730 ± 126 697 ± 169 675 ± 150 564 ± 132 580 ± 120 649 ± 139 0804-0816 07- 19 10- 22 13- 25 16- 28 0804-0828 0810 13 16 19 22 0816 A B C D E Mean Clear sky Data No. 34 35 30N 36 37 0834-0849 38- 52 41- 56 45-0900 49-0903 0834-0903 0841 45 49 52 56 0849 A B C D E Mean 38 587 ± 106 702 ± 115 622 ± 136 592 + 136 591 ± 109 619 ± 120 0910-0922 13- 24 16- 27 19- 30 22- 33 0910-0933 0916 19 22 24 27 0922 A B C D E Mean 39 Very Faint fine weather diffuse aurora at 60N
Faint diffuse aurora 45-60N 30N 718 ± 125 735 ± 112 729 ± 114 678 ± 162 628 ± 182 698 ± 139 0937-0949 40- 51 43- 54 46- 57 49-1000 0937-1000 0943 46 49 51 54 0949 A B C D E Mean 40 30N 760 741 781 598 626 701 ± 71 ± 78 ± 118 ± 63 ± 84 ± 83 1004-1016 07- 19 10- 21 13- 24 16- 27 1004-1027 1010 13 16 19 21 1016 A B C D E Mean 41
Faint diffuse aurora 50N 30N 646 ± 48 608 ± 64 621 ± 102 607 ± 83 595 ± 89 615 ± 77 1032-1044 35- 47 38- 49 41- 52 44- 55 1032-1055 1038 41 44 47 49 1044 A B C D E Mean 42
DOPPLER TEMPERATURE IN
Table 3. cont'd
AURORA 145
Data No. Part
Time (UT)
43 44 45 A B C D E Mean 1108 11 14 16 19 1114 A B C D E Mean 1131 32 33 34 35 1133 A B C D E Mean 46 1143 43 44 45 46 1144 A B C D E Mean 1200 03 06 09 12 1206
Period Temperature Zenith
Angle Remarks 47 1102-1114 05- 16 08-- 19 11- 22 14- 25 1102-1125 30N 67 57 48 81 31 57 688 ± 681 ± 686 ± 744 ± 804 ± 721 ±
Weak diffuse aurora at 50N
Active arc at 45N 1129-1133 30- 34 31- 35 32- 36 33- 37 1129-1137 666 ± 91 30N 637 ± 88 511 ± 41 515 ± 53 565 ± 95 579 ± 74 Curtain-like aurora 30-45N 1141-1144 42- 45 43- 46 43- 47 44- 48 1141-1148 677 ± 130 30N 703 ± 135 679 ± 153 * 754 ± 167 703 ± 146 Diffuse aurora * Data unreliable 1154-1206 1157-1209 1200-1212 03- 15 06- 18 1154-1218 30N 692 ± 83 679 ± 71 490 ± 128 742 ± 94 711 ± 63 663 ± 88
Weak diffuse aurora 45-70N
A B C D E Mean 1227 30 33 36 39 1233 I 1221-1233 24- 36 27- 39 30- 42 33- 45 12214245 30N 78 91 92 98 99 92 858 ± 914 ± 650 1 636 574 ± 726 ±
Faint diffuse aurora at 60N
48 A B C D E Mean 1255 58 1301 05 08 1300 1249-1301 1252-1305 1255-1308 1258-1311 1301-1314 1249-1311 30N 732 ± 181 733 ± 121 460 ± 166 584 ± 165 * 627 ± 158
Faint diffuse aurora at 70N
* Data unreliable
49 A 1324 1318-1330 515± 55 30N Faint diffuse aurora at 70N
B 27 21- 34 578 ± 93 C 30 24- 37 431 ± 81 D 34 27- 40 527 ± 193 E 37 30- 43 * * Data unreliable Mean 1329 1318-1340 513 ± 106 50 A B C D E Mean 1352 55 58 1401 05 1358 1346-1358 1349-1401 1352-1405 1355-1408 1358-1411 1346-1411 461 ± 191 * 355 ± 194 556 ± 178 549 ± 148 480 ± 178 30N Almost no aurora * Data unreliable
H. KAMIYAMA and S. OKANO 146
Doppler Temperatures of the
OI A 6300A on Jan.
20, 1977 Table 4. Remarks Zenith Angle Temperature PeriodTime (UT)
Part Data No. Airglow in twilight 40N 787 725 934 784 826 811 ± 117 ± 149 ± 166 ± 101 ± 114 ± 129 0345-0359 0348-0402 0352-0405 0355-0409 0359-0412 0345-0412 0352 55 59 0402 05 0359 A B C D E Mean 51 Proton aurora 0-60N 40N 584 ± 86 563 ± 76 623 ± 106 775 ± 154 728 ± 103 655 ± 105 0417-0431 20- 34 24- 38 27- 41 31- 45 0417-0445 0424 27 31 34 38 0431 A B C D E Mean 52 Proton aurora 45S-70N Curtain-like aurora 60-70N 40N 643 th 49 738 ± 53 843 th 120 653 ± 61 756 th 68 727 th 67 0448-0502 0451-0505 0455-0509 0458-0512 0502-0516 0448-0516 0455 58 0502 05 09 0502 A B C D E Mean 53 Proton aurora 10S-70N Faint curtain-like aurora 60-70N 40N 48 58 68 64 88 65 673 ± 722 ± 600 ± 755 ± 736 ± 697 ± 0520-0534 23- 37 27- 41 30- 44 34- 48 0520-0548 0527 30 34 37 41 0534 A B C D E Mean 54Faint diffuse aurora 0-70N 40N 684 ± 81 723 ± 55 421 ± 127 855 ± 70 988 ± 58 727 ± 78 0552-0606 0555-0609 0559-0613 0602- 16 06- 20 0552-0620 0559 0602 06 09 13 0606 A B C D E Mean 55
Faint diffuse aurora 60-90N 40N 833 ± 79 738 ± 45 679 ± 139 639 ± 70 764 ± 84 731 ± 83 0652-0705 0655-0708 0659-0712 0702- 15 05- 18 0652-0718 0659 0702 05 08 12 0705 A B C D E Mean 56
Very faint diffuse aurora 65-90N * Data unreliable 40N 1127 794 * * ± 161 ± 179 875 ± 196 932 ± 179 0723-0736 26- 39 30- 43 33- 46 30- 49 0723-0749 0730 33 36 39 43 0736 A B C D E Mean 57 Same as before 40N 818 ± 114 756 ± 135 751 ± 120 831 ± 100 843 t 62 800 ± 106 0754-0808 0757-0811 0801- 15 04- 18 08- 21 0754-0821 0801 04 08 11 15 0808 A B C D E Mean 58
DOPPLER TEMPERATURE IN AURORA 147 Table 4. cont'd Data No. 59 Part A B E Mean 60 61 62 A B C D E Mean A B C D E Mean A B C D E Mean
Time (UT)
0833 36 39 42 46 0839 0903 06 09 12 16 0909 0928 28 29 30 31 0929 0938 38 39 40 41 0939 Period 0826-0839 29- 42 33- 46 36- 49 39- 52 0826-0852 63 64 65 66 0856-0909 0859-0912 0903- 16 06- 19 09- 22 0856-0922 0926-0929 27- 30 28- 31 28- 32 29- 32 0926-0932 A B C D E Mean A B C D E Mean 0947 47 48 49 50 0948 0957 57 58 59 1000 0958 A B C D E Mean A B C D E Mean 1006 06 07 08 09 1007 1016 16 17 18 19 1017 0936-0939 37- 40 38- 41 38- 42 39- 42 0936-0942 0945-0948 46- 49 47- 50 47- 51 48- 51 0945-0951 0955-0958 56- 59 0957-1000 0957-1001 0958-1001 0955-1001 1004-1007 05- 08 06- 09 06- 10 07- 10 1004-1010 1014-1017 15- 18 16- 19 16- 20 17- 21 1014-1021 Temperature 961 ± 126 935 ± 144 797 ± 198 820 ± 122 800 ± 86 863 ± 135 876 ± 51 791 ± 78 488 ± 183 603 ± 64 646 ± 92 681 ± 94 742 ± 184 * 582 ± 163 781 ± 72 776 ± 78 723 ± 124 775 ± 173 613 ± 162 505 1 73 606 ± 74 737 ± 86 647 ± 142 702 ± 86 728 ± 146 490 ± 161 792 ± 154 862 ± 177 588 ± 149 953 ± 180 899 ± 178 668 ± 86 737 ± 67 299 ± 118 711 ± 126 640 ± 69 777 ± 102 602 ± 110 627 ± 99 580 ± 88 645 ± 94 565 ± 90 619 ± 176 533 ± 193 652 ± 183 639 ± 178 602 ± 160 Zenith Angle 40N 40N 40N 40N 40N 40N 40N 40N RemarksFaint diffuse aurora 45-70N
Diffuse aurora 45-70N Bright aurora appeared at N
horizon
Diffuse aurora 45N * Data unreliable
Moderately bright aurora at 70N
Moderately bright arc at 45N
Moderately bright arc 30-45N
Moderately bright multiple arc at 10S, 40N, 50N
Active birght ray at zenith
H. KAMIYAMA and S. OKANO 148 cont'd Table 4. Remarks Zenith Angle Temperature Period
Time (UT)
Part Data No.Three bright arc in NS direction 40N 471 ± 66 450 ± 63 484 ± 177 905 ± 142 1007 ± 124 663 ± 114 1023-1026 24- 27 25- 28 25- 29 26- 30 1023-1030 1025 25 26 27 28 1026 A B C D E Mean 67
Diffuse aurora in all sky Bright aurora at 70NW 40N 91 98 93 64 84 86 656 ± 636 ± 563 ± 583 ± 662 ± 620 ± 1032-1035 33- 36 34- 37 34- 38 35- 38 1032-1038 1034 34 35 36 37 1035 A B C D E Mean 68
Bright diffuse aurora in all sky 40N 489 ± 125 506 ± 140 605 ± 164 613 ± 69 647 ± 95 570 ± 119 1042-1045 43- 46 44- 47 44- 48 45- 48 1042-1048 1044 44 45 46 47 1045 A B C D E Mean 69
Bright diffuse aurora 10S-60N 40N 844 ± 141 697 ± 47 582 ± 125 717 ± 81 655 ± 80 699 ± 95 1051-4054 52- 55 53- 56 53- 57 54- 57 1051-1057 1053 53 54 55 56 1054 A B C D E Mean 70
Bright diffuse aurora 0-60N
* Data unreliable 40N 645 ± 156 648 ± 136 611 ± 108 478 ± 183 * 596 ± 146 1101-1104 02- 05 03- 06 03- 07 04- 07 1101 -1107 1103 03 04 05 06 1104 A B C D E Mean 71 Same as before 40N 919 1 93 760 ± 91 623 ± 78 648 ± 78 796 ± 121 749 ± 92 1110-1113 11- 14 12- 15 12- 16 13- 16 1110-1116 1112 12 13 14 15 1113 A B C D E Mean 72 Bright arc 30-50N Diffuse aurora 0-70N 40N 1139 ± 81 883 ± 87 562 ± 189 1023 f 163 531 ± 83 827 ± 120 1119-1122 20- 23 21- 24 21- 25 22- 26 1119-1126 1121 21 22 23 24 1122 A B C D E Mean 73
Active bright aurora 0-70N 40N 731 ± 43 860 ± 87 541 ± 151 887 ± 131 596 ± 65 723 ± 95 1129-1132 30- 33 31- 34 31- 35 32- 36 1129-1136 1131 31 32 33 34 1132 A B C D E Mean 74
DOPPLER TEMPERATURE IN Table 4. cont'd AURORA 149 Data No, 75 76 Part A B C D E Mean A B C D E Mean 77 A C D E Mean
Time (UT)
1141 41 42 43 44 1142 1150 50 51 52 53 1151 1159 59 1200 01 02 1200 78 A B C D E Mean 1209 09 10 11 12 1210 79 80 81 82 A B C D E Mean A B C D E Mean A B C D E Mean A B C D E Mean 1218 18 19 20 21 1219 1234 36 37 39 41 1237 1252 53 55 57 59 1255 1310 11 13 15 17 1313 Period 1139-1142 40- 43 41- 44 41- 45 42- 46 1139-1146 1148-1151 49- 52 50- 53 50- 54 51- 55 1148-1155 1157-1200 1158-1201 1159-1202 1159-1203 1200-1204 1157-1204 1207-1210 08- 11 09- 12 09- 13 10- 13 1207-1213 1216-1219 17- 20 18- 21 18- 22 19- 22 1216-1222 1230-1237 32- 39 34- 41 36- 43 37- 45 1230-1245 1248-1255 50- 57 52- 59 53-1301 55-1303 1248-1303 1306-1313 08- 15 10- 17 11- 19 13- 21 1306-1321 Temperature 597 ± 92 629 ± 100 565 ± 96 713 ± 100 755 ± 143 652 ± 106 723 ± 152 689 ± 133 424 ± 79 519 ± 81 572 ± 71 585 ± 103 481 ± 87 683 ± 115 663 ± 151 843 ± 129 590 ± 99 652 ± 116 684 ± 129 726 ± 133 509 ± 122 667 ± 159 765 ± 154 670 ± 139 718 ± 149 784 ± 125 643 ± 139 725 ± 141 770 ± 131 728 ± 137 705 ± 673 ± 561 677 ± 718 ± 667 ± 50 44 39 41 49 45 787 ± 89 637 ± 101 506 ± 111 580 ± 108 483 ± 90 599 ± 100 632 ± 626 ± 724 + 819 ± 915 ± 743 ± 56 35 71 69 72 61 Zenith Angle 40N 40N 40N 40N 40N 40N 40N 40N RemarksModerately bright diffuse aurora 0-65N
Bright aurora changing rapidly 0-65N
Moderately bright diffuse aurora 10S-70N
Moderately bright diffuse aurora 15S-70N
Moderately bright diffuse aurora 20S-60N
Quiet diffuse aurora 10S-60N
Diffuse arc at 30N
H. KAMIYAMA and S. OKANO 150
Doppler Temperatures of the
01 x 6300A on Jan.
29, 1977 Table 5. Remarks Zenith Angle Temperature PeriodTime (UT)
Part Data No. No aurora 40N 984 1032 1650 630 707 1001 ± 172 ± 97 ± 145 ± 144 ± 198 ± 151 0537-0549 40- 52 43- 55 46- 59 49-0602 0537-0602 0543 46 49 52 55 0549 A B C D E Mean 88 * Data unreliable Diffuse aurora at 70N 40N * 518 716 541 685 615 ± 173 ± 177 ± 77 ± 56 ± 121 0606-0618 09- 21 12- 24 15- 28 18- 31 0609-0631 0612 15 18 21 24 0628 A B C D E Mean 89Arc at 70N
Ray at zenith
* Data unreliable
Electron density increasing
(Report from Chatanika)
30N 1094 833 718 * ± 123 ± 64 ± 82 608 ± 167 813 ± 109 0707-0719 10- 22 13- 25 16- 29 19- 32 0707-0732 0713 16 19 22 25 0719 A B C D E Mean 90 Arc 45-70N 30N 857 807 703 669 1009 809 ± 105 ± 107 ± 94 ± 129 ± 135 ± 114 0736-0742 38- 44 39- 45 41- 47 42- 49 0736-0749 0739 41 42 44 45 0742 A B C D E Mean 91 Arc ,.,50N 30N 845 ± 49 790 ± 74 564 ± 93 851 ± 103 843 ± 55 779 ± 75 0752-0755 53- 56 53- 56 54- 57 55- 58 0752-0758 0753 54 55 56 56 0755 A B C D E Mean 92 Arc —50N 30N 804 764 727 701 805 760 ± 133 ± 119 ± 174 ± 100 ± 85 ± 122 0801-0804 02— 05 02— 05 03— 06 04— 07 0801-0807 0802 03 04 05 05 0804 A B C D E Mean 93 Are 40N * Data unreliable 30N 643 * 545 775 743 677 ± 197 Jb 171 ± 135 Jb 175 170 0811-0813 11- 13 12- 14 12- 14 13- 14 0811-0814 0812 12 13 13 14 0813 A B C D E Mean 94
Bright diffuse aurora 20S-40N 30N 683 ± 120 638 ± 123 615 ± 100 681 ± 125 751 ± 93 638 ± 112 0817-0819 17- 19 18- 20 18- 20 19- 20 0817-0820 0818 18 19 19 20 0819 A B C D E Mean 95
DOPPLER TEMPERATURE IN AURORA 151 Table 5. cont'd Data No. 96 97 98 Part A B C D E Mean A B C D E Mean A B C D E Mean 99
Time (UT)
0824 24 25 25 26 0825 0830 30 31 31 32 0831 Period Temperature 0823-0825 23- 25 24- 26 24- 26 25- 26 0823-0826 1 0829-0831 29- 31 30- 32 30- 32 31- 32 0829-0832 0836 36 37 37 38 0837i
0835-0837 35- 37 36- 38 36- 38 37- 38 0835-0838 A B C D Mean 0843 43 44 44 45 0844 100 A B C D E Mean 0849 49 50 50 51 0850 0842-0844 42- 44 43- 45 43- 45 44- 45 0842-0845 101 102 103 A B C D E Mean A B C D E Mean A B C D E Mean 0848-0850 48- 50 49- 51 49- 51 50- 51 0848-0851 0855 56 57 57 58 0857 0904 05 06 06 07 0906 0912 13 14 14 15 0915 0854-0857 55- 57 55- 58 56- 59 57- 59 0854-0859 0903-0906 04- 06 04- 07 05- 08 06- 08 0903-0908 0911-0914 ,--12-r-14612-1'15
13LT,' -4116 142116 0913-0916 613 ± 57 791 ± 91 707 ± 103 798 ± 98 723 ± 93 726 ± 88 838 ± 170 724 ± 185 609 ± 82 854 ± 67 846 ± 84 774 ± 118 747 ± 72 813 ± 64 630 ± 75 845 ± 100 956 ± 197 798 ± 102 1395 ± 120 940 ± 93 796 ± 66 832 ± 160 840 1 173 961 ± 122 740 ± 156 618 ± 144 568 ± 125 733 ± 115 596 ± 95 651 ± 127 678 ± 33 641 ± 53 640 ± 74 851 ± 69 936 ± 110 749 1 68 1003 ± 805 ± 719 ± 790 ± 891 ± 842 ± 74 71 84 92 83 81 * * * 507 ± 691 ± 599 ± 24 65 45 Zenith Angle 30N 30N 30N 30N 30N 30N 30N 30N Remarks Bright arc at 30N Multiple arc 10-30NDiffuse arc at zenith Multiple arc at 30N Multiple arc at 30N Multiple arc 0-30N Multiple arc at 40, 50, 70N Multiple arc 10S-20N Aurora break up 10S-20N * Data unreliable
H. KAMIYAMA and S. OKANO 152 Table 5. cont'd Remarks Zenith Angle Temperature Period
Time (UT)
Part Data No. Diffuse aurora 20S-40N 30N 800 ± 41. 807 ± 45 666 ± 45 812 ± 94 775 ± 108 772 ± 67 0920-0923 21- 23 21- 24 22- 25 23- 25 0920-0925 0921 22 23 23 24 0923 A B C D E Mean 104 Bright arc 10-30N 30N 488 ± 96 784 ± 130 637 ± 83 621 ± 85 1092 ± 94 724 ± 98 0934-0946 37- 49 40- 52 43- 55 46- 58 0934-0958 0940 43 46 49 52 0946 A B C D E Mean 105 Multiple arc 10S-40N becoming active 30N 558 490 789 1179 636 730 ± 121 ± 95 ± 99 ± 175 ± 163 ± 131 1003-1015 06- 18 09- 21 12- 24 15- 27 1003-1027 1009 12 15 18 21 1015 A B C D E Mean 106 * Data Active unreliable arc passing at 30N 30N * * 379 415 1026 607 ± 100 ± 78 ± 98 ± 92 1031-1039 33- 41 35- 43 37- 45 39- 47 1035-1047 1035 37 39 41 43 1041 A B C D E Mean 107 Arc active 30-40N 30N 412 472 525 460 422 458 ± 68 ± 78 ± 85 ± 185 ± 155 ± 114 1051-1054 52- 55 52- 55 53- 56 54- 57 1052-1057 1052 53 54 55 55 1054 A B C D E Mean 108 Arc 0-40N 30N 685 ± 87 698 67 504 ± 175 765 ± 99 726 ± 99 676 ± 105 1100-1103 01- 04 01- 04 02- 05 03- 06 1100-1106 1101 02 03 04 04 1103 A B C D E Mean 109 Diffuse aurora 0-45N * Data unrelia ble 30N 868 f 73 744 ± 65 776 ± 101 891 ± 128 820 ± 92 1108-1111 09- 12 09- 12 10- 13 11- 14 1108-1114 1109 10 11 12 12 1111 A B C D E Mean 110 * Data unreliablePolar patchy aurora 40N-N horizon 30N 4' 529 341 435 ± 163 ± 89 ± 126 1117-1120 18- 21 18- 21 19- 22 20- 23 1119-1123 1118 19 20 21 21 1121 A B D E Mean 111 , ,
DOPPLER TEMPERATURE IN Table 5. cont'd AURORA 153 Data No. 112 Part A B C D E Mean
Time (UT)
1127 28 29 30 30 1129 Period 113 A B C D E Mean 1142 45 48 51 54 1148 Temperature 1126-1129 27- 30 27- 30 28- 31 29- 32 1126-1132 1136-1148 39- 51 42- 54 45- 57 48-1200 1136-1200 757 ± 81 756 ± 104 848 ± 70 1036 ± 88 667 ± 122 813 ± 93 Zenith Angle Remarks 30N Pulsating aurora 114 584 ± 69 615 ± 50 747 ± 170 585 ± 31 842 ± 50 675 ± 7430N Weak pulsating aurora in all sky
A B C D Mean 1211 14 17 20 23 1217 1205-1217 08- 20 11- 23 14- 26 17- 29 1205-1229 115 A B C D E Mean 1240 43 46 49 52 1246 I 887 ± 98 711 ± 112 686 ± 54 677 ± 68 681 ± 74 728 ± 81 1234-1246 37- 49 40- 52 43- 55 46- 58 1234-1258
30N Weak pulsating aurora
461 ± 88 758 + 103 582 ± 117 554 ± 82 663 ± 74 604 ± 93
I
130N Pulsating aurora fade out ' gradually Y---1200 F i I -
L
Cr
a -1
1
6300
A :
ma 800 T .. .•• •1
1— 4-a• 1•. i i i
Cr
-
i
W
2 400
7 •
ili
-
-F-
-
o
1
1
i
6
8
10
12 UT
Jan.
29,
1977
Figure 7. Doppler temperatures
of the red line on January 29 (UT).
Ili
.11
4'
6300A
I
11
I?
fi
fj t
i f f'
'I
154 H. KAMIYAMA and S. \.NO
Y
w
ct
n
1—
cr
w
EL
w
I—
600
400
200
Figure 8. Figure 9. line on — •11
5577 A
• • 'atill
Ti
4it
T'1+
a. • • • •• •l..
• • • ••• •• • • • •6
8
10
Jan.
30,
1977
Doppler temperatures and intensities of the green
Y
w
x
n
H
Et
U-1
0_
2
Lu
i-500
400
300
10000
75000
3 2111000
7500
3200
12 UT
tf
N
z
0
(.)
CT)
on January 30200'
3 5Jim,
7I4
02
1033
5 7
1
INTENSITY
(Counts/Sec)
A scattered
diagram of Doppler emperatures
tagainst line intensities
January 30 (UT).
11 1
1
1
11
1I 1 1 1
• • • • I" • • • • oft, • • • • • • • •p — 5e _ • • • • — • • I 1 I 1 11 1 1- 1 1 1 1 11 (UT).Table
DOPPLER
TEMPERATURE
IN AURORA
6. Doppler Temperatures
of the 01 x5577A on Jan. 30, 1977
155
Data No. Part
Time (UT)
116 A B C D E Mean 0559 0600 00 01 02 0600 Period Temperature 0558-0600 0559-0601 0559-0602 0600- 02 00- 03 0558-0603 442± 164 311± 103 491± 65 576± 74 650± 63 494± 94 Zenith Angle Remarks 20N 117 118
Ray at the zenith
A B C D Mean 0607 08 08 09 10 0608 1 1 I 0606-0608 07- 09! 07- 10 08- 10 08- 11 0606-0611 397± 405± 323± 325± 343± 359± 28 34 39 71 82 51 20N
i
Weak ray at the zenith
A B C D E Mean 119 120 0616 17 17 18 19 0617
I
1
0615-0617 16- 18 16- 19 17- 19 17- 20 0615-0620 585± 173 646±192 443± 146 280± 50 305± 30 452± 118 20N iCurtain-like active aurora 0-30N
A B C D E Mean A B C D Mean 121 0625 25 26 26 27 0626 0632 32 33 33 34 0633 A B C D E Mean 0639 39 40 40 41 0640 0624-0626 24- 26 25- 27 25- 27 26- 27 0624-0627 551±149 599± 135 328± 78 275± 33 283± 99 407± 99 i I 20N
I
I S ame as before 0631-0633 31- 33 32- 34 32- 34 33- 34 0631-0634 0638-0640 38- 40 39- 41 39- 41 40- 41 0638-0641 611±197 558±138 315± 52 210± 45 255± 84 390+10320N I Less active
ray 0-30N
509± 129 256± 53 261± 100 386± 57 481± 29 379± 74 i 20N 122 A B C D E Mean 123 0645 45 46 46 47 0646 0644-0646 44- 46 45- 47 45- 47 46- 47 0644-0647 471± 503± 364± 482± 559± 477± 23 38 53 66 50 46 20N Surge 0-30N Multiple arc 30-70N 1
I
Multiple arc 45-80N A B C D E Mean 0652 52 53 53 54 0653 0651-0653 51- 53 52- 54 52- 54 53- 54 0651-0654 451± 401± 356± 463± 647± 464± 54 32 38 43 83 50 20N Multiple arc 30-70N156 H. KAMIYAMA and S. OKANO
Data No.1 Part
Table 6
(cont'd)
Time (UT)
me (UT)
Period
124 A B C D E Mean 0659 59 0700 00 01 0700 Temperature 0658-0700 0658-0700 0659-0701 0659-0701 0700-0701 0658-0701 449± 84 309± 25 251± 35 378± 67 500 57 377± 54 Zenith Angle i 20N Remarks I Multiple arc 30-70N 125 ---7 126 A B C D E Mean 0705 05 06 06 07 0706 0704-0706 04- 06 05- 07 05- 07 06- 07 0704-0707 420± 47 405± 44 329+ 36 373± 34 435+ 27 392± 38 20N 20N Multiple arc 40-70N A B C D E Mean 0713 13 14 14 15 0714 0712-0714 12- 14 13- 15 13- 15 14- 15 0712-0715 423± 60 455± 45 292± 70 383± 68 411± 49 393± 58 Same as before ,
I
127 128 129 A B C D E Mean A B C D E Mean I A ' B C D E Mean 0733 34 34 34 34 0734 0738 39 39 39 39 0739 0742 43 43 43 43 0743 0733-0734 33- 34 33- 34 34- 35 34- 35 0733-0735 429± 505± 211± 313± 304± 352± 0738-0739 38- 39 38- 39 39- 40 39- 40 0738-0740 0742-0743 42- 43 42- 43 43- 44 43- 44 0742-0744 35 30 49 34 75 45 570± 19 589± 36 396± 61 433± 73 518± 75 501± 53 597± 27 588± 24 342± 53 466± 51 498± 53 498± 4220N Bright diffuse aurora 0-20N
20N Multiple arc 30-70N 20N
1
130 A . B C D E Mean 0747 48 48 48 48 0748 0747-0748 47- 48 47- 48 48- 49 48- 49 0747-0749 A B C D E Mean 131 0753 53 53 53 54 0753 0752-0753 52- 53 53- 54 53- 54 53- 54 0752-0754 480± 20 463± 23 327± 56 450± 45 500± 36 444± 36 645± 61 471± 27 365± 47 431± 35 505± 14 483± 37 IModerately bright multiple arc 30-70N 20N Same as before
I
1 20N Same as before !DOPPLER TEMPERATURE IN AURORA 157
Table 6
(cont'd)
Data No.
132
Part
Time (UT)
A B C D E I Mean 0759 0800 00 00 00 0800
Period , Temperature Zenith Angle
it
0759-0800 0759-0800 0759-0800 0800- 01 00- 01 0759-0801 419± 5 430± 14 283± 24 359± 35 398± 21 378± 20 20N Remarks 133 A B C D E Me an 0802 03 03 03 03 0803 0802-0803 02- 03 02- 03 03- 04 03- 04 0802-0804 134 A B C D E Mean 135 136 A B C D E Mean 0807 08 08 08 08 0808i
0807-0808 07- 08 07- 08 08- 09 08- 09 0807-0809 137 0859 0900 00 00 00 0900 0859-0900 0859-0900 0859-0900 0900- 01 00- 01 0859-0901 A B C D E Me an 0905 05 05 05 06 0905 0904-0905 04- 05 05- 06 05- 06 05- 061 0904-0906
A B C D E Mean 138 139 0910 10 10 10 11 0910 A B C D E Mean A B C D E Mean 0914 15 15 15 15 0915 0909-0910 09- 10 10- 11 10- 11 10- 11 0909-0911 0914-0915 14- 15 14- 15 15- 16 15- 16 0914-0916 0919 20 20 20 20 0920 0919-0920 19- 20 19- 20 20- 21 20- 21 0919-0921 1 Diffuse aurora 0-30N 447± 25 471± 30 253± 43 314± 16 331± 31 363± 25 I20N I Diffuse aurora 0-30N decaying
498± 50 491± 41 362± 33 330± 15 389+ 30 414± 34 i 20N Diffuse aurora 0-30N 441± 32 437± 31 302± 20 389± 34 419± 16 398± 27
20N
1 Arc
0-30N
changing
323± 14 344± 15 284± 36 392± 34 403± 27 349± 25 401± 38 398± 48 244± 19 295± 24 312± 32 330± 32 20N Patchy aurora 20SCalm at the zenith
20N Weak diffuse aurora at the zenith 369± 9 351± 12 279± 23 354 30 384+ 17 347± 18
20N Diffuse aurora at the changing zenith 398+ 61 360± 62 254± 12 323± 17 333± 5 336± 31
20N Less active patchy aurora at the zenith
158 H. KAMIYAMA and S. OKANO
Table 6
(cont'd)
Data No.
140
Part
Time (UT)
141
•A
• B C D E Mean A B C D E Mean A B C D E Mean 0925 25 25 25 26 0925 Period ; Temperature 0924-0925 24- 25 25- 26 25- 26125- 26 I
0924-0926
1
363± 366± 307± 332+ 335± 341+ 15 24 21 23 23 21 0949 49 49 49 50 0949 0954 54 54 54 55 0954 0948-0949 48- 49 49- 50 49- 50 49- 50 0948-0950 360± 357± 318± 405± 376± 363± Zenith Angle 40 38 63 31 27 40 20N 142 Remarks Calm 0953-0954 53- 54 54- 55 54- 55 54- 55 0953-0955 20N 20NI
Moderately bright diffuse aurora 0-30N 354± 359± 296± 335± 340± 337± 33 22 25 11 19 22 Diffuse aurora 0-30N 143 A B C D E Mean 0958 59 59 59 59 0959 0958-0959 58- 59 58- 59 59-1000 59-1000 0958-1000 357± 349± 329± 381± 369± 357± 37 33 15 14 12 22
20N Diffuse aurora at the zenith decaying 144 ! A ' B C D E Mean 1046 46 46 46 47 1046
i
1045-1046 45- 46 46- 47 46- 47 46- 47 , 1045-1047 397± 402± 378± 456± 435± 414± 62 41 30 40 39 4220N Bright band aurora at the zenith
145 A B C D E Mean 1119 19 19 19 20 1119 146 1118-1119 18- 19 19- 20 19- 20 19- 20 1118-1120 A B C D E Mean 1123 24 24 24 24 1124
1
1123-1124 23- 24 23- 24 24- 25 24- 25 1123-1125 147 A B C D E Mean 1130 31 31 31 31 1131 1130-1131 30- 31 30- 31 31- 32 31- 32 1130-1132 374± 382± 337± 428± 445± 393± 39 45 37 31 29 36 20N 518± 25 470± 40 275± 82 358± 60 344± 45 393± 50 20NWeak aurora in NS direction
Patchy aurora at the zenith
187± * 173± 266± 303± 232± 64 29 24 53 43
Patchy aurora moving westward
i i 20N Active aurora 0-20N * Data unreliable I
DOPPLER TEMPERATURE\ IN AURORA 150
Table
6 (cont'd)
Data No. Part
A B C D E Mean A B C D E Mean
Time (UT)
Period148 1135 36 36 36 36 1136 1135-1136 35- 36 35- 36 36- 37 36- 37 1135-1137 Temperature Zenith Angle 239± 218± 232± 278± 284± 252± 21 8 22 13 15 16 149 1140 41 41 41 41 1141 ! 20N 1140-1141 40- 41 40- 41 41- 42 41- 42 1140-1142 1 Active 326± 337± 331± 426± 464± 377± 39 36 29 39 40 37 20N Active Remarks
arc at the zenith
150
arc at the zenith westward 1146 46 46 46 47 1146 1145-1146 45- 46 46- 47 46- 47 46- 47 1145-1147 moving A B C D E Mean 422± 425± 360± 371± 374± 390± 27 17 26 69 66 41
20N Becoming less active
151 2 15 A B C D E Mean 1150 50 50 50 51 1150 1149-1150 49- 50 50- 51 50- 51 50- 51 1149-1151 443± 61 394± 53 414± 81 524± 67 496± 58 454± 64 20N 20N Calm A B C D E Mean 1159 1200 00 00 00 1200 i 1159-1200 1159-1200 1159-1200 1200-1201 00- 01 1159-1201 405± 391± 392± 261± 325± 355± 91 86 98 25 36 67 Active arc 10-20N
5. Concluding Remarks
In this ground-based auroral observation an improved Fabry-Perot interferometer
with an intensity compensating system was employed to measure the Doppler
broaden-ing of the oxygen green and red lines. Although an altitude of the emission layer
cannot be ascertained simply from a ground-based observation, the Doppler temperature
ranges in general from 300°K to 500°K for the green line and from 500°K to 800°K for
the red line. In airglow, as is the case of January 17 or of a middle latitude (Kamiyama,
et al., 1975a; Hernandez, 1976), green line Doppler temperatures were found to be
around 200°K. Therefore, the results for the green line in auroras seem to be
con-siderably high as compared with those in airglows.
It is uncertain, however, that
these high temperatures can be ascribed to an atmospheric heating by precipitating
particles.
On the contrary, temperatures derived from the red line in auroras are generally
lower than those obtained from airglow data at middle and low latitudes (Kamiyama,
et al., 1975b; Hernandez and Robel, 1976). This suggests an appreciable lowering of
160 H. KAMIYAMA and S. OKANO