Adaptation to future sandy beach loss due to
sea level rise by consideration of tourism
benefit
著者
Chatuphorn Somphong
学位授与機関
Tohoku University
学位授与番号
11301甲第18954号
- 1 -
Summary of
Adaptation to Future Sandy Beach Loss Due to Sea Level
Rise by Consideration of Tourism Benefit
Chatuphorn Somphong
A dissertation submitted to the Tohoku University in partial fulfillment
of requirements for the degree of Doctor of Philosophy in
Environmental Studies
September 2019
Tohoku University
JAPAN
2
Chapter 1: INTRODUCTION
1.1 Background
Thailand has a long coastline. The coastline includes beach which provides invaluable habitats for marine ecosystem and resources of tourism. Sea level rise caused by climate change will enhance coastal erosion. In this subsection, we review the observation and studies for coastal erosion.
The historical shoreline change over the past two decades in Thailand was mainly based on field observations or analysis of a series of satellite images (DCMR Staff, 2018); Nutalaya (1996). Those observations were based on the availability of images which covered the majority of Thailand’s coastlines, and they could reveal that the shorelines had been experienced erosion in the past.
Summary of Literature Reviews
Several studies have already considered the effect of climate change causing sea level rise on coastal erosion (e.g., Hinkel, 2013; Ranasinghe et al., 2012). The projection of sea level rise provided by the IPCC 5th assessment report (IPCC AR5, Chapter 13), indicated almost all the coastlines worldwide would be affected by the end of the 21st century including Thailand. To discuss the projection of erosion, many studies around the world used the Bruun (1962) Rule due to its simplicity (Allenbach et al., 2015; Dean, 2016; Udo and Takeda, 2017) and requires few data set such as sediment sizes, beach profiles, and beach slopes along with the oceanographic data (i.e. waves and tides). Also, it is possible to find data for future projection in Thailand. Regarding the availability of beach dataset, Ritphring (2018) had already collected sediment sizes and beach slopes though field measurements across Thailand in 2010-2017.
The future situations potentially have some significant impacts according to the projection results by Hinkel et al., (2014), although it is unclear whether the past coastal erosion in Thailand was dominated by climate drivers or not. In the developing country like in Thailand requires urgent countermeasures to deal with sea level rise because of the fast development in the coastal zone. For project planners, the cost-benefit analysis could be adopted as a tool to determine the proper adaptations. Since the very limited estimation of coastal areas benefits, at present, one essential goal is that Thailand would need the economic assessment of the coastal erosion for the long-term adaptation planning.
1.2 Objectives
In this study, the database of the beaches are collected in order to evaluate the impacts of the climate change on coastal zones. The projection of future beach loss due to sea level rise along Thailand are presented, and the uncertainties due to sediment size and the calculation models are analyzed. Since the sandy beach is a non-market resource that provides many essential services, the economic value of the beach is needed to be evaluated. Finally, the adaptation to cope with the future sea level rise should also be determined. The objectives can be specified
3 as follows.
1) To develop the national database of beach characteristics; beach slope, beach width, and beach sediment size, at each coastal zone in Thailand.
2) To project future shoreline recession against the SLR data, which are submitted to the Couple Model Intercomparison Phase 5 (CMIP5) (IPCC, 2013) using the Bruun rule and analyze the uncertainties caused by different RCP scenarios and CMIP5 models.
3) To evaluate the tourism or recreational benefit of the beach that capitalized into hotel prices using the Hedonic Pricing method.
4) To propose beach nourishment as the adaptation measures to cope with the future sea level rise and present the map of sand volume and costs for each coastal zone, as well as analyze the cost-benefit.
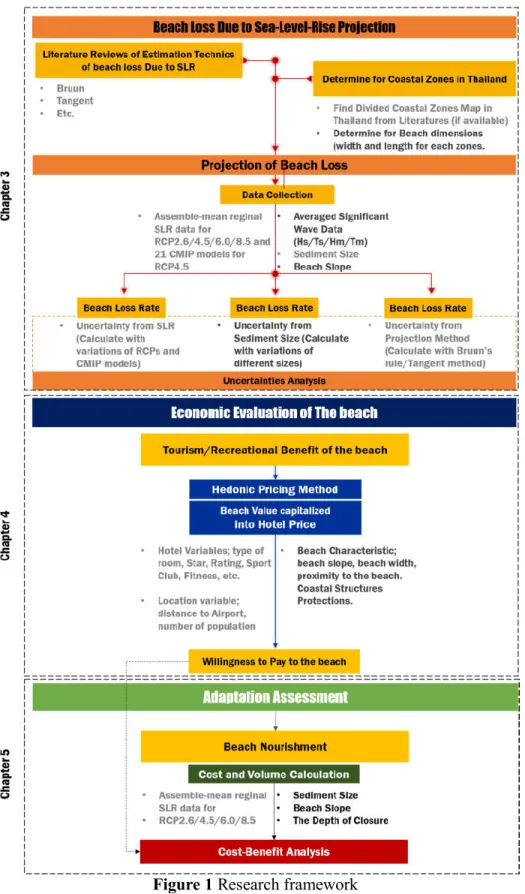
1.3 Research Framework
In this section, the flow chart of the overall study is described as shown in Figure 1 The figure illustrates 3 parts of the study; the projection of future beach loss using the Brunn model and uncertainty analysis as the first parts, the economic value of the beach subjected to the accommodation price by hedonic method as second part, and final part discusses about the beach nourishment as an adaptation measures. Each part of the flow chart describes the main objective, methodology and dataset used in the study.
1.4 Research Outlines
the dissertation are divided into 6 chapters; introduction, study area, projections of future beach loss due to sea level rise, valuing tourism benefits using hedonic pricing model, adaptation assessments, conclusions and recommendations. Each chapter are explained in the following paragraph.
Chapter 1 states the background of the study. It mainly describes the historical erosion
situation in Thailand as well as the contribution factors and the trend of the future erosion and data availability.
Chapter 2 describes the study area, which is the entire sandy beach zones across
Thailand. Since beach characteristics have been scattered collected in the previous literatures, they are collided and presented in this study. The wave and SLR data are also discussed in this chapter.
Chapter 3 contains, in the first part, the projection of future beach loss requires SLR
data from IPCC (2013) and the beach characteristics. In the second part, the beach loss rate are calculated based on each RCP scenarios as well as the uncertainties due to sediment size and CMIP5 models.
4
Chapter 4 explains about the need for evaluation of non-market resource such as sandy
beach. The importance of tourism (or recreational) services of the beach. The average marginal effect of the beach value capitalized into the hotel prices are estimated through hedonic model. Data availability and the location of sampled hotels are also discussed in this chapter.
Chapter 5 presents the adaptation measure which is the beach nourishment. The
computational models for sand volume and its costs are also presented. The cost-benefits analysis is also discussed in order to find the proper beach nourishment for each proposed options.
Chapter 6 concludes the highlight of the research as well as the discussion on the
5
6
Chapter 2: STUDY AREA
2.1 Overview
Thailand’s coastlines covers approximately 3,148 km including 2,055 km in the GOT and 1,053 km in the Andaman Sea. The physical geology of Thailand’s coastlines is categorized into 3 types: sandy coast, rocky coast and tidal flat. The Department of Coastal and Marine Resources (DMCR) (2014) have categorized beaches into 64 zones based on the physical characteristics of beaches, where 51 zones are composed of sandy beaches including 9 zones in the upper GOT (named E-zone), 11 zones in western GOT (S-zone) and 31 zones in the Andaman Sea (A-Zone) (Figure 2.1). Because of the difficulty in data collection, such as dry beach width or beach slope measurement for the other types of beaches, only sandy beaches are considered in this study.
Figure 2.1 Coastal zone in Thailand and location of tide gauge stations. The arrows
remark as the bounder of the beach zone.
2.2 Data Availability
2.2.1 Beach Characteristics
The beach characteristics, i.e., sediment size, beach slope and beach width, were measured in this study. The grain size diameter (d50) and beach slope (tan α) were measured at approximately
230 locations in the period of 2010-2017 (Figure 2.1). Those locations cover all the sandy beach zones in Thailand and each zone had at least one measurement location. At each location, sand samples were collected at the wet zone of the foreshore to find the grain size diameter (d50)
through standard sieve analysis. The beach slopes were obtained from beach profiles and measured by an angle meter in some areas where beach profiles were not measured. Angle meter was use at the same during sand sampling.
7
2.2.2 Sea Level Rises
The regional ensemble-mean sea level rise in Thailand projected by IPCC ranges between 0.34– 0.65 m and it can cause inundation in low-laying areas and recession of the erodible shorelines (IPCC AR5, Chapter 13). Regarding SLR data, this study uses the ensemble-mean regional SLR data (1 degree latitude-longitude resolution) of 21 CMIP5 models for the RCP2.6, RCP4.5, RCP6.0, and RCP8.5 scenarios and the data of each 21 CMIP5 model for the RCP4.5 scenario in 2081−2100 relative to 1986 - 2005 (IPCC, 2013). In total, the ensemble-mean sea level rise data range between 0.34 m − 0.41 m for RCP2.6, 0.21 m − 0.49 m for RCP4.5, 0.42 m − 0.51 m for RCP6.0 and 0.55 m − 0.65 m for RCP8.5.
Figure 2.4. Ensemble-mean regional sea level rise (m) around Thailand’s coastlines in 2081–
2100 relative to 1986-2005
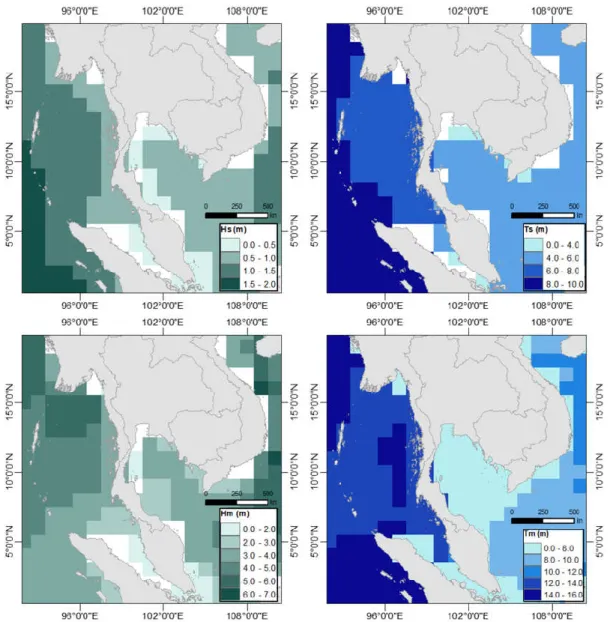
2.2.3 Waves Data
For the wave data set, a 3-hour significantly reanalyzed wave data with 1 degree latitude-longitude resolution provided by The European Centre for Medium-Range Weather Forecasts (ECMWF) (ECMWF; see www.ecmwf.int) for 1980–2010 (30-year period) (Figure 2.5) are used to compute Hs, Ts, He,t, and Te,t. Hs and Ts are determined using the significant wave height
and wave period averaged over the 30-year period, respectively, while He,30 and Te,30 are
determined using the 12-h exceedance significant wave height and over the 30-year period. The time period 1980-2010 was selected, as these years overlap with historical referenced SLR data. According to Figure 2.5, the Andaman Sea side wave characteristics are noticeably larger than those in the Gulf of Thailand side. The Hs ranges between 0.37 m − 1.0 m, while the He,30 ranges
8
Figure 2.5 The 3-h significantly reanalyzed wave data with 1-degree latitude-longitude
9
Chapter 3: PROJECTIONS OF FUTURE BEACH LOSS DUE TO SEA
LEVEL RISE
Coastline recession caused by sea level rise due to climate change has become one of the most significant issues worldwide. Thailand’s coastlines are also likely to face erosion, especially in the low-lying areas, and its future projection due to sea level rise is necessary. This study compiled a database of beach characteristics, including grain size diameter, beach slope and beach width, to assess the projections of future beach loss along Thailand’s coastlines against sea level rise scenarios of the Coupled Model Intercomparison Project Phase 5 (CMIP5) in 2081-2100, relative to a reference period 1986-2005 by using the Bruun rule. Future national beach loss rates were projected to be 45.8% for Representative Concentration Pathway (RCP) 2.6, 55.0% for RCP4.5, 56.9% for RCP6.0, and 71.8% for RCP8.5. In addition, the rate against the sea level scenarios projected by each CMIP5 model for RCP4.5 ranges from 49.1% for MPI-ESM-LR to 73.4% for MIROC-ESM-CHEM. Based on the current beach situation, sandy beaches in 8 and 23 out of 51 zones will disappear for RCP2.6 and RCP8.5, respectively (as shown in Figure 2). The recession was based on the SLR computed from 21 CMIP5 models. Overall, there are no significant change between each of CMIP5 model, but MIROC-ESM-CHEM shows the largest shoreline retreat of all. The most severe erosion occurs mostly on the Andaman Seaside where the beach slope and particle grain size and beach slope are very gentle. Meanwhile, the lower part of the Gulf of Thailand including Songkhla, Pattani and Narathiwat Provinces are affected the least shoreline recession. At 1-m SLR, the total beach loss rate could be over 147%, and the uncertainty in sediment size could reach a maximum of 70%. Furthermore, the uncertainty caused by different CMIP5 models is approximately 22%, because the rates of projected beach loss range from 49.1% (27.22 km2)
using MPI-ESM-LR to 73.4% (40.63 km2) using MIROC-ESM-CHEM). In the Bruun Model
used in this study, the sensitivity of the wave condition i.e., wave height and wave periods do not cover yet in this study. Since the wave has a significant effect on the depth of closure. This study relied on the reanalysis wave data, which may not reflect the true conditions of closure depth. Thus, the future research can address the uncertainty due to the sources of wave data on the projected sea level rise in Thailand. These findings will help governors and stakeholders develop adaptation strategies against beach loss due to sea level rise.
10
Figure 2 The projected beach loss rate and area in 2081–2100 relative to 1986–2005 based on
11
Chapter 4: VALUING TOURISM BENEFITS USING HEDONIC
PRICING MODEL
In the second part of the study, the hedonic price models are applied to the hotel price across Thailand’s coastline, covering 18 coastal provinces. Hotel room attributes, socioeconomic characteristics, coastal resources, and infrastructures characteristics are examined their effects on the variation of the hotel price. The independent variables include proximity to the beach, coral, and mangrove as well as coastal structures attributes (e.g., length of seawall, breakwater). The accommodation data were collected from Booking.com, the world-famous online database for booking the hotel. The data were collected during November 2018 within few days searching the room during available on 10-17 February 2019 and 11-18 August 2019 to represent high and low season respectively. In this study, a total of 2729 hotel room prices were observed for February and 3337 for August. The hotel and room characteristic were also collected from the mentioned online site. The coastal resource and infrastructure variables were taken from the annual report of the Department of Coastal and Marine Resources of Thailand (DMCR) including beach, mangrove, coral, and coastal structure protection variables. The proximity to each coastal resource was analyzed by the geographical information systems (GIS). Through the various ordinary least square estimations, distance to the beach is found significance as well as the size of coral and mangrove area. The hotel price also has significant effects on location in front of the beach and some of the coastal structures. The seasonal effect of the hotel price to coastal protection structures is also discussed. The finding of this study aims to help policymakers in order to select adaptation to coastal erosion in tourism beaches in Thailand.
The willingness to pay for the beaches for tourism benefit is estimated through 3 Hedonic model estimations. Model 1 observes the benefit from the proximity to the beach, model 2 explores the effects of type of coastal structures, and model 3 estimates the benefit from the beachfront location hotel. The prices of the beach are calculated by the average marginal effects of the hedonic coefficients of the beach in each model. The prices are applied though all the beach zones in Thailand. Model 3 is the selected model as it has the best statistic goodness of fits. The results indicate that the benefit from this study yields around 29 billion USD annually which worth as 46.83% of Thailand total tourism revenue in 2018 and 6.38% Thailand’s 2018 Gross Domestic Product (Figure 3). Besides, 5-Stars and 4-Stars contribute the most considerable effect on the accommodation price with a maximum of 207.71%, 85.89% respectively for February and 278.10%, 93.47% for August. The Villa marks as the more expensive room type than the others which raising the average room price by 93.50% in February and 171% in August. The location variables; Population Density and Distance to Airports, do not have a statistically significant effect on the hotel prices for all the specifications. By considering the type of coastal structure attributes (i.e. seawall, revetment, breakwater, pier, and groin), the estimation does not show significance in most of those variables in the high season. In Model 2, only % of pier shows statistical significance at 10% level. While in the rainy season, the coastal structure attributes are showing more statistically significant i.e. % of breakwater and % of groin. The expected sign of % of groin attributes are supposed to be negative as they are considered as dis-amenity. The proximity to the mangrove
12
forest reveals a positive relationship with the hotel price. The price would drop $0.00001 when increase 100 m near the mangrove from sample average distance. The proximity to coral does not significantly contribute to the hotel price as much as its size. The customer would prefer the beauty and aesthetic of coral without no matter where it is. The bigger coral raises the average hotel price by a maximum of $0.4 a week a person.
13
Chapter 5: ADAPTATION ASSESSMENTS
The final part of the study proposes a framework and provides preliminary results of sand volume and costs required for beach nourishment for each coastal zones in Thailand by using Yoshida method and the results indicate that, generally, to maintain the beach width for at least 10 m would require around 200 million USD (RCP2.6) to 516 million USD (RCP8.5) for the entire nation at minimum unit cost of 5.5 USD/m3, but would vastly account for 985
million USD (RCP8.5) at the maximum unit cost of 10.5 USD/m3. Also, it would require a
minimum of 1,062 million USD (RCP2.6) to a maximum of 3,190 million USD (RCP8.5) to keep all the beaches at present width (Figure 4). By considering in provincial scale, it needs more budget to adapt sea level rise with beach nourishment in the Andaman provinces such as Phang-Nga, Phuket, Krabi, Trang and Satun more than the other regions as mentioned in previous section. For the Gulf of Thailand side, popular tourism attractive provinces including, Chon Buri and Prachuap Khiri-Khan required some enormous budgets than the other provinces. The filling sediment size is assumedly as same as the native particles in all beach zone. The study suggests beach nourishment for 16 options including to maintain beach width for at least 10 m, 20 m, 30 m and present-condition width for 4RCP scenarios, and, considers the minimum and maximum costs of beach nourishment. The feasibility of each beach nourishment options is considered though the cost-benefit analysis with the discount rate ranges from 6-10%. For the cost-benefits analysis of the project, this study assumed the project start by 2020 and will end by 2090 as the mean of future period, according to the Intergovernmental Panel on Climate Change. Total duration of 70 years of project is considered. This study also considers only the impact of sea level rise and set the beach nourishment project by 2080. Due to the lack of data availability, this study can only assumed one time beach nourishment by using the value from Figure 5.4 According to the results, when comparing to the tourism benefits, all the 16 of beach nourishment options could be considered as an adaptation measure to deal with the future sea level rise. The tourism benefits from the willing to pay to stay in the front of the beach of visitors (Model 3), the B/C ratio is over 10,000 in all of the beach nourishment in 16 options and in every coastal province. The beach nourishment project is possible for maintain the beach width of 10 m, 20 m and 30 m for every RCP scenario in those coastal provinces including the rural area of Trang, Satun and Pattani provinces by considering 10% of the rate of discount. In addition, the maps of tourism benefits for each province are conducted as well as the map of sand volume and required costs of beach nourishment and provincial cost-benefit ratio. The benefit generated by the study is subjected to the tourism service only. In practical work, the benefits of tourism and recreational benefits estimated through Hedonic Pricing Method can only be used as one of the beach services in which normally, the project management normally consider total economic value of the beach that may include many ecosystem services e.g., erosion control, wildlife preservation, or disaster prevention. This study shows that event only considering the tourism benefits, the sandy beaches are still worth to be nourished. The beach nourishment project required periodically replishment more than one time which is contrast to this assumption of the study. The future work may need to consider the other causes of beach erosion other than sea level rise such as storm-induced erosion, tides, etc. The costs of beach nourishment used in the study considers only one-time nourishment. The further analysis can
14
consider the multiple time beach nourishment, the wave condition effect on beach nourishment as well as the sensitivity of sand diameter size. Also, the results are subjected to some limitations but can be used as an overview and will be useful for decision makers to develop more feasible adaptations plan in Thailand. The beach nourishment may not be considered as the only adaptation measured to tackle with sea level rise. The other actions can be a setback, adopt hard structures, or even do nothing. The local coastal community and stakeholders should be deciding on this.
15
Chapter 6: CONCLUSIONS AND RECOMMENDATIONS
6.1 Conclusions
The study focuses on Climate Change that has and will impact Thailand’s coastal resources. Thailand beaches have already experienced erosion by both natural (e.g., storm surge) and anthropogenic drivers (e.g., shrimp farming, misplaced port construction). Due to insufficient data availability, it is hard to identify the factor that contributed to coastal erosion in Thailand. However, the evidence showing that the water level in along Thailand coastlines is experiencing the acceleration in which come to this study. Since Thailand coastal resources databased such as; beach dimensions, sand particle size, beach slope, measured wave data or even historical tide level records, are limited and spars, the study collected and provided the beach dimensions dataset as well as the data in grain size diameter and beach slope for all over Thailand, which can be useful for the future.
The first part of this study intended to project the future beach loss due to sea level rise in 2081-2100 relative to a reference period 1986-2005 for all Thailand’s sandy beaches in 51 coastal zones by using the Bruun model. The projected beach losses were based on ensemble mean regional relative sea level change evaluated from 21 Couple Model Intercomparison Project Phase 5 (CMIP5) for 4 representative concentration pathway (RCP) scenarios. The results indicated that beach loss rates in the future are projected to be 45% for RCP2.6, 55% for RCP4.5, 56% for RCP6.0, and 72% for RCP8.5. The uncertain by the sand particles accounted for 70%. The second parts of the study discuss the benefits of the beach, which are essential for the decision-making process in order to select the adaptation measure. Thailand beaches are well-known for the tourism destination according to the literature. Therefore it has significance enough to evaluate this kind of tourism benefits of the beaches. A hedonic model was employed to estimate the value of coastal resources in Thailand that capitalized into hotel price. The hotel room characteristics, location characteristic, coastal resources, and infrastructures attributes are contributed to the hotel room prices in all coastal sub-districts across Thailand. The results are provided a quantitative estimation on the economic effect of the proximity of the beach, beach access. The benefit from the front location yields around 29 billion USD annually which worth as 46.83% of Thailand total tourism revenue in 2018 and 6.38% of Thailand’s 2018 Gross Domestic Products. The highest bound of this study outnumbers many of literatures and the lowest bound are comparable to other study tourism/recreational benefits.
The final part of the study provides preliminary results of sand volume and costs required for beach nourishment for each coastal zone in Thailand for keeping beach width in present condition using Yoshida methods. The results rely on the assumption that filling sediment size is the same the native particles and indicated that it would require a minimum of 1,062 million USD (RCP2.6) to a maximum of 3,190 million USD (RCP8.5). In consideration of the highest benefit of the beach with the most substantial benefits with the largest budgets requirement of RCP8.5, it seems that the benefits of the beach may be sufficient order to be selected as Sea Level Rise Adaptations for some of the beach especially in the provinces with least number of annual visitors; none the less, it can be considered as one of the options for at least RCP2.6 in order to maintain the beach width of 10-m, 20-m, 30-m and at the present width condition
16
options. The costs benefits analysis suggested that the benefits estimated from this study can apply all the designed beach nourishment options with the highest rate of discount for tourism hot spot provinces and even the rural provinces.
In practical work, the benefits of tourism and recreational benefits estimated through Hedonic Pricing Method can only be used as one of the beach services in which normally, the project management normally consider total economic value of the beach. This study shows that event only considering the tourism benefits, the sandy beaches are still worth to be nourished. In reality, the beach nourishment project required periodically replishment more than one time which is contrast to this assumption of the study. The future work may need to consider the other causes of beach erosion other than sea level rise such as storm-induced erosion, tides, etc.
6.2 Recommendations
1) In the Bruun Model in this study, the sensitivity of the wave condition (i.e., wave height and wave periods) are not covers yet in this study. Since the wave has a significant effect on the depth of closure. This study relied on the reanalysis wave data, which may not reflect the true conditions of closure depth. Thus, the future research can address the uncertainty due to the sources of wave data on the projected sea level rise in Thailand.
2) Benefits of the beach presented in this study should be considered as the lowest bound of the total benefits of the beach. Since the beach provided so many ecosystem services (e.g., erosion control, wildlife preservation, or disaster prevention), further research can take account for this matter.
3) Since the annual benefits of the beach in this study depends on largely the annual visitors. It is better to localize the Hodonic model.
4) Using Yoshida method is the only one way to calculate the volume of beach nourishment. The design of beach nourishment, in reality, requires for chronicle replenishment with more wave data should be considered.
5) The beach nourishment may not be considered as the only adaptation measured to tackle with sea level rise. The other actions can be a setback, adopt hard structures, or even do nothing. The local coastal community and stakeholders should be deciding on this.