1
Long-term view of global energy stance
−Beyond the Shale Revolution−
Hiroyuki Okamoto, Ph.D.
Specially Appointed Professor
22nd Century Institute, Nagoya City University
1. Introduction
This thesis discusses the very long-term state of the world’s energy from a global perspective. We particularly focus on the Shale Revolution and its potential impact on the general long-term future of the energy situation. As discussed later, the Shale Revolution has not only reduced crude oil prices, but also will shortly affect international relations centered on the U.S.
What happened in the energy industry in 2015? First, delegates at COP21 (Paris conference) made some progress in the largest of existing problems, i.e., climate change. The next significant change was the large drop in crude oil prices, primarily owing to the Shale revolution, and a debate ensued on whether the impact of the Shale revolution would continue into the future. Furthermore, deceleration of the Chinese economy, the leading driver of the world’s economy over the past decade, and the consequent drop in China’s energy demands brought on a major debate on whether this trend will continue into the future. Here, we discuss how these events of 2015 will affect the state of energy in the long-term.
2. Fossil fuels and measures against climate change
(1) United Nations Framework Convention on Climate Change and COP21
The 21st United Nations Framework Convention on Climate Change (COP21) was held in Paris at the end of 2015. At this conference, there was a marked progress toward mitigating climate change. Eighteen years had passed since the COP3 conference in Kyoto in 1997. The Intergovernmental Panel on Climate Change (IPCC) reported that climate change has advanced during this period. The main cause of climate change is thought to be greenhouse gases, primarily carbon dioxide (CO2). Unless preventative measures are taken, the Earth is
2
per century. World governments reached a consensus agreement to limit this rise to 1.5°C by the end of this century1).
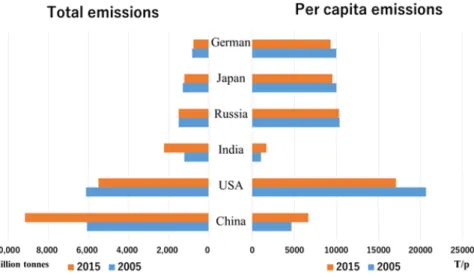
At present, China’s carbon dioxide (CO2) emissions are extremely high, as shown in the left
graph in Figure 1. In particular, China emits approximately 1.5 times more CO2 than the U.S,
and several times more than Japan. In 2005, China′s emissions approximately equaled those of the U.S., but the growth in China’s economy has been accompanied by increased energy consumption. Moreover, half of China’s total energy supply is sourced from coal, which has a high CO2 emission rate. However, the emission amount per capita remains low in China, being
approximately half that of Japan (see right graph of Figure 1). Therefore, China cannot be blamed for its huge contribution to greenhouse gases. Developing countries point out the hypocrisy of developed countries such as Japan, who have emitted large amounts of carbon dioxide (CO2) in the past but are now demanding that developing countries such as China and
India “suppress carbon dioxide (CO2).” This would seem to be a fair claim.
Figure 1 Carbon dioxide (CO2) Emissions by Major Countries 2005 vs 2015
Source:Prepared by the author based on Global Note (http://www.globalnote.jp/). The amount
of emitted carbon dioxide (CO2) was calculated from BP statistics using the international
standard conversion rate of the consumed amount of oil, petroleum, gas, and coal. (2) The COP21 Paris Agreement and Fossil Fuels
What was decided at COP21? Unlike the COP3 meeting at Kyoto, COP21 did not pursue stringent targets. Instead, each country was expected to declare a cutback target (to be reached
3
by 2030) and regularly analyze and inspect that target. This approach, known as the pledge &
review method, is quite political and the standard years vary among countries, as shown in
Table 1. Japan adopted 2013 as its standard year and declared that it will cut emissions by 26% in the next 20 years. In contrast, China’s target of 60%–65% seems high, but its cutback is expressed per GDP unit; thus, it is not a reduction in the absolute amount of carbon dioxide (CO2) emissions. However, each country has proposed innovative or wide-ranging approaches
to cutting emissions. In particular, the EU, whose climate change policies are far advanced, declared a future cutback of 40%. Despite these intentions, the transition from fossil fuels to renewable energy is not easy. The Kyoto Protocol was plagued with problems such as the departure of the U.S and the non-participation of developing countries such as China and India. In contrast, 196 countries and regions are participating in the Paris agreement2).
With the growing global interest in global warming, we can expect not only a reduction in emission amounts but also innovations such as the collection and storage of carbon dioxide (CO2). One such scheme is CCS (Carbon Dioxide Capture and Storage). The transformation of
coal into liquid or gas is also progressing.
3. Impact of the Shale Revolution
(1) Crude oil price crash
Among the 2015 changes in the energy industry, the drop in crude oil price is most notable. According to the energy industry’s BP Statistical Review of World Energy, June, 2016 (hereafter abbreviated to BP statistics), the crude oil price (WTI price)3) per barrelaveraged $95.04 in 2011, $94.13 in 2012, $97.99 in 2013, and $93.28 in 2014. In 2015, the average price halved to $48.71.
According to recent reports, Japan’s trade balance in January–June 2016 recorded a trade surplus owing to a greater decrease in imports compared with exports (surplus of 1 trillion 814
4
billion 200 million yen). This was the first time in the five years following the Great East Japan Earthquake that Japan marked a trade surplus4). This recovery is attributable to the growth of oil, petroleum, and natural gas for power generation after the suspension of nuclear power generation. During this period, the very high price of these commodities was halved while the yen remained strong. Initially, the Shale revolution lowered the price of natural gas and crude oil prices fell along with the gas prices, which had a follow on effect on coal prices. Therefore, the reduced import price of energy was entirely attributable to the Shale revolution.
Current crude oil prices are set by the market. The leading market is the WTI price, and crude oil has become an important financial instrument. Among macroeconomic factors, the biggest determining factor of price is the supply–demand balance, which behaves similarly to shares. As discussed later, the crude oil price was reduced by the excessive supply of shale gas and oil and petroleum prices in the U.S.5).
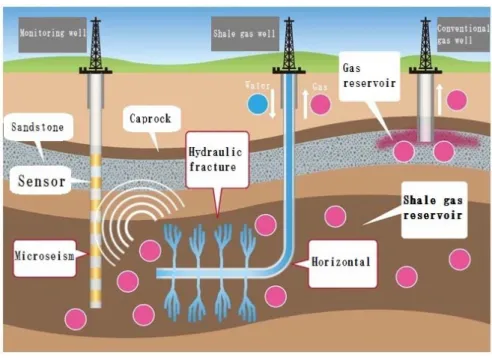
Previously, a perpendicular shaft would be drilled down until an oil or gas layer was reached at which point the resource would self-emerge as shown in Figure 2. The oil and natural gas spurt out and are collected. Conversely, shale gas and oil are collected from a shale rock layer called the shale stratum. Although shale rock is not typically seen in daily life, the inkstone used in East Asian calligraphic traditions is sourced from a particular type of hard, black shale, which is also known to contain small amounts of gaseous or liquid petroleum.
Figure 2 Mining from the Shale stratum
Source: Japan Oil, Gas and Minerals Corporation (JOGMEC) website. http://www.jogmec.go.jp/library/recommend_library_10_000102.html, 8/9
5 (2) Innovations in mining: the shale stratum
The mining of shale gas or oil and petroleum from hard shale rock was made commercially viable by two breakthroughs. First was an extraction method called fracturing (also known as hydraulic fracturing), which is considered to be very dangerous and is prohibited in European countries. The method is also strongly opposed in the U.S., but at depths of 2,000–3,000 m, the general viewed is that it is too deep for an artificial earthquake to have noticeable impacts. The other breakthrough was horizontal drilling, which is performed parallel to the ground. Typically, oil, petroleum, or natural gas is mined by dropping a shaft at a cost of several hundred million yen per shaft, however, the probability of success is low. Horizontal drilling can significantly increase the efficiency of mining by extending areal coverage. George Mitchell, who founded Mitchell Energy Company, developed a method for extracting natural gas from shale, previously thought to be commercially impossible. The application of fracturing in 1998 revolutionized shale gas extraction. Whereas many pioneers spend unfortunate late lives, Mitchell set up business at sixty and extracted shale gas by his unique method. He retired in his eighties and died in 2013, at the age of 94. Devon Energy Company, who purchased Mitchell Energy Company in 2002 for 2.2 billion dollars, increased the amount of production per shaft by combining hydraulic fracturing with a horizontal drilling method6). (3) Victory of Enterprising Spirit and Innovation
Now, we will discuss perspectives on the shale revolution. A few years ago, the shale gas revolution was expected to be short-lived. More likely, the revolution will continue into the future and largely affect the state of future oil, petroleum and natural gas. In this sense, the shale revolution represents a “victory of innovation and entrepreneurship”; in other words, a successful innovation. The economist Schumpeter (1883–1950) discussed new combinations in terms of new product development, new production methods and new sales channels, and in this light, new production methods are certainly innovations7). This means that throughout its 150-year history, the prevailing theory was that oil, petroleum and natural gas industry would see no innovations and that the conventional method was thought to be the limit. Yet, we have seen the trump card of innovation herald a new era. Though innovations in oil, petroleum and natural gas are not guaranteed in the near future, I would like to emphasize that very possibility. Schumpeter’s theory posits that such innovations require investors, as well as followers and applied technologies that implement these innovations. The appearance or retreat of capital providers that underwrite the profitability of this innovation can promote or dwindle the production of shale oil and petroleum. Moreover, the continuation of the shale revolution will largely depend on the existence of followers.
6
Whether the shale revolution actually warrants the title of ‘revolution’ is a judgement reserved for future historians, but its innovative significance is multifaceted. First is the decline of the peak oil theory. Another important point is that, as a result of the Shale revolution, the U.S. will shortly become an self-sufficient country in terms of energy. Although some scholars appropriately view both G2 countries (China and the U.S.) as the two major powers, the U.S. is self-sufficient in both food and energy. In contrast to China, who can neither provide sufficient energy or food to supply itself, the US can be expected to exert significant advantages.
(4) The end of Pax Americana
A point of historical significance is that many view Pax Americana that lasted 70 years since the end of World War II is now approaching its finale. This is consequent to the self-sufficiency of the US, which will in turn, diminish its presence in the Middle East. If no imports are required from the Middle East, the US will remove itself from the region. In particular, the rapprochement between U.S. and Iran reached by President Obama and recent perspectives from Mr. Trump indicate that the US is receding from the Middle East to a certain extent. I would like to indicate here that shale gas has even triggered this possible end to the Pax Americana.
Comments such as “nowadays the appearance of hydraulic fracturing which enabled the development of shale resources reduced the direct dependency on U.S. Gulf oil and petroleum as well as its strategic value and Washington’s view of placing importance on Saudi Arabia and small countries in the Gulf has been made more democratic8),” are appearing in specialist magazines on U.S. foreign diplomacy.
(5) Decline of the peak oil theory
What exactly is the peak oil theory? The peak oil theory predicts that underground sources of petroleum and natural gas will deplete and eventually be exhausted. Some peak oil theories have predicted that if consumption continues at its present rate and no new oil or gas fields are discovered, extraction would have peaked in 2004 and would decline thereafter (see Figure 3). Petroleum can be mined but as supplies dry up in the Middle East, Europe, and the U.S., the reserves will irreversibly decline.
However, the continuing discovery of shale gas, oil, and petroleum is extremely important because the peak oil theory has largely driven crude oil price. Until three years ago, oil, petroleum and natural gas supplies were expected to be exhausted and the crude oil price was
7
approximately $100 per barrel partially based on this theory. Furthermore, this theory was the theoretical pillar for promoting renewable energy and nuclear power generation. Therefore, the lowering of the crude oil price by the shale revolution is a significant event.
Figure 3 Peak Oil Theory
Source: The Coming Global Oil Crisis website,
http://www.oilcrisis.com/campbell/images/2004Scenario.jpg, 8/22
At the end of 2015, we estimated that mining could continue for a further 50.7 years for oil and petroleum, 52.8 years for natural gas and 114 years for coal. To calculate the number of remaining years for mining, we divided the current reserves by the amount produced per year, and assumed that production approximately equaled consumption. In the absence of new discoveries, the total proved reserves would last for 50.7 years. However if the shale natural gas produces an amount equivalent to the annual consumption, at the end of the year, the 50.7 year span will be carried over and so there will still be another 50.7 years remaining.
Therefore, the projection is that fossil fuels may last for another 100 years. By this time, the abovementioned innovations are almost certain to occur. Necessity is said to be the mother of all invention. As oil, petroleum and natural gas reserves approach depletion, the financial pressure of rising prices would justify massive investments and drive some sort of breakthrough.
Why did the crude oil price fall from $120 per barrel to its present day value? The answer might lie in the standoff between the U.S. and Saudi Arabia, neither of which has reduced their oil production. The high price of $120 had been largely maintained by production adjustments by Saudi Arabia and other OPEC countries. Saudi Arabia is often referred to as a swing
8
producer; that is, it matches any crude oil excess with reduced production in its own country to prevent a price crash. However, if Saudi Arabia reduces production and the US covers that shortfall, this would only mean a loss of market share for Saudi Arabia and market gains for the US, resulting in an excessive show of generosity. As the main player in the Middle East and the leader of OPEC, Saudi Arabia had been extremely generous to the US in the past. However, Saudi Arabia has recently ceased its role as swing producer and has started producing freely rather than pandering to the US, thereby dissolving the unity of OPEC nations. This dynamic was the largest contributor to the decline in crude oil prices.
As mentioned above, the oil price approximately halved from its fairly stable value of $100–120 to $60 per barrel in the summer of 2014. Today’s papers report the price as just over $40 per barrel. Exploitation of shale gas began around 2005, but when production volumes became obvious, the 2014 OPEC general meeting fell to shambles and prices plummeted.
So, what is happening in the market currently? Three countries each producing an excess of 10 million barrels of oil per day are called the Big 3. The daily outputs of the five biggest producers of oil and petroleum are plotted in Figure 4. Although the Big 3 (Saudi Arabia, Russia, and the U.S.) had been competing at approximately 10 million barrels per day, U.S. production had been falling until 2005, when it began exploiting shale oil and petroleum. Shale oil production in the U.S. increased on a yearly basis, accelerating by a million, then two million, then three million, and finally overtaking Saudi Arabia in 2014 as the world’s leading oil producer. 2015 saw the US grow leaps and bounds. Saudi Arabia and Russia are the second and third largest producers respectively. There is a considerable gap between the Big 3 and China and Canada in fourth and fifth place, respectively. We can reasonably state that the Big 3 will shape the future state of oil and petroleum.
And how about natural gas? The top five producing countries of this resource are plotted in Figure 5. Russia and the U.S had competed neck to neck for the top spot over the past 20 years. Although Russia produced more natural gas than the U.S. in some years, Russia plateaued while the U.S. increased its shale gas production from 2005 onward, finally overtaking Russia.
Although the fate of shale gas and oil and petroleum is important, currently, it is only mined in the US. Future innovations could unlock the many reserves around the world, initiating new and commercially viable mining activity globally.
The U.S. Shale revolution has largely affected the petrochemical industry. Ethane, a precursor of the fundamental chemical product ethylene, is a component of naphtha (crude gasoline) and natural gas. With the increasing natural gas production and subsequent fall in prices, US petrochemical industries have become more competitive.
9
Figure 4 Production amounts of major oil and petroleum producing countries (1995– 2015)
Source: Produced by author from BP Statistical Review of World Energy, 2016
Figure 5 Production amounts of major natural gas producing countries (1995–2015)
Reproduced from BP Statistical Review of World Energy, 2016
4. Prospects of energy demands
(1) Increase in energy consumption
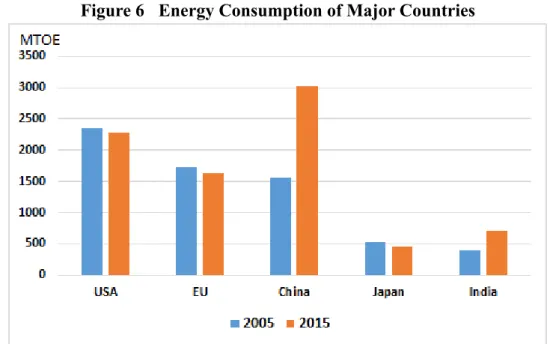
What is the future of energy consumption? The top five energy-consuming regions worldwide constitute four countries and one region, namely, US, China, EU, Japan, and India. Collectively, these five regions consume two- thirds of the world’s energy. Characteristically,
10
China’s energy consumption has rapidly increased over the past decade, and China has overtaken the US as the largest consumer. As clarified in Figure 6, while energy consumption in the US, EU, and Japan have slightly declined between 2005 and 2015, China and India increased consumption by approximately 100% and 50%, respectively.
Figure 6 Energy Consumption of Major Countries
Reproduced from BP Statistical Review of World Energy, 2016
(2) Changes in energy sources
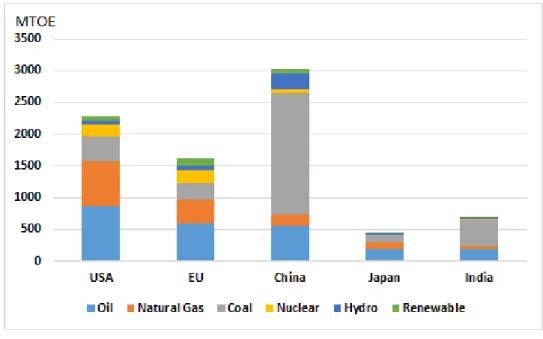
We now investigate the changing energy sources of the world’s largest consumers. As shown in Figure 7, China sources its energy from oil, petroleum, natural gas, coal, hydro, nuclear, and renewable sources but overwhelmingly from coal. In terms of calories, the carbon dioxide (CO2) emissions from coal are very high. To reduce these emissions, China could simply convert coal into oil petroleum or natural gas. India also sources most of its energy from coal.
In 2015, China consumed 22.9% of the world’s energy and approximately 50% of the world’s total coal. China’s coal and energy consumption will probably slightly increase in the near future, so China should eventually consume around a quarter of the world’s total energy. However, China’s energy consumption grew by only 1.5% over the past year, down from 3%– 5% a few years ago. The current energy growth rate in China has considerably decreased from its previous levels, deserving its new alias dubbed the “New Normal”.
11
Figure 7 Energy consumption of major countries in 2015
Reproduced from BP Statistical Review of World Energy, 2016
(3) Energy GDP elasticity
In estimating the future of energy, we must consider the population and GDP dynamics. Throughout the past few decades, the increasing energy consumption has been correlated with increasing population and GDP. However, as indicated by many specialists, both population growth and GDP have slowed in OECD countries. Moreover, there is now a slight negative correlation between GDP growth and energy consumption in OECD countries owing to their investment in energy saving technologies.
In contrast, the populations and GDPs of non-OECD countries such as China, Africa, India and the Middle East, the ASEAN countries, and Latin America are expected to increase. In particular, the GDP of India is currently around one-third that of China’s, but India’s energy consumption is expected to grow significantly as the population increases. Currently, India consumes 3.6 million barrels of oil per day; this consumption is expected to double in the next decade. Meanwhile, China’s economic growth rate will probably slow. In 2014, the purchasing power price (PPP) of China exceeded that of the US, and the global weight of China’s GDP will certainly increase. However, the natural growth rate of GDP depends less on the total population than the productive age population (16–59 year olds). Japan’s extremely low economic growth, referred to as the “lost twenty years” has been attributed to the country’s
12
declining population in productive age brackets. Although China will continue with policies such as “belts and roads” to emphasize capital investments, it faces a decline in its productive population and China’s high growth over the past twenty years cannot be expected in the long-term.
In estimating energy demands, we must understand the energy elasticity response to GDP. The energy elasticity quantifies the growth in energy per unit growth in GDP. For example, if the GDP grows by 10%/y and energy by 6%/y, the energy elasticity is 0.6. Ten or twenty years ago, Japan’s GDP and energy grew at approximately equal rates; that is, when the GDP increased by 5%/y, the energy also increased by 5%/y. However, the energy elasticity has recently fallen, as the energy has grown by only 2%/y, whereas GDP growth remains at 5%/y. This trend in Japan reflects the gradual shift from energy intensive smoke-stack industries to tertiary industries. Furthermore, OECD countries have recently reduced their energy consumptions while growing their GDPs, through energy source switching, energy saving, and power saving.
The rate of distribution of motor vehicles is also important in estimating energy demands. Most of the gasoline in the US is poured into motor vehicles. In 2015, there were 900 vehicles per 1,000 people in the U.S (almost one vehicle per person). In Japan ,the vehicle ownership is 600 vehicles per 1000 people, while China’s ownership will undoubtedly grow in future. The same trend is expected in India. Consequently, gasoline and diesel consumption is expected to increase in both China and India9).
(4) The future of renewable energy
Renewable energy such as solar power, wind power generation, geothermal generation, and biomass are purely domestic energy sources. Therefore, countries utilizing these CO2 free energy sources also increase their energy self-sufficiency. In 2015, Japan introduced a feed-in-tariff (FIT) system that has increased renewables with a focus on solar power generation (PV).
The image below shows a 4 KW solar power generator installed in the author’s home as shown in Figure 8. This generator was constructed 20 years ago at a cost of 4 million yen, but could not recoup its costs by selling electricity. Now, the power generated during the day (minus the home consumption) can be sold to TEPCO, and capital investment can now be recovered at a rate of 42 yen per kWh paid each month through the FIT.
13
assisted by governments (Japan’s FIT being a case in point). Such dependency on governmental assistance bring to question its future viability. Wind and solar power generation is expanding rapidly around the world. These technologies have been up-scaled in recent years and this trend is expected to continue into the future. The future of these energy sources will depend largely on innovative applications of new technologies and reduction in set-up costs. The EU intends to increase its current renewable energy supply (approximately 15% of the total electricity supply) to 30% in the near future. The proportion of renewable energy sources is small in Japan, US and China, but increases to 10%–15% are planned for the future. China’s recent efforts regarding climate change are commendable. Moreover, the U.S. is making proactive efforts to increase prevalence of renewable energy sources in view of the ratification of COP21.
At present, oil and petroleum constitutes the highest proportion of the world’s energy supply, followed by coal and natural gas. Twenty years hence, these sources may each constitute 25% of the global energy supply, with the remaining 25% comprising hydropower, nuclear generation, and renewable energy sources. However, renewable energy will grow faster than other sources, reaching approximately 10% of the global energy supply.
Figure 8 An example of solar power generation (PV) set-up
Photographed by the author
14
5. Conclusion
Looking at the long-term outlook of the energy situation, the first consideration is the price movement, which affects demand. The price of energy depends on the availability of fossil fuels and is competitive. Central to this competition is crude oil price, which is largely affected by the cost of mining shale crude oil. In the early part of 2014, prior to the fall in the crude oil market, the cost per barrel exceeded $60. Owing to innovations, the production cost of shale oil and petroleum has dramatically reduced in just two years.
To a first approximation, the future trends of energy demands can be estimated from the dynamics of the top five energy-consuming regions, which collectively consume two-thirds of the world’s energy. The US will reduce consumption slightly, while the EU will go to greater lengths to achieve significant reductions. China doubled its usage from 2005 to 2015 but its projected future growth is approximately 2% per annum, thereby marking 20% growth in the next decade. Japan will marginally reduce consumption. India’s consumption will probably continue its current trend of 5% per year, reaching around 1.5 times the current level. The other regions – ASEAN countries, Africa, the Middle East, and Latin America – will increase consumption by a few percent.
Finally, how will the supply countries alter over the next decade? The supply of oil, petroleum and natural gas has stabilized since the exploitation of shale gas10). However, as coal is a cheap commodity, its demands should grow slightly. The future of nuclear power is open to discussion, but the global growth rate of nuclear power is forecast to be very low. Renewable energy will probably grow by several percent each year.
Energy consumption will reduce in all OECD countries but will grow in non-OECD countries such as China as shown in Figure 9. However, as already mentioned, the annual growth will be at most 3% to 4% and we are not likely to see growth rates of 5% to 8% growth seen in the past decade. From a pricing perspective, if the crude oil price exceeds $60 per barrel, shale gas and oil will rise dramatically and serve to maintain a $60 cap on crude oil price. Moreover, coal prices are likely to remain low owing to further promotion of CO2 emission reduction measures.
Although the investment power of hedge funds based on “geopolitical reasons” may temporarily raise crude oil prices, this high value is unlikely to be maintained in the post peak oil world. Shale gas and oil, petroleum will likely continue their growth into the future. Therefore, the long-term relationship between energy prices and demand will remain stable, despite short-term turbulences. Energy, often referred to as the “life-blood” of the economy, should therefore contribute stably to the long-term development of the global economy.
15
Figure 9 Estimated energy consumption in the past, present and future
Reproduced from BP Statistical Review of World Energy, 2016
Footnotes
1)
The Intergovernmental Panel on Climate Change is an organization established in 1988 by the United Nations Environmental Programme (UNEP) and the World Meteorological Organization (WMO). Its aim is to actively evaluate the effect of human activity on climate change and related matters. Since its inception, it has evaluated new knowledge obtained from scientific research on climate change every 5–6 years and has published that knowledge as assessment reports. The first, second, and third assessment reports were released in 1990, 1995, and 2001, respectively. The fourth assessment report (AR4) was approved at the 27th IPCC meeting in 2007. The report of the first working group (the physical science basis) for the nascent fifth assessment report was compiled in September 2013.
The fifth assessment report builds on the fourth assessment report in 2007, which found that the probability of global warming being human-induced was “greater than 90 %.” In the fifth report, the accumulated CO2 emission amount is estimated to be virtually proportional to the increase in global average air temperature (new outlook). The IPCC consistently reports carbon dioxide (CO2) as the main driver of climate change (“The Carbon Dioxide Theory of Climate Change”).
However, the “Carbon Dioxide Theory of Climate Change” has been criticized from many angles. Climate skepticism can be divided into those that state the earth is not warming and those that state that although the earth is warming, the driving factor is not increased concentration of greenhouse gases. In the latter theories, climate change is induced by solar activities, impacting cosmic rays, geological activity within the earth or magnetic field
16
activities for example, see Yu Fukai “The Earth is no longer warming: Big turning point of )
science and politics” Heibonsha, 2015 . However, climate skeptics remain a minority argument in Japan.
2)
“COP21 Commences, Will it reach consensus on global warming prevention?”“The Nikkei” December 7, 2015
3)
The three great markets of oil and petroleum (North America, Europe, and Asia) all have a futures market. The futures market largely influences the spot market and determines the standard crude oil price, which defines the formal price on the term contracts. The retail price of crude oil is then determined by making slight adjustments to the standard crude oil price for each oil type. The standard crude oil price is the average price of three types of crude oil assessed by Platts (industry journal) in the WTI commodities market, and by Argus industry (
)
journal in North America. Europe uses the Brent Weighted Average in the online futures trading market, which is operated by a company called ICE (Intercontinental Exchange). In Asia, including Japan, the standard price is the monthly average price of crude oil price in Oman (assessed by Platts) and Dubai (assessed in Singapore). Consequently, the import price of Japan’s crude oil is not determined until the following month.
4)
“Reduction Plummets in First Half Exports, Volume Finds Seeds of Recovery” “The Nikkei” July 26, 2016
5)
The deciding factors of crude oil price have been widely researched. The dominant deciding factors are supply–demand balance, financial factors, and the so-called “geopolitical factors”. Financial factors include QE1, QE2, QE3 in the U.S. and Japan’s monetary easing. Geopolitical factors include conflict in the Middle East and tensions in international relations. The main parties in the crude oil market are traders. Similar to shares, crude oil is a financial product and investors are institutional investors such as hedge funds, seeking profit by chasing the price fluctuations. Thus, speculation is a sizable element in this factor. Supply and demand reports on the IEA, EIA, and OPEC are compiled by “experts.” For example, a report released on September 11, 2015 by the American investment bank Goldman Sachs estimated a downwardly adjusted $45 per barrel for the average crude oil price in 2016, dropping to $20 unless the world’s crude oil production declines. In fact, the price dropped to $26.19 on January 20, 2016. Conversely, Goldman Sachs estimated a rise in crude oil price to $200 per barrel within two years of May 2008. At that time, Goldman Sachs was known for having correctly predicted the crude oil price of $100 per barrel three years prior to the event.
6)
17
a new technology is followed by other technologies. Initially, all mining was vertical and the gas released by hydraulic fracturing of the shale stratum was collected in the mine head. In the subsequent technique of “horizontal (mining),” several mineheads can be installed on one shale stratum, increasing the amount of gas that can be collected from a single shunt. Furthermore, a new technology called “the microseismic method” finds the optimal mining location. This method has proved useful for optimizing the intervals between several horizontal drilling layers close to the site of the hydraulic fracturing, hence improving the efficiency of
(
mining Noboru Iwase “Solving the mystery of crude oil crash” Bunshu Shinsho 2016 See p.232-233 )
7)
Schumpeter, J. A., Theorie der wirtschaftlichen Entwicklung, 1912 Translation by Yuichi ( Shionotani, Ichiro Nakayama and Seiichi Higashibatake “Theory of economic development A research relating to cycle of economy and entrepreneurial profit, capital, credit and interest”,
) Iwanami Publishing, 1937
(
Schumpeter’s “neue Kombination” theory “innovation” theory in the English version ) was adopted by the economist Peter Drucker, who famously said, “the aim of enterprise is the creation of clients and fundamental business activities are marketing and innovation.” Schumpeter’s theory had been posited 100 years earlier but its economical meaning remained underappreciated. Today, the theory has been revived in the bestseller “Dilemma of Innovation” by Clayton Christensen, published in 1997. The September 2016 edition of the Harvard
Business Review published “Special dilemma of innovation: Breaking away from the
accelerating threat”. Christensen‘s thesis “Disruptive innovation”, published in 1995, borrowed the words “disruptive innovation” coined by Schumpeter in “Capitalism, socialism and democracy”.
8)
Simon, Steven and Jonathan Stevenson, “The End of Pax Americana” Foreign Affairs
Report, Dec. 2015, Japanese edition “The End of Pax Americana – Constructive retreat from
the Middle East” “Foreign Affairs” December 2015 edition
9)
Per 1000 people, the rate of distribution of passenger vehicles in 2014 was 378 vehicles in the U.S., 478 in Japan, 314 in Korea, 85 in China and 17 in India. However, the penetration rate of commercial vehicles per 1000 people is 429 vehicles in the U.S., 130 in Japan, 87 in Korea, 19 in China and 5 in India. Depending on the collection method of the statistics, the distinction between passenger and commercial vehicles may differ among countries. Summing the passenger and commercial vehicle distribution rates per 1000 people, we obtain 807 vehicles in the U.S., 608 in Japan, 371 in Korea, 104 in China, and 22 in India. Moreover, “motor vehicles” includes buses, trucks, light vehicles, and other registered four-wheeled vehicles but excludes two-wheeled vehicles, March 23, 2016 announcement by the International Organization of
18 Motor Vehicle Manufacturers).
10 )
Shale oil mining is emerging outside of the US as well. For example, shale oil in Argentina is being developed by Chevron and Royal Dutch Shell as well as by YPF, the national petroleum and natural gas Company (Rim Energy News, September 10, 2015).
Bibliography
・Noboru Iwase “Solving the mystery of crude oil crash” Bunshun Shinsho 2016
・Takashi Oyama Author/editor “Shale Revolution” Reverification – how do we see it? Oil price crash” Energy forum
2015
・Tsutomu Toichi “Revised edition Shale revolution and Japan’s energy – reverse oil shock attack” Denki Shimbun Books Shinsho 2015
・Taka Nishiyama “Resource theory Metal and oil, petroleum reserves achievement and depletion” Maruzen Publishing 2016
・Kazuhiko Fuji “The world changed by the crude oil crash” The Nikkei Publishing 2015 ・Edited by the Mizuho Institute for General Research “Severe Quake and Cheap Crude Oil
Economy” The Nikkei Publishing 2015
Correspondence to: Hiroyuki Okamoto, Ph.D. 22nd Century Institute, Nagoya City University
1 Kawasumi, Mizuho-cho, Mizuho-ku, Nagoya, Aichi 467-8601 JAPAN
e-mail: okamoto.hiroyuki @ nihon-u.ac.jp (remove space characters when using)