[at
rt]
VDe:624.072.012
Journal
ofStructural
andConstructlon
Engineering
(Transactions
ofAIJ)
No.
372,
Febiua[y,
1987
H"nR\amsvakitNWzaes
rg
372
e・waza
G2
fi2fi
THE
BEHAVIOUR
OF
BEAMS
IN
REINFORCED
CONCRETE
FRAMES
UNDER
THE
COMBINED
ACTION
OF
VERTICAL
AND
HORIZONTAL
LOADINGS
by
S.
M.
PARVEZ
MOHIT'
and
TAKAYUKI
SHIMAZU",
Members
of
A.
I.
J.
1.
Introduction
The
philosophy
of structu[aldesign
of weak-beam, st[ong-columntype
offrames
has
been
widelyadopted
for
aseismic
design
of reinforced concretebuildings
during
the
latest
decade.
Little
informations
have,
howeveT,
been
obtained
on
the
combined effectsof
working verticalload
and cyclichorizontal
inertia
force
on suchtype
offrames,
though
someinvestigations
withoutthe
definite
philosophy
of suchtype
ofductile
frames,
have
been
reported'}h4],Experimentai
studyis
being
continued'in
ourlaboratory
to
have
the
variousinformations
concerningthe
behaviours
ef
suchtype
offrames
both
during
and afterearthquakes.Two
ofthe
studytesults
have
been
presented
in
Ref.
s
and6
onthe
verticalload
carrying capacity ofbeams
in
reinforced concreteframes
withthe
experience of reversedhorizontal
loading
and enthe
stability ofthe
columns ofmulti-storyframes
withthe
experience ofhorizental
loading
respectively.When
a weak-bearn, strong-columntype
of reinforced concreteframe
is
subjectedto
a series of reversedhorizontal
loading
cycles
along
with apreviously
applied
constant working veTticalload
onits
beams,
the
two
extreme ends ofthe
beams
gradually
lose
their
rotational stiffness.The
beams
then
graduaily
turn
to
behave
like
simply supportedones,
by
decreasing
the
fixed
end moments and alsoby
increasing
the
beam
center moment.These
phenomena
resultinto
the
gradual
increase
ofthe
verticaldeflectign
along withthe
beam
during
the
reversedhorizental
loading.
Now
the
practical
problems
that
may arisedue
to
this
increase
of verticaldeflection
along withthe
beam,
areto
have
to
usean
uneven
and
deflected
face
of
floors
and
roofs,causing
ponding
of
wateron
roofs which may resultin
acceleratecldeterioration.
And
alsofoi
instance,
the
door
and windowpanels
may notbe
closed or openedproperly
during
emergencyetc.7).
The
possiblity
of
these
phenomena
maybe
overcomeby
providing
enough shear wallsfor
the
buildings
to
reducethe
maximuminterstroy
deflection
during
reversedhorizontal
loading.
There
are some research examples ofbehaviour
ofbeams
in
frames
under combined action of yertical andhorizontal
loading.
Ernst'}
rep6rtedthat
the
midspandeflection
ofbeams
we[eincreased
by
70
%
to
l40
%
afterthe
first
yield
of acritical sectionin
reinforced concreteportal
frame
specirnens, subjectedto
working vertical as well as cycLiclateral
loads.
Yamada
S)found
alsothe
gradual
increase
of verticaldeflection
along steel-concrete compositebeams
subjectedto
alternately repeated cyclicloading
withincremental
deformation
amplitude uncler constant verticalload.
Though
the
structures
tested
by
him
were steelportal
frames,
the
slabs
which werebeing
sustainedby
the
steelbeams,
were macle of reinforced concrete.The
aspect ofthis
paper
is
to
observeboth
analytically and expeTimentallythe
behaviour
ofbeams
in
reinforced concreteframes
underthe
combined action of vertical andhorizontal
loadings.
In
particular,
focus
is
placed
onthe
continuous
progress
of
the
verticaldeflection
alongthe
length
ofthe
beams
during
reversedhorizontal
loading
cycles, with working verticalload
on
the
bearns
applied.The
verticalload
carrying capacity ofthese
beams
withthe
experience
of
horizontal
loading
is
also
verified5).The
abstract
ofthis
papeT
was already reportedin
Ref.
9
and10.
First
asymplified
analyticalmodel,
whichhas
been
developed
te
explainthe
phenomena
ofthe
above mentioned continuousprogress
ofthe
verticaldeflection
ofthe
beams,
is
presented.
'
Giaduate
Student,
University
efHiroshima,
Mr,
ofEng,
i'
Professor,
University
ofHiroshima,
Dr.
ofEng,
{Manuscript
recelvedMay
15,19S6)2.
Derivation
of
Analytjcat
Model
,
An
analyticalprocedure
is
developed
to
suitthe
experimental
studyto
be
described
in
the
following
chapters,
which
deals
with aseries
of statically onedegree
indeterminate,
single-bay,
single-story
Teinforcedconcrete
frames,
'
'
with
twe
mechanical,hinges
atthe
bottoms
of
their
both
columns.
,
,
Based
onthe
following
assumptions,the
verticaldeflection
ofbeam
center under combinedhorizontal
and verticalloading
is
going
to
be
calculated.O
The
basic
assumptionsbeing
consideredare,
(a)
a'plane section of any member remainsplane
at any stageofloading,
(b)
there
does
not
also
occur
any
shear
deformation
of
joints,
and
(c)
the
members
are axiaLly rigid.2)
The
members ofthe
frames
aredevided
transversely
into
desired
nurnbers,toform
alinear
meshof
finite
elements, which are connected
to
each other ontheir
both
ends as shownin
Fig.
1
for
the
model specimen, which wasdivided
at aninterval
of
1
cm,The
bending
moment, curvature,deformatio,n
etc.along
the
entirelength
of an element willtake
the
correspqnding yalues obtainedforits
center.The
loads
may onlybe
applied・at
the
centers ofthe
'
elementsii)
,
,
t
.
t
'
3)
The
tri-linear
rnoment-curvature(M-di)
relationsfor
the
segtions ofthe
elements ofthe
membersfor
variousaxial
force
levels,
N
maybe
obtainedby
the
rnethod as explainedin
Ref.
5.
To
suitthe
experimental
study,for
the
beams,
the
portion
between
the
crack andthe
yield
moments ofthese
curves,maybe
taken
to,be
representedby
,the
straight
line
joining
the
crackingpoint,
correspondingto
the
axialfor
¢e Tesultingfrom
the
effect ofthe
working vertiealload,
andthe
yield
point
correspondingto
the
maximum axialforce
developed
in
the
beam
whenit
yields
underthe
combihedloadifigsi.
On
the
otheTtiand,
for
the
columns,it
maybe
done
by
joining
the
cracking andyield
points
cor[espondingto
the
minimum andthe
maximum axialforce
which occurin
the
columns underthe
combinedloadings,
The
effect ofthe
slipping-outof
the
tensile
reinforcernent maybe
consideredby
increasing
the
yield
values of cuTvature, whiChis
calculatedfrom
that
given
in
the
R.C.
Code
of
AIJ
for
the
corre.sponding valuesof
rotations.
Fig
2
showsthe
wayhow
to
determine
these
yield
curyaturesfrom
the
correspondingyield
rotations.The
value o.f a.in
Fig.2
(c)
takes
the
form,
R.IR.=a.=CO.043+1.64np,+O.043alD+O.33
thXd/D)!'Z).
In
this
study,this
effecthas
been・considered
for
the
beams
only.For
the
relatively.strong columns, which arebeing
usedin
the
experimental
study,it
has
been
checked
analyticallythat
there
arealmost no
effects
on
the
responses, +p pwhether
the
slipping-out effects ofthe'
tensile
reinforcement of columns are considered or not.Thus
the
calcu-lated
moment-curvature relationsfor
k"-
・,
different
members are shownin
.
i
Fig.3,
for
the
specimens ofF'ig
g.
Fig.1
Discretization
ofFrame
Structufe
4)
Fig.4
showsthe
degrading
stiffness
properties,
consideredto
trace
the
paths
in
the
M-ip
cllagram
for
the
cyclicloadings.
To
trace
the
6urves
for
the
Ioading
portions,
it
is
assumed
that
eitherit
aimstowards
the
experienced maximum moment-cttrvaturepoint,
orjust
traces
onthe
envelope curve.
For'
the
unloadingportions,
whenthe
experiencedmax-imum
moment
lies
between
the
crack
and
the
yield
moments,it
traces
such
that
the
residual, curvature wouldbe
aboutthe
one-third ofthe
difference
b'G
also6o7esowtzg,
wtz1S 1802Dl P-.tT
40io20le'1 1 Hinge 1'
Ulng. 1020oqlfy
-
(a)
--tw---
---
Ry
)Wig
M
1by
Nt '''i' ''J''
'
'
'
'--tt
t
tt
tt
tt
.a'
.・・K
tZ/'..t
.t..;tl
i
..:
1
tt
1・l
/
i
1..
I
ltt 1 li.']
lt'i":
lt
l
d 1 11
/ / 1./
d t / d%
(b)
F.'ig.2
Dete[minatien
efYleld
Cutvature,
Censidering
Slipping-out
ofTensile
Reiriforcement
.R{e)t,he
Effects
Rydue
to the-73-between
the
crackingcurvature
andthe
ever experienced maximum curvature7).Thus
obtainingthe
curvatures atthe
centers
of
the
elements
alongthe
length
of
the
members,the
rnember
deflections
can
be
calculated.
5)
Under
reversedhorizontal
load,
for'
higher
ampli-tudes,
the
bending
moments
at
different
critical
sectiens
of
the
beam
reachtheir
yielding
yalues,resulting
in
the
fermation
ef
yield
hinges.
These
yield
hinges
are
formed
alternately
at
tlte
both
end
sectionsof
the
beam.
It
maybe
consideredthat
there
occurs aflow
of curvaturesin
these
regions over a certain
length
alongthe
beam
axis,For
simplicity of calculation,for
th{s
study,this
length
ofthe
yield
hinges
was consideredto
be
{d.l2+db)
whichis
aIittle
medifiedform
ofthat
reportedin
Ref.
5.
Table
1
showsthe
valuesof
the
yield
hinge
length,
proposed
by
different
authors,
calculatedfor
the
model specimensbeing
usedin
the
experimental
studyi3).
After
yielding
of
these
sections,
the
plastic
curvatufese.,
constant overthese
lengths,
areadded
to
the
curvature
distributions
of
the
elements
in
these
regions,
at
the
starting
of
yielding
of
those
critical
sectionsfoT
any
instants
of
loadings.
Then
the
added
plastic
curvatures
remain
active aslong
as
the
bending
moments ofthe
respective
elements
do
not
change
their
signs.
6)
For
the
staticallyindeterminate
structures,
the
values ofbending
momentfor
the
elements
alongthe
members maybe
calculatedby
consideringthe
geometrical
compatibilities ofthe
frames.
In
this
studythe
only onegeometrical
compatibilityis
to
be
consideredfor
the
onedegree
indeterminate
structures, which wasdone
in
such a waythat
the
vertical
deflection
of
the
beam-column
joint
of
the
right
columnbecomes
zero.Also
the
magnitude ofthe
plastic
curvatures
along
the
yield
hinge
length
maybe
calculatedin
the
same
wayto
fulfill
the
geemetrical
compatibility,
providiing
that
the
bending
moment atthat
critical sectiontakes
its
yield
value.7)
The
qualitative
deflected
shapes ofthe
modelspeci-men at
the
peak
and atthe
end ofthe
positive
horizontal
loading
cycle aregiyen
in
Fig.
s
(a)
ands
(b)
respectively.From
the
georuetry
ofthese
fignres
the
following
equations canbe
reducedfor
both
the
cases, withthe
sign ofe
taken
clockwise.
of,-:ie'・-IL-・-・・・--・--・--・・-・--・・-・・・・・-・・-・--・a)
a,,=(-e
±e'-e")・
!・・・-・・-・・・-・-・--・・-・・・-・・-・・・・(2)e,,=={R-e)・{L・-・・・-・・-・・・-・・--・・-・・・-・・-・・・・・・-・・{3)
6t,=(R-e")・e-・・-・--・・-・-・---・-・・・-・・-・・・・・・<4)
(t
o
Fig.3
1h-¢Calculated
2
3(xlO'"an-i)
Moment-Curvature
4Relations
..T
F.-!eL..
:
n-"-'---i::::
thet"
1.'
ll
¢e'o"- ¢)Fig.4
Table1
Degracling
Stiffness
Properties
ofMoment-Curvature
Relatiofis
for
Analvtieal
Modet
The
CornpaTison
ofEquivalent
Yield
Hinge
Length
Proposed
by
Different
Aulhorsi3)
PreposerEquivalentVield
ttiiigeLenath,LpCalculatedLd,([m)HotielSpeeimensforthe
Baker2{O,8klk,(zld)c}
2],O
Hattock2<O,5d+O.05z)
LV,fi Sa-yer2<O.25d+O,075a) 15,q Authorsdc{igeb(,,Se:f・l l8,225,G5,
la
wo
P-b
Mi
N-"--di-.--'''t'.x,let',Rt't
-."tHt./-th'--.-.-.--.-,-sL"ss-sh'v
・-・"-ajel''-''it'''
.-t-.-t-.i'-t'-'ii'l't'll.J..iRiJtt'
pa
[a)M im Peak of tnrinonta! Icai Srbug
ttrS
WVd---v
fiv
6i[d
L4
i・: ii;''iiR:
Fig.5
e
.-t-.
(b)At theEhiThe
Geometry
Specimens
for
g
y l"'ie
i
fR
r
ef fbrizenta1 ZDal ing
ef
Defleeted
Shape
efthe
+P-v
x
'
' 1
Atth"peak ef laadirg avcles
-"--
Atti}emi ef laHdlrgcycles Hy wi2Wt2r・・.,,'iH"
'
.s
'''
'
st.---Frt''
Moment Dl2gram MyMe'-C2Vtllfrl ',1''xLt---'''-.] ' ' Hement Dtagram''lg:Curveture Dtagian
,
Cvrv,aLureD±agramt
t
(a)ForPositivenorizmita!LmadtrE (b)For Neeattve HDrtzonter lnHdirg
tt
Fig.6
Qualitative
Bencling
Moment
andCurvature
Distributions
Along
tfie
Frame
Members
Calculated
by
the
Analylical
Methoa
'
Table2
Deslgn
ofModel
Sbecimens
withthe
Results
Obtained
1
frorn
thePrototypesPROTOTYPE
MODEL RthFloorBeamtttt"hFloerBe"mttt.tlttltFloorBeam(es-qH)4thFloorBeam(BL-61H) EndCenterEnd[enterEndCentetEndCemter Lon#itudinalUprierOADO.4cle.84O.40+o.s7O.37o,HqO.B4 Reinfercement itatioC:)Le"erO.4ptO,S2O.40tO.54O.3TO.37O,S4O.84 VebReintorcement
RatioC:) O'.2o O.20 o.qo o,qo
WorkinsVerticalLoad(Wo>(ke)20,OOOsotilt22.50090es
600 1,D70
+ Mipimumreimfo#tement Fatie requiretaents of R.C.
Cede
vas applted correspendin:1v "Load reductien facter+s112Sferone-Nfth scate model'
where,
e,
e',
e"
andR
arethe
deflection
angles as shownin
the
figures,
andofL,
afiR,
6t:L,
and
Dcn
are
the
memberdeflections
of
the
left
half.-length
beam,
right
half-length
beam,
left
colum,n and rightcolumn
respectively.
By
usingthe
Eq.s
(1)-:(4>
the
interstory
deflection
angle
R
andthe
y.erticaldeflection
ofthe
beam
centerS.
b
ecome.
t
'
1
R=(-of,-S.,+2S,,+2tib,).T・・・・・・・・・・・・・-・--・・(5)
1
a.=(i,,-
a,,-2
o,,+2
at,)・2・・・-・・-・・----・・・・・(
6
)
Trie
qualitative
bending
m,oment and curvaturediagrams
of
the
frame
underdifferent
stages ofloadings
calculatedby
the
above analytical method are shownin
Fig.6
(a)
and6
(b>.
From
these
figures,,
it
canbe
ebservedthat,the
residualmoment and
curvature
diagrams
atthe
end ofpositive
and'
negative
loading
cyeles
are
notthe
same.3.
Preparation
for
Experimintal
Study
An
interior
frame
of
a six-,story,single-bay
reinforced concretebuilding
was selectedto
be
the
prototype
for
the
specimens
tested
for
tfiis
study.Fig,7shows
the
ptan
andthe
elevatio'n ofthe
frame,
which
wasdesigned
accordingto
the
R,
C,
Code
ofAIJ.
It
was consideredthat
the
columns of ev ev emFig.7
+P.'
Wa(a) PlanPlan
and . .9//t/
Eleyation
evrn
'
Em-
,
''
'tt
R6
5 43
2 G'
ofthePretotype(bl
ElevationFrame
Fig.8
(a)T=1,OO
(BL-61H)
o
'
t.+..99
o
@T:'
'
'3-6tp2 Z6
/'2-"3
i8i,-,-14r,1-(b)
T-
O.66
a
@tt.t/
rt
a(vp.tllx・/
3-6"1
r'
iipa@.F1-603
L-v4-FoTmatlon
Loading,
(a)
T
-
O.13of
Yield
Ainges
underfor
D{fferent
7
Values
1-6
¢1 3-6¢
ti
L/4-Combined
-75-this
frame
wouldcarry
the
one-third
ofthe
horizontal
inertia
force
produced
in
its
spanduring
earthquake,while
the
rest
two-third
wouldbe
taken
upby
the
end wallsprovided
in
that
building,
The
sectionproperties
ofthe
Rth
(roof)
and
the
4
th
floor
beams,
according
to
the
results ofthe
abovedesign,
aregiyen
in
Table
2.
Table
2
also
shows
the
amount of working vertical
load
to
be
carTiedby
the
beams
of
the
respective
floois.
The
beams
ofthe
model specimens wereprovided
with
the
calculated
amountof
reinforcernent ratios as well asthe
working
veritcalload
as shownin
Table
2.
The
tensile
reinforcement ratio$throughout
the
length
ofthe
beams
for
both
the
upper
andlower
positions
in
the
cross
section
were selectedto
be
the
same asthose
whichhad
¢ome outfrom
the
design
for
the
upper
position
at
the
end
section
of
the
respective
beams
ofthe
prototype
frame.
Thus
the
resulting ratio,r
of compressive reinforcementto
the
tensile
reinforcement alongthe
beams
ofthe
modelsbecame
unity.
This
was
done
for
the
simplicity
of
the
construction ofthe
reinforcement skeleton, whichis
nowadaysbeing
usedin
commercial
cases.
The
hysteresis
loops,
calculated
by
the
above
mentioned
analytical method are shownin
Fig,
8,
in
terms
of
the
horizontal
load,
P
versusthe
interstory
deflection
angle,R
for
atypical
4th
flooi
model specimenwlth
three
different
values of7,
(1,O,
O.
66
and
O.
33>
for
its
beam.
It
canbe
seenby
comparingthese
three
figures
that
the
tensile
reinforcement atthe
both
end sections of allthe
three
beams
yields
atabottt
o.
O05
radian ofinterstory
deflections,
but
foT
the
cases withthe
valuesof
r
otherthan
unity,
there
appears onemore
yield
point
which correspondsto
the
yielding
ofthe
tensile
reinforcement atthe
lower
layer
of
the
sections
at
a
distance
ofone-foruth
span
length
from
the
both
ends ofthe
beams,
wherethe
reinforcement ratiois
changedfor
its
bending
upfrom
the
lower
layer
to
the
upper.
Table3
shows
the
progress
of
the
verticaldeflection
ofbeam
center
for
the
above
three
cases with respect
to
the
interstory
deflection
angle.In
this
Table
it
canbe
seen clearlythat
the
beam
centerdeflection
increases
continuously withthe
progress
ofthe
deflection
for
allthe
three
cases, showing almost noreasonable
effects
of
the
variation ofthe
value of7.
For
the
aboye calculations,the
materialproperties,
the
horizontal
loading
program
andthe
working verti ¢alload
(33
%}
onthese
beams
were consideredto
be
the
same
for
all
the
three
cases.4.
Experimental
Study
4,1
Test
Specimens
Two
typical
one-fifth scaled model specimensBS-41
H
andBL-61
H
were supposedto
representthe
Rth
and4
th
fleor
beams
of
the
aboye
mentionedprototype
frame
withoutthe
floor
slabs.As
the
tensile
reinforcement ratiosat
the
center
of
the
beams
in
the
case
of
models, comparedto
those
ofthe
protetype,
were roundeddown
from
O.
52
%
to
O.
37
%
and rounded upfrom
O.
54
%
to
O.
84
%
in
the
cases
of
Rth
and
4
th
floor
beams
respectively,the
amounts ofthe
working verticalload
were also changed almostin
the
same ratio$ asshown
in
Table
4.
Thus
the
leyel
of
the
vertical
loads
happenecl
to
be.about
30
%
ofthe
calculated
ultimate
capacity
for
verticalloads
of
the
beams
withoutthe
expeTience ofhorizontal
loading.
Fer
the
reason ofthis
increased
level
of working verticalload,
the
web reinforcement ratios were also madedouble
to
the
designed
onesto
ensuTe sufficientductility.
The
both
types
of
reinforcement ratios
in
the
columns ofthese
specimens wereprovided
sufficiently
to
ensurethe
weak-beam, strong-column mechanism.Table3
TheValuesofBearnCenterDefiection,
cr.
Increasing
Along
withthe
Interstory
Deflection
Angre,
R,
for
DifferentValues
efr
r
Sv(mm) r=1.00r=O.66r=O.33
O.O025 1.q5(1.49) 1.51{1.54) 1.55(1.58) O.O050 1.Be"a.aL) ].8af(1.8E) 1.81t(t.S5) R(rad.)O.OIOO
3.D5(3.29} 3.19<3,40) 3,Ltti(3,5T)
O,0200
5.50(5.34)
6,offtde(G.53)
5,B5(G,93)(
)
Values
Cerresponding
te
Residval
interstuty
Def)eetien
+Upper
Reinforcetuent
Yield
lt Le"er Reinfercement YieLd
Table4
The
Variation
ofDifferent
Specimens
LongitudinalReinforteptent
Ratie"(;) Worki"aVertlc:1Load Beam SpeciurenEndCenteFCotutu" Vo(kg)WelW"(x> eS-41H 600 2T BS-41Ve,3TO.3T
-
-RL-OIH 2,49 1,07033
BS-61He.sqO.84
1.a-o 45BS-6LV
L
-Stirrups&Hoepspw±
-O.4DX
3.2
¢-50mnt@pw=e,42X
4.oe-soptm@
tThe saate values for both tensile aTtd couLtressiv" reiiiforcement
'
-76-'
1600
su
oo-otetH+
-
-co-16eO/3'
i6oo/3
i6ooi34-l2glg"8-DIO4opSOd-108
+g8!-o
t
! !se'
+ +riRM
s
'
・6-4"er3.2dee50d=128
'
suafta
o
o-oe-Table5
/1,jMechanicalPrgperties.of
Materials
t./
(a)
Coneret.e
testSpecimenCOM[b.Str,engthYeung'sModulus
BS-41HO.282・3xloZ Bs-qlvO.352.2kleiBL-61HO,282・2xl02
BS-61HO.2B2.3xl02Bs-61vlo.2B,.,2・4xlo2
unit: ton/cm2(b)
Reinforeement.
Bar,YieldStrengthVltimateStrepgthVOungisMedulus
.3.2di.q.s66.721.9x・los
4.0th4.675.991,9xlo9
6.0¢・3.104.201.9xioe
ole¢ 4.035.T52.lxloS ',
unlt: rm.
FigLg
The
Specimen
vvithReinforcement
.-
.
unit: ton/cmi'
'
In
this
studythe
number
oftwo
different
types
of specirnenstotaled
five,
TwQ
of which werethe
R'th
story
flgor
bleam
frames
andthe
restthree
werethe
4th
storyfloo;
beam
frames..
Fig.9
showsthe
overaltdimension
andthe
reinforcement of allthe
specimens.For
simplicity of construction,in
the
case ofthe
4th
floor,
the
portions
ofthe
c61uinns
developed
above
the
beam
level
were notincluded.
To
observe
the
effects
ofhigher
level
of workingvertical
load,
the
specimenBS-61
H'
wastested
under anincieased
level
of45
%
ofits
ultimate vertical capacity withoutthe
experience ofhorizontal
,loading.
,
,
.
'
The
mechanicalproperties,
ofthe
mateiials usedfor
the
cofistruction ofthe
.models
are shown'in
Table
5
(a)
and
5
i
(b).
,
・
.
,
4.2
LQading
,and
Measurement
Three
specimens.with
their
numbers ending withthe
alphabet`H'
(eg.
BS-41
H),were
tested
underdisplacement
controlleq reversed
h6r.izontal
load,
during
whichthere
was apreviously
applied constant・two
points
workingvertical
load
(
wr)
onthe
beam
asexplaiped
above,At
the
end
ofthe
last
cycles
ofhorizotal
loading,
thevertical
load
on
the
beam
wasincreased
upto
the
failure
efthe
beam
in
terms
ofthree
gradually
increasing
repeated verticaltoading
cyclesin
the
case ofEBS'
series only,On
the
otherhand
the
sametype
of specimensin
'BL] series arebeing
used
in
the
long
term
(creep)
test
underthe
same wprking verticalload,
to
get
the
time-dependept
informations
ofthese
beams
ofthe
frames
・with
the
experience of{eversed
horizontal
loading.
However
the
time-dependent
informations
are notincluded
in
the
scopeof
this
paper,
ln
this
study,the
working4xial
force
in
the
columnsis
not
Interstory
deflection aqgle, R[X]
2.oo
-.---.-.-..TT-.-7..8
1.oo
---...5..6
o.so
-.".-3"4
o.2s
1.t2g::3
1!i:.:.2:T
...
cyeies
-3
-4
.
I.oe
---J-"'""':s"-6
2.00
---..."....".--...
"
-7 -8
2I:I
2g.:s:ig:rtge,tTraiiSdiie"rS
'
Fig.11
Horizontal
Loading
Progiam
W.S.G. Wire StrairiGages
C.G. C[mtact Gages-
.
Fig.10
Setup
for
Loading
andMeasurqments
-77-included,
asit
has
very negligible effects onthese
types
of strong columns.The
othertwo
specimens withthe
alphabet
`V'in
their
numbers weretested
only underthree
gradually
increasing
repeatedtwo
point$
verticalloading
cycles,
Fig.
10
shows
the
setup
for
the
test
as well asthe
loading
andthe
rneasuring apparatus.Both
the
positive
andthe
negativehorizontal
loadings
were applied onthe
outer surface ofthe
columns atthe
beam
axisleyel,
whilethe
two
points
verticalload
was applied atthe
one-third
points
onthe
beams.
The
verticalloading
apparatus wasdesigned
in
such a waythat
the
top
ofthe
specimenscould
rnovefreely
in
its
plane,
Oil
jacks
were usedto
applyboth
the
types
ofloadings,
Seven
Displacement
Transducers
(D.
T.
)
were used alongthe
length
of
the
beam
to
measurethe
verticaldeflection
of
the
beam
while six mQre were usedto
readthe
two
lateral
(horizontal
andtransverse)
directional
deflectiens
of
both
the
columns.Twenty
Wire
Strain
Gages
(W.
S.
G.
)
were used on concreteto
rneasurethe
either
side surface strains atten
different
points
on
the
beam
and columns.Twenty
moreembedded
W.S,G.
were used onthe
longitudinal
reinfercement ofthe
beams
of4
th
storyfloor
beam
specimens only.In
additionto
these,
Contact
Gages
(C.
G.
)
wereused
at
six
places
on
the
beam
andbeam-column
joints
to
measurethe
ciack width atthe
different
levels
of
horizental
and
verticalloading.
However,
allthe
experimented
resultshas
not
been
included
in
this
paper.
Fig.11
showsthe
program
for
the
reversedhorizontal
loading
whichis
the
same
asthat
usedin
Ref,5
and6.
5.
Experimented
and
Calculated
Resutts
and
Discussions
Frorn
the
test
results of allthe
five
specimens,it
wasobserved
that
the
specimens
ofboth
the
Rth
floor
and
the
4
th
floor
beams
show almost similarbehaviour
undeidifferent
loadings.
Here,
in
this
paper,
focus
is
going
to
be
placed
on
the
4
th
floor
bream
specimens,because
the
qualitative
test
resultsof
the
Rth
floor
beam
specimens are more erless
similar
to
their
corresponding
ones
of
4th
floor
beam
specimens.5.1
The
Crack
Progress
Observed
onBeams
During
Horizontal
Loading
The
crackpattefns
ofBL-61H
under working verticalload
andat
the
endof
the
2nd,
4th,
6th
and8th
(last)
cycles ofhorizontal
loading
aregiven
in
Fig.
12
(a).
It
was observedin
the
cases
of
allthe
specimens
that
the
working verticalloading
cau$ed afew
hair
cracks onbeam
just
underthe
two
points
of yerticalload
and or atthe
two
extreme ends.With
the
application of reversedhorizontal
loading,
the
flexural
cracksbegan
to
appear atthe
interval
of7-10
cm, startingfrom
the
bottom
surfacein
the
middle-thirdportion
of
the
beam.
As
the
interstory
deflection
angle wasincreased,
these
cracksbegan
to
extenddeeper
and widerinside
the
beam
as new cracks appearecl and spread onboth
sides
along
the
length
of
the
beam.
On
the
other
hand,
on
the
top
surfacethere
appeared almost no new cracks exceptthose
at and very nearthe
two
extreme ends ofthe
beam.
If
the
figures
of cracks ofboth
BL-61H
andBS-61H
atthe
end ofthe
8th
cycle ofhorizontal
loading
in
Fig.
12
(a)
and
12
{b)
are compared,it
willbe
found
that
there
are almost no significant effectsef
the
increased
level
of working.
,
thrierVft)rkingVerticailnad,
・'
Attheedof2rtiCv ¢le・
,
: Atmberrtof4thqycle 4...-+
"
[trrlerWOrkSngVerticalrnal{BS-SliI)+
,'
At tiietu of 8thCyclefBS-6N)
,
+
1/・t.ttr)r".rst/1 AtUltirmteVerticalInaltES-6ma) +,...,
,
ttt
l・'l,1・
Atdeeniof6thClycle,
・
'//.
1/lt1/(・l
Attheendof8thCycle f---g.--+
+
fiAtU!timteVertdcalLoaatBS-Srv)
Ca)
aLr6M
LtrtlerVario,s ZDaairbg StagesCb)
BS-61H
ana BS-6]r Ltr[ierVatious ZnedingStages
Fig.
12
Crack
PatteTns
ofSpecimens
Under
Varions
Loadings
78
-.---P200
'
Cal.P(tg)
'
1iooo-:'tt
'
tt
'
8-6-4:
tt.tttt.,CF2''468
'i't''r-
tt/tttt.i:t7..,..ttt.t.t.
.6H(mTn)/'
.v
tt
(a)
BS-41H
-Fig.13Experimented
and(b)CalculatedBS-61H
HysteresisLoops
underHorizentalLoading 'lsoe
ltsl・
(ng
1
iooo
500
o
Fig.14
1
Progress
2
ofVertical
3
4
S
"
6y
(mm)'
Deflection
atBearn
Center
during
6
Horizontal
7
Loading
8
(BS-61H)
/yertical
load
onthe
crackpatterns.
5.2
The
Hysteresis
Loops
of
Horizontal
Load
Versus
Interstory
Deflection
Angle,
The
experimentedand
calculatedload-deflection
(P-ai,)
curvesfor
reversedhorizontal
loading
test
of
two
different
specimens
BS-41H
andBS-61H
are
given
in
Fig.
13
(a)
and13
(b),
andthose'for
BL-61H
was alreadygiven
in
Fig.8
(a).
Up
to
the
interstory
deflection
angle,ofO.
5
percent,
the
hysteresis
loops
were spindle shapedfor
all
the
specimens
tested
underhorizontal
loadingl
Then
asthe
loading
wasincreased
beyond
the
deflection
angleof
O,
5
percent,
the
shape ofthe
loops
appearedto
be
ofinverted
`S'type
one.It
was observedby
comparingthe
hysteresis
loops
ofBL-61H
andBS-61H
that
there
weie almost no remarkable effects ofthe
increased
level
of working vertical-79-load
onthe
pattern
ofthe
loops
but
the
requiredlevel
ofhorizontal
load
for
determined
interstory
deflection
wasdecreased
in
the
case
of
BS-61H,
It
can
be
seen
from
the
comparison
of
these
figures
that
the
calculated curves resemble well enoughthe
experimented ones.Thus
the
analytical method seemsto
be
quite
reliablefor
the
prediciton
of
the
hysteresis
loops
underthe
combinedloadings.
5,3
The
Increase
of
Vertical
Deflection
of
Beam
Dttring
Horizontal
Loading
Fig.
14
showsthe
verticaldeflection
progress
atthe
center ofthe
beam
(
0b}
during
reversedhorizontal
loading
test
(BS-61H),
As
it
is
seenin
Fig.
14,
it
was notpossible
to
keep
the
working verticalload
onthe
beam
atits
constantlevel
during
the
horizontal
loading
tests.
The
verticaltoad,
which wasdecreasing
withthe
increase
ofthe
verticaldeflection
of
the
beams,
was
being
readjusted
at
the
end
of
every
horizontal
loading
cycle.Fig.
15
(a)
and15
(b)
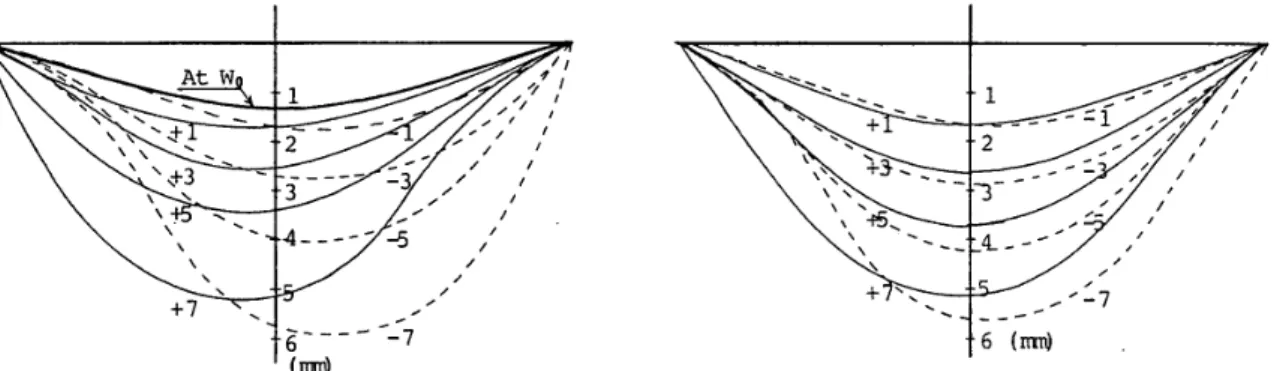
{a)
At
the
Peak of HorizontalLDaling
Cycles
Fig.15
Deflected
Shapes
ofBeams
s
sss ' /tts-L
.v
1
tt1
M-L"J=1'ni'
x+
--
txl
ssN.x.N+SXKNL--2-1--'i':-tZtzt'llll NNN+srv-1'
NNst---4.--'''' N x' +Ns 'Ns
''--..-7
6(rmO
(b}
At thebl
of}lorizontal
[Daiing
¢yeles
under
Cornbined
Loadings
(BL-61H)
o
o
o
e+g(rad.)o
o
o
o
O.O05
O.OIO
O.020
O.O05
O.OIO
O.O15
"
R
(rad.)
.
Fig.
16
Experimented
andCalculated
Values
ofIntersteryDeflection
Angle,
R
Vefsus
the
Beam
Half-length
Deforrnation
Angle
e+
0',
at thePeak
and atthe
End
ofHorizontal
Loading
Cycles
-
80
--.Ol .--"iixP-
AtthePeakofCycles
."oCal'.oo
'-.n---e-.---.o
9-'-''
-.h'BS-41H
"n' .oorad.).oo
---.-L'---...
.
-...'"--'b--J-"-..J.4
.nt'BL-61H
.ooo.---'.'''-'''''''
.O05
i--'.'-F
h..h'''-.n'
BS-6!H
.ooo
AttheIindofCycles
?F%--'-e.-F.Jtrv"'d'''''"'
o--..Jv]-..---'FFDtcr'''U pt n''''''irp-e-gib''-.]fh'' /'
shows
the
deflected
shapes ofthe
beain
ofBL-61H
atthe
peak
and atthe
end of reversedhorizontal
loading
cycles
iespectively.
At
it
is
seenfrom
these
three
figures,
it
was observedthat
the
verticaldeflectionsi
alongthe
length
of
the
beams
wereincreasing
continuouslyduring
the
reversedhorizontal
loading
tests
in
the
cases of allthe
three
specimens.Moreover,
'it
can
be
se'enby
the
comparisonbetween
Fig.
15
(a)
and
15
(b)
that
the
verticaldeflections
along
the
beams
were notdecreasitig
whenthe
horizontal
loading
was withdrawn atthe
end of everypositive
and negativeloading
cycles.
This
increase
of
the
verticaldeflection
ol
beams
was
more
for
the
higher
level
of
applied working verticalload
during
the
initial
stages
of
horizontal
loading.
The
experimented
as wellas
the
calculated values ofthe
interstory
deflection
angle,R
versusthe
beam
half-length
deformation
angie,e+
e'
atthe
peak
and atthe
end
of
every
cycleof
positive
and negativehorizontal
loading
of allthe
three
specimens aregiven
in'Fig,
16.
In
this
figure,
the
wayof
the
progress
of
verticaideflection
of
beam
centers
during
horizontal
loading
canbe
observed
clearly.
It
is
also
seen
that
the
cqlculated
valJesobtained
by
the
analytical methoddescribed
above.Iies
between
80
%-95'%
ofthe
experimented valuesfor
both
atthe
peaks
and atthe
ends
of'
the
horizontal
loading
cycles.Thus
the
method seemst6
be
quite
ableto
predict
the
progress
ofthe
verticaldefLection
ofbeam
center underthe
combihedloadings.
5.4
The
Vertical
Load
Carrying
Capacity
ofBearns
Experimented
and calculatedload-deflection
(
W-tt.)
curves under verticalloading
of allthe
specimens aregiven
in
'Fig,
17,
in
which
the
vertical
load
carrying
capacity
of
'the
specimens
with or withoutthe
experience
of
horizontal
loading
canbe
cbmpared.The
straightline
portions
ofthe
curves extendedhorizontally
arethe
effects ofthe
increased
verticaldeflection
during
horizontai
loading,
The
aetualbeh'aviour
ofthis
portion
for
BS-61H
ivas
alrea'dygiven
in
Fig,
14,
Though
the
specimenBS-61H
was carryingthe
working vertiealload
ef45
%
ofits
ulitmatecapacity,
the
ultimate vgrticalload
earrying capacity ofthis
specimen withthe
experience ofhorizontal
loading
was about95
%
ofthat
ofBS-61V,
which wastested
withoutthe
experience of anyhorizontal
loading.
On
the
otherhand,
atthe
end ofhorizontal
loading,
the
stiffness against verticalloading
ofBS-61H
comparedto
BS-61V
wasdecreased
to
a conSiderable extent.This
phenomenon
was alsd observedbetween
BS-41H
andBS-41V,
'
The
crackpatterns
of
BS-61H
andBS-61V
for
ultimatevertical
load
are.given
in
the
last
two
figures
in
Fig.
12
'
<bL
'
'
'
Table
6
showsthe
comparisonbetween
experimented
andcalculated
ultirnate verticalload
carrying
capacities
of
'
the
four
specimens of `BS'series.
The
calculated ultimate verticalload
carrying capacity ofth'ese
specimens were obtainedby
consideringthe
collapse rpechanism ofthe
bearns
by
forming
simultaneousyield
hinges
attheir
both
ends ancl also underthe
verticalloading
points.
From
the
experimented resultsit
is
seenthat
the
specimens withthe
3000
2ooe
w
(tg?
1
iooo
y,2
..yi.-.t.P-S-Jy,2
,x'tif7-yk?97!
y・
t"i
/i
f
tlt
-1
i
--"-.
・i・
,J-.
t'y'
/
.il /' ,-.t.//
"'--
&-r
-'h
-.-..''ny'-"'-',h
y
{
al cl1 y ''y,1
Z,1
'"/ 71lry,i7if
.,7,'t
Wf2
sc'
BS-41H
-・---BS-41V-・-・-・-
BL-61H
---・・
BS-61H
...-.:x-
BS-61V
HCa!.
y
;!yield
c = erackY2
o
uy,4
10
IS
20
"
6,
(mm)
as well'as
the
Progress
ofVertical
25
30
/
5
Fig17
Load-Deflection
Curves
underVertical
Loading
Horizontal
LoadLng
Deflectien
atBeam
Center
during
-81-Table6
Cemparison
between
Experimented
and
Calculated
Ultirnate
Vertical
Loads
ULtimateVerticalLeads
SpecimenExp.(kg)Cal,(kg)E,xp,ICal.(ratie)
BS-qlH2,0902,0301,03
BS-41V2,19e2,03D1,08BS-61H2,9TO3,L20O.95
BS-61V3,2003,L20L.03Table7
Calculated
Values
ofShear
Capacity
efMembers
andBoundary
Sections5)
Beam
CoLumnBo"mdarySection
FloorFrameAtCracking AtUltimateAtCrackingAtUItimatell・As,"y Rth1,480L,OIO1,5902,1503,S20 4th1,5301,S301,5502,1506,100 unit: kgexperience
ofhorlzontal
loading
also show nearlythe
same ultimate verticalload
carrying capacity asthat
for
their
similar specimens withoutthe
experienceof
horizontal
loading.
This
meansthat
the
reversedhorizontal
loadings
have
iittle
effects
on
the
ultimate
verticalload
carrying capacity ofthe
beams
in
seismic-resistantductile
reinforced concreteframes
evenif
the
maximuminterstory
defleciton
angte causedby
horizontal
loading
reachesthe
great
value of about2,O
percent.
From
Table
6
andFig.
17,
it
is
seenthat
the
analytical methodcan
fairly
predict
the
ultimate verticaltoad
carrying capacity and alsothe
beam
centerdeflections
under verticalloading
for
beams
in
frames
with or withoutthe
experience of reversed
horizontal
loading.
Table
7
showsthe
calculated values of shear capacitiesof
the
frame
members andthe
columnfaces
atbeam
ends.The
values were obtainedifrom
the
shear strength equations asdescribed
in
Ref.
5,
It
can
be
seenfrom
Table
7
that
shear
is
not acriticalfactor.
exceptthat
shear cracks may occurin
the
beams,
The
calculated
shear
in
the
columnsfor
the
ultimate verticalload
is
only about1.0ton,
whichis
not
a criticalfactor
also,6.
Conclusions
Based
on
the
study
reported
herein,
the
following
conclusions maybe
made.O
An
analytical rnethodhas
been
developed
to
predict
the
behaviour
of single-bay, single-$toryreinforced
concrete
frames
underthe
combined effects of verticaland
horizontal
loading.
This
methodincludes
the
assumptions offinite
elementtheory,
the
equivalentyield
curvature,the
plastic
curvatureof
any section and alsothe
hysteretic
properties
in
the
moment-curvature relation.2)
The
11sth
scaled single-bay,five
reinfoTced concreteframe
specimenshaye
been
tested
to
studythe
behavieur
of
the
beams
of
frames
undei combined aciton of vertical andhorizontal
loadings.
Two
of
the
specimens wereconsidered
to
represent
the
roof
floor
beam,
whilethe
restthree
wereto
the4
th
floor
bearn
ofasingle-bay,
six-story
building,
designed
accordingto
the
R.
C.
Code
ofAIJ.
With
these
specimens,the
effects
of
the
cornbined
vertical andhorizontal
loads
onthe
behaviour
ofthe
frames
have
been
observed,And
alsothe
effects
of
the
increased
level
ofthe
working veTitcalload
during
the
combinedloading
have
alsebeen
investigated.
3)
It
has
been
found
from
the
experimental resu]tsthat
the
reversedhorizontal
loading
producesa
considerable continuousprogress
ofthe
verticaldeflection
alongthe
length
ofbeams,
under working verticalloacl
onthe
beam.
It
was also observed