命の要因分析
著者
鈴木 孝弘, 田辺 和俊
雑誌名
東洋大学紀要 自然科学篇
号
61
ページ
105-118
発行年
2017-03
URL
http://id.nii.ac.jp/1060/00008566/
Creative Commons : 表示 - 非営利 - 改変禁止 http://creativecommons.org/licenses/by-nc-nd/3.0/deed.jaAbstract
Social determinants of life expectancy attract much attention worldwide, and several papers were presented on statistical analysis of determinants using linear regression method (OLS). In this study, a large-scale experiment has been done to analyze deter-minants of life expectancy and healthy life expectancy of 156 countries using 44 explan-atory variables of 5 fields and a non-linear regression support vector machine (SVM) technique. The SVM model shows that only 12 factors represent life expectancy of 156 countries with a higher accuracy of determination coefficient of 0.928, and only 9 factors represent healthy life expectancy of 156 countries with a higher accuracy of determina-tion coefficient of 0.956 than previous works. It also shows that the health factors such as AIDS prevalence rate and health expenditures most significantly contribute to life expectancy and healthy life expectancy of 156 countries.
Keywords: Life expectancy; Healthy life expectancy; Determinant analysis; Nonlinear regression
₁.はじめに
近年,健康の社会的決定要因が世界的に注目されている。その背景には,経済のグロー非線形回帰分析による世界各国の
平均寿命・健康寿命の要因分析
鈴木孝弘
a・田辺和俊
bAnalysis of Determinants of Life Expectancy and Healthy Life
Expectancy of Many Countries Using Nonlinear Regression
Takahiro S
uzukia, Kazutoshi T
anabeba 東洋大学自然科学研究室 112-8606 東京都文京区白山 5-28-20
Natural Science Lab., Toyo University, 5-28-20 Hakusan, Bunkyo-ku, Tokyo 112-8606, JAPAN
b 東洋大学現代社会総合研究所 112-8606 東京都文京区白山 5-28-20
バル化が進展し,絶対的な貧困層が減少しつつあり,次の課題は健康問題と考えられてい るからである。社会的な最下層に近い国ほど,平均寿命は短く,多くの疾病が見受けられ, 世界の最長寿国と最短寿国とでは40歳以上の健康格差が存在する。また,近年では,単な る生存年齢である平均寿命でなく,個人の生活の質を重視する健康寿命が注目されている (WHO)。健康寿命でも世界の最長寿国(日本)と最短寿国とでは40歳近い差がある。 しかし,人間の健康,病気については遺伝等の先天的要因だけでなく,経済,社会,文 化,環境等の後天的要因も関係するという認識が定着しつつある。このように,多数の要 因が関与するという問題の複雑さのために,経済格差に関する研究の進展に比べると,健 康要因解明の研究は遅れている。WHOは2003年,健康の社会的決定要因に関する意識の 向上を目的として,“Social Determinants of Health: The Solid Facts”の第 2 版を公表し, 2008年には最終報告書“Closing the gap in a generation: Health equity through action on the social determinants of health”を公表した(WHO)。これらの報告書では,健康の社 会的決定要因として,社会格差,ストレス,幼少期,社会的排除,労働,失業,社会的支 援,薬物依存,食品,交通の10項目を挙げている。 これら多数の要因の内で,寿命に対して影響を及ぼす要因,すなわち決定要因を解明す るため,寿命と各種要因との相関を統計解析する実証研究が行われている(Mehrara & Nasibparast 2012)。しかし,要因と寿命との関係は単純な構造ではなく,複雑な階層構造 を形成している(近藤 2005,2010,杉澤 2012)ため,個別的な相関分析から寿命の決定要因 を明らかにすることは難しい。そこで,世界各国の寿命を目的変数,幾つかの指標を説明変 数とし,重回帰分析により決定要因を探索する研究が行われてきた(Grosse & Perry 1982,Anand & Ravallion 1993,古川 1996,Shaw et al. 2005,古川 2005,Jaggar et al. 2008,Kabir 2008,Desbordes & Azemar 2008,Bergh & Nilsson 2009,Castello-Cli-ment 2011,Holstein 2011,Fujikawa et al. 2011,Doytch et al. 2012,Bayati et al. 2013,Jaba & Balan 2013,Lee 2013,Minagawa 2013,Kim & Kim 2014,長谷川 2014a, 2014b,Tareque et al. 2015)。 しかし,論文によって解析対象の国と説明変数の範囲が異なるため,決定要因の種類や その影響度について全く異なる結果が報告されている。解析対象の国については, 1 カ国 (例えば日本のみ),OECD加盟国,被援助国,あるいは地域(例えばアフリカのみ)のよ うに対象を限定した研究が多く,世界中の多様な国を一括解析し,一般性の高い決定要因 を探索した研究は見当たらない。また,説明変数についても,経済指標(GDPや失業率), 健康指標(医療費や病床数)のように,限定的分野の少数の変数を用いて解析しているた め,回帰決定係数が低く,統計的に有意な結果が得られていない。このように解析対象や 説明変数を限定した先行研究から得られた決定要因は信頼性の点で疑問がある。 さらに,先行研究における問題点の一つに線形重回帰分析の適用がある。なぜなら,相 対所得仮説(Wilkinson 1992)が示すように,各種の指標と寿命との関係は一般に線形で はなく,複雑な相関関係を示す指標が多いからである。このような複雑な事象に対する有 効な対処策として,非線形回帰分析手法の適用が考えられる。しかし,非線形回帰分析を 用いて寿命の決定要因を探索した研究は見当たらない。 そこで本研究では,世界中の多数国の平均寿命・健康寿命のデータを目的変数とし,健
康・医療,経済・社会,教育・文化等の多分野の多数の説明変数を用いて非線形回帰分析 により一括解析し,それらの中から決定要因を探索する実証分析を行った。筆者の知る限 り,寿命の決定要因について本研究のような大規模データを用いて精密な解析を行った先 行研究は見当たらない。
₂.方法
₂.₁ 平均寿命,健康寿命および説明変数 平均寿命と健康寿命は世界156カ国のデータをWHO,国連(UN),世界銀行(WB)等 のホームページから入手した。Fig. 1に示すように,平均寿命(LE)と健康寿命(HALE) は全体的に平行関係にあり,相関はかなり高く(相関係数0.952),156カ国全体では HALE=1.08・LE-18.8 (1) という関係が認められる。しかし,寿命が短い途上国では両者のばらつきがやや大きいた め,平均寿命と健康寿命の決定要因にどのような違いがあるのかは興味深い。 30 40 50 60 70 80 40 50 60 70 80 90Life expectancy (LE)
H ea lthy li fe e xp ec ta nc y (HA LE ) n=156 R=0.952 Correlation line HALE=1.08・LE-18.8 Fig. 1. Scatterplotoflifeexpectanciesvshealthylifeexpectanciesofdevelopedcountries(filled circle)anddevelopingcountries(opencircle)(dottedline:correlationline)
156カ国の内訳はTable 1に示すように,先進国38カ国,途上国118カ国(先進国・途上 国の定義はWBによる)を含み,また,世界の全地域の国々が網羅されている。本研究で はこれら156カ国の平均寿命・健康寿命を一括して解析し,決定要因を探索したが,先進 国と途上国,あるいは地域別のように分割して解析する方法も考えられる。しかし,本研 究では,寿命の決定要因に関して一般性の高い結論を得るために,全156カ国を一括して 解析した。
Table 1. Distribution of 156 countries
Africa America Asia Europe Oceania Total
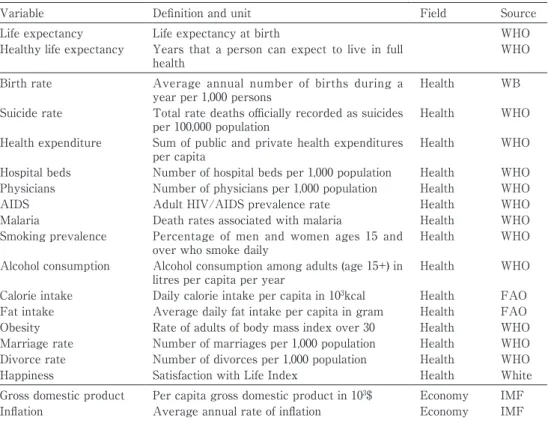
Developed countries 0 4 6 26 2 38 Developing countries 48 25 32 10 3 118 Total 48 29 38 36 5 156 説明変数については,本研究では広範囲の説明変数の中から決定要因を探索するため に,先行研究で用いられている指標をできるだけ採用することにし,WHO等の報告や多 くの論文で検証されていること,世界中の多数の国についてデータが入手可能であること 等の選択理由から,Table 2に示す44種の説明変数を採用した。
Table 2. Dependent and explanatory variables
Variable Definition and unit Field Source
Life expectancy Life expectancy at birth WHO
Healthy life expectancy Years that a person can expect to live in full
health WHO
Birth rate Average annual number of births during a
year per 1,000 persons Health WB
Suicide rate Total rate deaths officially recorded as suicides
per 100,000 population Health WHO
Health expenditure Sum of public and private health expenditures
per capita Health WHO
Hospital beds Number of hospital beds per 1,000 population Health WHO
Physicians Number of physicians per 1,000 population Health WHO
AIDS Adult HIV/AIDS prevalence rate Health WHO
Malaria Death rates associated with malaria Health WHO
Smoking prevalence Percentage of men and women ages 15 and
over who smoke daily Health WHO
Alcohol consumption Alcohol consumption among adults (age 15+) in
litres per capita per year Health WHO
Calorie intake Daily calorie intake per capita in 103kcal Health FAO
Fat intake Average daily fat intake per capita in gram Health FAO
Obesity Rate of adults of body mass index over 30 Health WHO
Marriage rate Number of marriages per 1,000 population Health WHO
Divorce rate Number of divorces per 1,000 population Health WHO
Happiness Satisfaction with Life Index Health White
Gross domestic product Per capita gross domestic product in 103$ Economy IMF
以上の指標の内,人口当たりの数値が算出できるものはその数値を用いた。これらの指 標の中には分布の偏りがかなり大きいものがあるので,各指標は対数を用いてできるだけ 均一に分布するよう変換した後, 0 と 1 の間に正規化して解析に用いた。なお,説明変数 が44種もあるため,変数間の相互相関係数は紙面の都合上,割愛せざるを得ない。ただし, 本研究で用いた非線形回帰分析手法(下記のSVM)では,先行研究で用いられている線 形重回帰分析と異なり,変数間に強い相関がある場合でも解析可能であり,多重共線性問 題は発生しない。
Tax rates Total taxation as % of GDP Economy IMF
Gini coefficient Measure of inequality of income Economy WB
Poverty rate Poverty headcount ratio at national poverty
line per population Economy WB
Unemployment rate Rate of the number of unemployed individuals
to all individuals currently in the labor force Economy IMF
Senior worker Rate of economically active population ages 65
and over Economy ILO
Female worker Labor participation rate, female (% of female
population ages 15+) Economy ILO
Grain self-sufficiency rate Proportion of domestic grains among those
consumed in the country Economy FAO
Motor vehicle Motor vehicles including cars, buses, and
freight vehicles per 1,000 population Economy WB
Military expenditure Military expenditure per capita in $ Political WB
Armed forces Rate of armed forces personnel to total labor
force Political WB
Murder Rate Murder rate per 100,000 population Social WHO
Crime rate Crime rate per 100,000 population Social ICPO
Education expenditure Public expenditure on education per capita in $ Education WB
Literacy rate Literacy rate of people ages 15 and above Education WB
Intelligence quotient Ratio of tested mental age to chronological age Education Eutimes
School life expectancy School life expectancy, primary to tertiary
education Education UN
University Percentage of high school graduates that
successfully enroll into university Education WB
Internet Internet users per 100 population Culture WB
Latitude Average latitude of country Geography WB
Temperature Average yearly temperature Geography WB
Urban population Rate of people living in urban areas Environment WB
Terrestrial protected area Rate of terrestrial protected areas to total land
area Environment WB
Forest area Forest areas per capita in m2 Environment WB
Water access Rate of population with access to improved
water source Environment WHO
Electric power Electric power consumption (kWh per capita) Environment WB
Air pollution Country level of PM10 in µg/m3 Environment WHO
Climate Climate Risk Index Environment GW
₂.₂ 解析手法 非線形解析手法の中で近年注目されているサポートベクターマシン(SVM)(大北 2005,小野田 2007,阿部 2011)は,説明変数の数値に対してカーネルと呼ぶ非線形関数(本 稿ではガウス関数)を用いて学習パターンを別の空間(超平面)に写像し,そこで線形回 帰を行う。それにより,説明変数の元の数値での非線形回帰が可能になり,目的変数と説 明変数の間の任意の関係に対して高精度の回帰結果が得られる。また,高速処理が可能, 最適解が一義的に求まる等の利点があるため,データ解析手法として現時点では最も有効 な方法とされている。 そこで本研究ではSVMを用いて多数の説明変数の中から決定要因の探索を行った。 SVMのソフトウエアはLIBSVM ver.2.89(Chang & Lin)の回帰機能(εSVR),カーネル 関数はRBFを用いた。候補説明変数の中から決定要因を探索するためにはSVMの 3 種の モデルパラメータ,g(RBFカーネルのgamma),c(cost),p(loss functionのε),およ び説明変数の最適化が必要である。そこで,交差検証法と,感度分析法(Tanabe et al. 2013)(各指標の感度を計算し,その感度の低い指標を順次削除しながらSVM解析を行っ て予測値と実測値の平均二乗誤差(RMSE)が最小となる点を探索する方法)の 2 つを組 み合わせた以下の手順を用いた。 ① 156カ国を10群に分割し,第 1 群を予測セット,その他の群をまとめて学習セットとする。 ② 学習セットについて 3 つのパラメータg,c,pをグリッドサーチしてRMSEの最小点を 探し,このモデルに予測セットの指標値を入力して寿命の予測値を求める。 ③ 第 2 群以下の各群を予測セットとして以上の操作を繰り返し,全データのRMSEを求め る。 ④ 各指標の感度を求めるために,当該指標は実際の数値に設定し,その他の指標は平均値 に設定したデータを予測セットとしてモデルに入力し,出力値を求める。 ⑤ 当該指標の設定値を説明変数,出力値を目的変数とする単回帰分析を行い,回帰直線の 傾きをその指標の感度とする。 ⑥ 全指標の中で感度の絶対値の最も小さい指標を取り除き,以上の操作を繰り返す。 ⑦ 指標数とパラメータg,c,pの組み合わせの中で,全データのRMSEが最小になる指標 の組み合わせを決定要因とする。
₃.結果と考察
以上の方法により,156カ国の平均寿命と健康寿命について,全44種の説明変数から出 発してSVMモデルを最適化した結果,Table 3に示すような決定要因の数と,その時の回 帰モデルの予測精度が得られた。決定要因は平均寿命12種,健康寿命 9 種という少数であ るにもかかわらず,Fig. 2に示すように,156カ国もの多数国の平均寿命と健康寿命が高い 精度で再現されている。以上の結果に対し,平均寿命・健康寿命の決定要因を探索した先行研究の中で最多の国 を解析したのはBergh & Nilsson(2009)であるが,国数は92カ国にすぎず,また説明変数 が国民 1 人当たりの国内総生産,人口比率,教育年数,医師数等で説明能力に欠けている ため,平均寿命の予測値と実測値との回帰決定係数は0.529ときわめて低い。また,最多 の説明変数を用いたのはDoytch et al.(2012)であるが,国数が29カ国に対し10種もの変 数を用いたにもかかわらず,得られた回帰決定係数は0.712と低い。以上の結果は,各種 指標と寿命との関係は非線形性が高いため,先行研究で用いられている線形重回帰分析で は精度の良い結果を得ることが難しく,寿命の決定要因に関して信頼性の高い結果を得る ためにはSVM等の非線形解析手法の適用の必要性を示している。 決定要因の内訳とそれらの感度,および式 (2) 100 (%) 1 2 2 × =
∑
= n i i i i S S C (ここで,Siは決定要因 i の感度,nは決定要因の数)により算出した寿命への寄与率を Table 4に示す。Table 3. Numbers of determinants, and SVM regression results
Number of determinants Root mean squared error (RMSE) determination (RCoefficient of 2)
Life expectancy 12 2.40 0.928
Healthy life expectancy 9 2.13 0.956
40 50 60 70 80 90 40 50 60 70 80 90
Observed life expectancy
Pr ed ic te d lif e exp ec ta nc y 30 40 50 60 70 80 30 40 50 60 70 80
Observed healthy life expectancy
Pr ed ic te d hea lthy li fe e xp ec ta nc y (a) (b) R2=0.928 R2=0.956 Fig. 2. Scatterplotofobservedversuspredicted(a)lifeexpectanciesand(b)healthylifeexpectancies ofdevelopedcountries(filledcircle)anddevelopingcountries(opencircle)
まず,平均寿命と健康寿命に対する決定要因の違いを考察すると,平均寿命12種,健康 寿命 9 種の決定要因の内で共通するものは,エイズ感染率,医療費,結婚率,自殺率,出 生率,貧困率,マラリア死亡率の 7 種であり,平均寿命にのみ影響する要因は,電力使用 量,知能指数,上水道普及率,インフレ率,軍人比率の 5 種である。このことから,人間 の生存年齢を示す平均寿命には,健康寿命に影響する要因以外に,これらの社会経済要因 が関係していることがわかる。 共通要因 7 種の中で,エイズ感染率,医療費の 2 要因だけで平均寿命への寄与率57%, 健康寿命51%を占め,これらの医療制度の充実が世界各国,特に途上国の延命にとって重 要な要因であることがわかる。一方,自殺率と貧困率については,それらが高い国ほど寿 命が短いという当然の結果である。しかし,結婚率と出生率については,それらの感度が 負であるということから,結婚率や出生率の高い国は短寿という結果になるが,これは Fig. 3のように,経済発展の低い途上国ほど結婚率や出生率が高く,寿命は短いが,逆に 先進国ほど結婚率や出生率が低く,寿命は長いという世界的な傾向を示していると解釈で きる。 しかし,本研究ではこれらの指標以外に多数の医療・健康要因を説明変数に取り上げた が,どれも決定要因にはならなかった。一方,先行研究で導かれた決定要因は解析対象が 先進国,途上国であるかにより異なっている。Shaw et al.(2005)はOECD19カ国の平均 寿命の決定要因としてタバコ,アルコール,脂肪,野菜の摂取量を挙げた。一方,Kabir (2008)は途上国91カ国の平均寿命の解析から,栄養不足度,医師数,医療費,出生率等 を決定要因としている。これらの結果は,先進国では喫煙,飲酒,肥満等の生活習慣因子 の影響が大きいが,途上国では医療水準因子の影響が大きいことを示唆する。したがって, 本研究において生活習慣因子が寿命の決定要因にならなかったのは,解析した156カ国の 内で先進国の比率が低いためと考えられる。 最後に,経済指標の影響度として,所得格差と健康との関係に関する相対所得仮説 Table 4. Determinants,theirsensitivities(S),andcontributionrates(C)oflifeexpectancyand healthylifeexpectancyof156countries Life expectancy No Determinant S C 1 AIDS -0.304 34.1 2 Health expenditure 0.247 22.6 3 Marriage rate -0.186 12.8 4 Suicide rate -0.144 7.7 5 Electric power 0.120 5.3 6 Intelligence quotient 0.109 4.4 7 Water access 0.104 4.0 8 Birth rate -0.091 3.1 9 Poverty rate -0.079 2.3 10 Inflation -0.072 1.9 11 Armed forces 0.062 1.4 12 Malaria -0.034 0.4
Healthy life expectancy
No Determinant S C 1 AIDS -0.322 37.1 2 Health expenditure 0.200 14.3 3 Birth rate -0.193 13.3 4 Happiness 0.183 11.9 5 Poverty rate -0.166 9.9 6 Malaria -0.118 4.9 7 University 0.109 4.2 8 Suicide rate -0.082 2.4 9 Marriage rate -0.074 1.9
(Wilkinson 1992)を考察する。経済指標については最初,所得と平均寿命の関係が調べ られ,貧困国ほど寿命が短いという関係があると報告された。しかし,この関係は貧困国 のみに成立し,先進国では所得が向上しても寿命は伸びないことが判明した。そこで,次 に見出されたのが,所得格差の大きい国ほど寿命が短いという相対所得仮説である。しか し,この仮説については多くの反証が出されており,結論が出ていない。本研究のデータ では,Fig. 4に示すように,世界156カ国のGpC(GDP per capita)に対して平均寿命の相 関係数は0.681,健康寿命は0.717とかなり高いが,感度はきわめて低く,両寿命の決定要 40 50 60 70 80 90 0 20 40 60 Birth Rate Li fe E exp ec ta nc y 30 40 50 60 70 80 0 20 40 60 Birth Rate H ea lthy L ife E exp ec ta nc y (a) (b) Fig. 3. Scatterplotofbirthratesversus(a)lifeexpectancesand(b)healthylifeexpectanciesof developedcountries(filledcircle)anddevelopingcountries(opencircle) 40 50 60 70 80 90 0 20 40 60 80 100 GDP per capita Life Eexpectancy 30 40 50 60 70 80 0 20 40 60 80 100 GDP per capita
Healthy Life Eexpectancy
(a) (b)
Fig. 4. ScatterplotofGDPpercapitaversus(a)lifeexpectancesand(b)healthylifeexpectanciesof developedcountries(filledcircle)anddevelopingcountries(opencircle)
因でない。一方,ジニ係数はFig. 5に示すように,相関係数は-0.414,-0.461と低く,相 対所得仮説を支持しない。これに対して,本研究の結果では貧困率が両寿命の決定要因に なり,寄与率は低いが,寿命に寄与している。 この相対所得仮説の成否については,さらに多くのデータを用いた検証が必要である。 ただし,国民所得は健康寿命に対する直接的影響は低いが,他の健康,政治,環境,生活・ 文化等の分野の水準の向上に大きな影響を与えることは明らかである。すなわち,GpCに 40 50 60 70 80 90 10 30 50 70 Gini Coefficient Li fe E exp ec ta nc y 30 40 50 60 70 80 10 30 50 70 Gini Coefficient H ea lthy L ife E exp ec ta nc y (a) (b) Fig. 5. ScatterplotofGinicoefficientsversus(a)lifeexpectancesand(b)healthylifeexpectanciesof developedcountries(filledcircle)anddevelopingcountries(opencircle) 40 50 60 70 80 90 0 20 40 60 80 Poverty Rate Li fe E exp ec ta nc y 30 40 50 60 70 80 0 20 40 60 80 Poverty Rate H ea lthy L ife E exp ec ta nc y (a) (b) Fig. 6. Scatterplotofpovertyratesversus(a)lifeexpectancesand(b)healthylifeexpectanciesof developedcountries(filledcircle)anddevelopingcountries(opencircle)
対して医療費(相関係数0.964),教育費(0.960),軍事費(0.830)等,相関の高い指標が 多数存在する。したがって,経済的要因は平均寿命や健康寿命に対して直接的影響は低い が,間接効果は大きいといえる。
₄.結論
世界156カ国の健康寿命を目的変数,健康,経済,政治・社会,教育・文化,地理・環 境の 5 分野の44種の指標を説明変数として用い,SVMモデルを学習し,感度分析法によ り指標を最適化した。その結果,9 種の指標で世界156カ国の健康寿命が回帰決定係数(R2) 0.926という先行研究よりはるかに高い精度で再現できること,および, 9 種の指標の中 では乳児死亡率や医療費等の健康要因の影響度が全体の過半を占めることが明らかになっ た。 しかし,本研究の結果にも幾つかの課題がある。第 1 は本研究の結論の一般性の検証で ある。すなわち,WHOの報告書や先行研究によれば,平均寿命・健康寿命を決定してい る要因には本研究で取り上げた指標以外に,住居,家族・友人,余暇・趣味・ボランティ ア活動等,様々な要因が挙げられている。しかし,これらの要因は少数の国しか指標の数 値がないため,多数の国を統一的に扱う本研究では採用できなかった。したがって,これ らの指標のデータを何らかの方法で入手して解析を行い,その結果を検証することは今後 の課題である。 本研究の結果では,健康寿命に対する経済的指標の直接的効果は低いが,間接効果は大 きいことが明らかになった。健康の社会的決定要因については階層構造を形成すると考え られており(近藤 2005,2010,杉澤 2012),このような階層構造を考慮した健康寿命の 決定要因の分析は本研究の結果の展開として重要なテーマであるので,今後の課題として 検討していきたいと考えている。参考文献
Anand, S. and Ravallion, M. (1993) “Human Development in Poor Countries: On the Role of Private Incomes and Public Services,” Journal of Economic Perspectives, Vol. 7, No. 1, pp. 133-150.
Bayati, M., Akbarian, R., and Kavosi, Z. (2013) “Determinants of Life Expectancy in Eastern Mediterranean Region: A Health Production Function,” International Journal of Health Policy and Management, Vol. 1, Issue 1, pp. 65-71.
Bergh, A. and Nilsson, T. (2009) “Good for Living? On the Relation between Globalization and Life Expectancy,” World Development, Vol. 38, No. 9, pp. 1191-1203.
Castello-Climent, A. (2011) “Channels through Which Human Capital Inequality Influences Economic Growth,” Journal of Human Capital, Vol. 4, No. 4, pp. 394-450.
Chang, C. C. and Lin, C. J. “LIBSVM: A Library for Support Vector Machines,” http://www.csie.ntu.edu.tw/~cjlin/libsvm/.
CIA, “United States Central Intelligence Agency Factbook,”
https://www.cia.gov/library/publications/the-world-factbook/rankorder/ rankorderguide.html.
Credit Suisse, “Global Wealth Databook,”
http://www.cfainstitute.org/learning/products/publications/contributed/pages/ global_wealth_databook_2012_-_credit_suisse.aspx.
Desbordes, R. and Azemar, C. (2008) “Public Governance, Health and Foreign Direct Investment in Sub-Saharan Africa,” Journal of African Economies, Vol. 18, No. 4, pp. 667-709.
Doytch, N., Kelly, I. R., and Dave, D. M. (2012) “Global Health and the Economy,” Human Biology Review, Vol. 1, No. 1, pp. 100-122.
Eutimes, “The European Union Times,” http://www.eutimes.net/2009/11/iq-by-country/. FAO, “United Nations Food and Agriculture Organization Statistics Division,”
http://faostat.fao.org/site/567/default.aspx#ancor.
Fujikawa, A., Suzue, T., Jitsunari, F., and Hirao, T. (2011) “Evaluation of Health-related Quality of Life Using EQ-5D in Takamatsu, Japan,” Environmental Health and Pre-ventive Medicine, Vol. 16, No. 1, pp. 25-35.
Gallup, “Gallup Global Reports,”
http://www.gallup.com/poll/142727/religiosity-highest-world-poorest-nations.aspx#2. Grosse, R. N. and Perry, B. H. (1982) “Correlates of Life Expectancy in Less Developed
Countries,” Health Policy and Education, Vol. 2, No. 3 /4, pp. 275-304.
Holstein, A. (2011) “Public Subsidy of Health Care and Health Outcomes in OECD Coun-tries,” International Business & Economics Research Journal, Vol. 6, No. 12, DOI: 10.19030/iber.v 6 i12.3438.
ICPO, “International Criminal Police Organization Online Databases,” http://www.uia.be/s/or/en/1100039431.
ILO, “International Labour Union LABORSTA,” http://laborsta.ilo.org/. IMF, “International Monetary Fund World Economic Outlook Database,” http://www.imf.org/external/pubs/ft/weo/2013/01/weodata/index.aspx.
Jaba, E. and Balan, C. B. (2013) “The Variation of Healthy Life Expectancy and Health Expenses in Europe,” Annals of the Alexandru Ioan Cuza University Economics, Vol. 59, Issue 2, pp. 83-91.
Jagger, C., Gillies, C., Moscone, F., Cambois, E., Van Oyen, H., Nusselder, W., Robine, J-M., and the EHLEIS team (2008) “Inequalities in Healthy Life Years in the 25 Coun-tries of the European Union in 2005: A Cross-national Meta-regression Analysis,” Lancet, Vol. 372, No. 9656, pp. 2124-2131.
Jour-nal of Developing Areas, Vol. 41, No. 2, pp. 185-204.
Kim, J. I. and Kim, G. (2014) “Labor Force Participation and Secondary Education of Gender Inequality Index (GII) Associated with Healthy Life Expectancy (HLE) at Birth,” International Journal for Equity in Health, Vol. 106,
http://www.equityhealthj.com/content/13/1/106.
Lee, J-H. (2013) “The Influence of Alcohol Consumption on Income and Health: Empiri-cal Evidence from a Panel of OECD Countries,” Seoul Journal of Economics, Vol. 26, No. 2, pp. 255-282.
Mehrara, M. and Nasibparast, S. (2012) “Determinants of Health Status in Developing Countries: A Bayesian Econometric Approach,” International Journal of Social Science Tomorrow, Vol. 1, No. 6, pp. 1-7.
Minagawa, Y. (2013) “Inequalities in Healthy Life Expectancy in Eastern Europe,” Popu-lation and Development Review, Vol. 39, Issue 4, pp. 649-671.
OECD, “Organisation for Economic Co-operation and Development Statistics,” http://www.oecd.org/statistics/.
Shaw, J. W., Horrace, W. C., and Vogel, R. J. (2005) “The Determinants of Life Expectan-cy: An Analysis of the OECD Health Data,” Southern Economic Journal, Vol. 71, No. 4, pp. 768-783.
Tanabe, K., Kurita, T., Nishida, K., Lučić, B., Amić, D., and Suzuki, T. (2013) “Improve-ment of Carcinogenicity Prediction Performances Based on Sensitivity Analysis in Variable Selection of SVM Models,” SAR and QSAR in Environmental Research, Vol. 24, No. 7, pp. 565-80.
Tareque, M. I., Saito, Y., and Kawahara, K. (2015) “Healthy Life Expectancy and the Cor-relates of Self-rated Health in an Ageing Population in Rajshahi District of Bangla-desh,” Ageing & Society, Vol. 35, No. 5, DOI 10.1186/s12889-015-1640-6.
UN, “United Nations Development Program Human Development Report,” http://hdr.undp.org/en/.
WB, “World Bank World Development Indicators,” http://data.worldbank.org/indicator; “World Bank Global Development Network Growth Database,”
http://econ.worldbank.org/WBSITE/EXTERNAL/EXTDEC/EXTRESEARCH/0,, contentMDK:20701055~pagePK:64214825~piPK:64214943~theSitePK:469382,00.html. White, A. (2007) “A Global Projection of Subjective Well-being: A Challenge to Positive
Psychology,” Psychtalk, Vol. 56, pp. 17-20.
WHO “The World Health Report 2003: Shaping the future” World Health Organization, 2003.
WHO “Closing the Gap in a Generation: Health Equity through Action on the Social De-terminants of Health,” http://whqlibdoc.who.int/hq/2008/WHO_IER_CSDH_08.1_eng.pdf :一世代のうちに格差をなくそう:健康の社会的決定要因に対する取り組みを通じた健
WHO “Social Determinants of Health: The Solid Facts,”
http://www.euro.who.int/__data/assets/pdf_file/0005/98438/e81384.pdf: 健康の社会的 決定要因:確かな事実の探究第 2 版,
http://www.tmd.ac.jp/med/hlth/whocc/pdf/solidfacts2nd.pdf. WHO “Healthy Life Expectancy (HALE) at Birth,”
http://www.who.int/gho/mortality_burden_disease/life_tables/hale_text/en/. WHO “World Health Organization World Health Statistics,”
http://www.who.int/gho/publications/world_health_statistics/en/index.html.
Wilkinson, R. G. (1992) “Income Distribution and Life Expectancy,” British Medical Jour-nal, Vol. 304, No. 6829, pp. 165-168.
阿部重夫(2011)『パターン認識のためのサポートベクトルマシン入門』森北出版. 大北剛(訳)(2005)『サポートベクターマシン入門』共立出版. 小野田崇(2007)『サポートベクターマシン』オーム社. 近藤克則(2005)『健康格差社会-何が心と健康を蝕むのか』医学書院. 近藤克則(2010)「幸福・健康の社会的決定要因─社会疫学の視点から」『科学』第80巻, pp. 290-294. 杉澤秀博(2012)「健康の社会的決定要因としての社会関係:概念と研究の到達点の整理」 『季刊・社会保障研究』第48巻,pp. 252-265. 長谷川卓志(2014a)「平均寿命,健康寿命を規定する要因について─EU27カ国に関する 研究」『社会医学研究』第31巻 1 号,pp. 53-58. 長谷川卓志(2014b)「欧州連合における平均寿命,健康寿命と主観的健康感について」『日 本老年医学会雑誌』第51巻 2 号,pp. 44-150. 古川俊之(1996)『寿命の数理』朝倉書店. 古川雅一(2005)「社会経済的環境を考慮した被援助国データによる出生時平均余命及び 乳児死亡率の決定要因分析」『日本衛生学雑誌』第60巻 3 号,pp. 335-344.