Indoor Air Quality of Tottori University Lecture Rooms and
Measures for Decreasing Carbon Dioxide Concentrations
Daisuke Houri, Yousuke Kanazawa*, Ikuharu Morioka† and Kenji Matsumoto*
Division of Medical Environmentology, Department of Social Medicine, School of Medicine, Tottori University Faculty of Medicine, Yonago 683-8503, *Department of Regional Environ-ment, Faculty of Regional Sciences, Tottori University, Tottori 680-8551 and †Wakayama Medi-cal University School of Health and Nursing Science, Wakayama 641-0011 Japan
To make clear the realities of indoor air (IA) pollution in lecture rooms of Tottori Univer-sity in Japan, we studied air quality by monitoring the CO2 level, an index of IA pollution.
We changed IA environment of lecture rooms while the lecture was given by using fan-ventilation or not, and with room doors open or closed: we monitored the CO2 level at
5-min intervals during 2 or 3 consecutive 90-min lectures using an infrared ray absorption type CO2 monitor. Based on the observed levels for 90 min, we calculated the ventilation
rate (times of operating the ventilation fan), and estimated CO2 level change in ventilated
and non-ventilated rooms for a 90-min lecture with the ventilation rate. In non-ventilated rooms, the observed and estimated CO2 level exceeded the maximum of 1,500 ppm
speci-fied by the Japanese Government. The excess was irrespective of the ratio of air volume/ person in non-ventilated rooms with doors closed. During the 1-h lunch break with doors open, over 5,000 ppm levels dropped below the standard. During the lecture in fan-ventila-tion, the CO2 level was decreased to below or near above the standard. Fan-ventilation
du-ring the lecture break reduced the level nearly to that in the outside air. In the case of no fan-ventilation during the following lecture(s), the level exceeded the standard. To main-tain a clean air environment in highly airtight university lecture rooms, ventilation during lectures was crucial, which can be done effectively by the use of ventilation fans. Use of the estimated level is generally adaptive in promoting the use of ventilation fans.
Key words: air quality; carbon dioxide; school environmental health; ventilation
Cause of the sick building syndrome are mainly linked with the trend of making highly insulated airtight houses, which lowers the amount of natural ventilation (Iwashita et al., 1997). As other causes, generations of volatile organic compounds and for-maldehyde were reported (Hays et al., 1995). The key index of indoor air (IA) pollution is the CO2
concentration. If the indoor CO2 level is high, the
risk of the sick building syndrome rises (Gupta et al., 2007). The degree of contamination of IA quality can be evaluated by measuring CO2 levels.
Appropriate room ventilation is necessary to main-tain an appropriate environment for IA or to decre-ase the level of toxic chemical substances.
In many elementary schools, window frames in classroom doors and walls facing the hallway are made of wood and poorly fitted, so that elementary schools have no airtight rooms, and generally use natural ventilation. In contrast, university lecture rooms with highly airtight steel-made doors are equipped with ventilation fans and depend on ar-tificial ventilation. In Japan, however, we have no
standardized regulation in fan-ventilating: ventila-tion is not especially recommended, and the opera-tion is left up to room users. The frequency of IA pollution increases in summer and winter, because of the above-noted few ventilation times partly to save energy and to maintain air-conditioned effects. In addition, the IA pollution occurs more easily in school than in office because of the population density (Clements-Croome et al., 2008). Because no major problems arise as a result of ignoring air quality, this tends to be forgotten as an important aspect of school life (Griffiths and Eftekhari, 2008). The air quality has been studied on elementary schools and residential houses (Shaughnessy et al., 2006; Kinshella et al., 2001), but little on university lecture rooms, due to the difference in ventilation methods and air volume. From the viewpoint of study and health for university students, we inve-stigated IA pollution in Tottori University lecture rooms by measuring CO2 levels continuously, and
discussed possible countermeasures to deal with observed problems.
Materials and Methods Measurement sites
CO2 levels in non-ventilation were monitored in
Periods 4 and 5 on 12 Dec. 2007 in Room X (Tottori University Faculty of Agriculture) and from
Pe-riods 2 to 5 on 14 Dec. 2007 in Room Y (Tottori University Faculty of Engineering). We chosen Rooms X and Y, because the rooms were conse-cutively used for 2 periods or longer at that time of the year, because the rooms could hold students to the rooms’ full capacity and because the rooms were newly installed with total heat exchange type ventilation fans after rebuilding in 2003. CO2
levels in ventilation were monitored in the same rooms at the same Periods 1 week later.
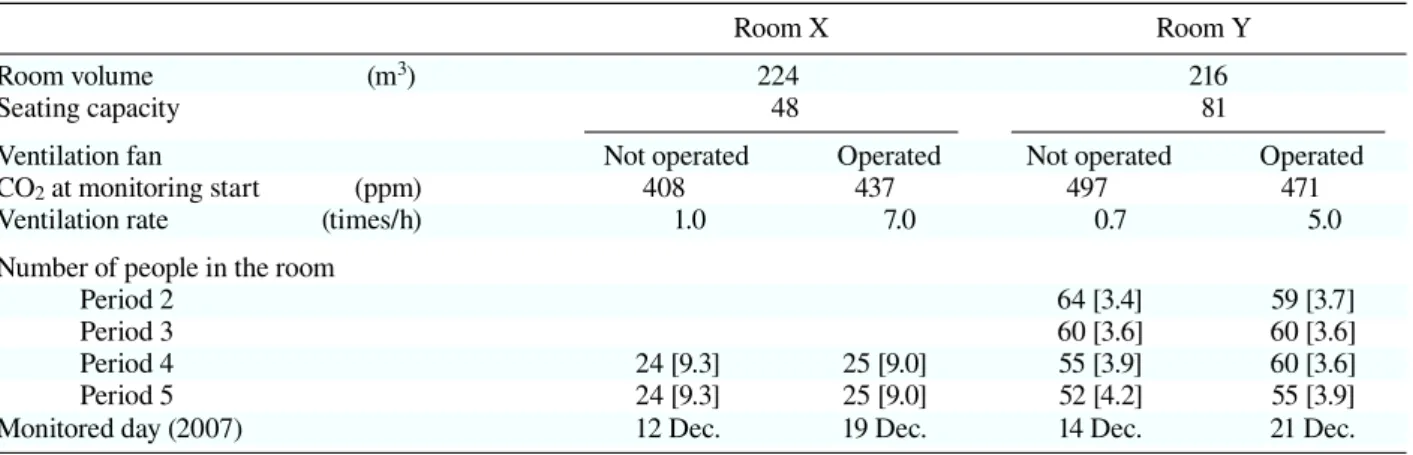
The volume and seating capacity of lecture rooms are described in Table 1. The openness or closeness of room doors and fan-ventilating or not on the monitored days were also recorded. In-door and outIn-door temperatures were continuously measured with a temperature humidity data logger (TH-101, Micro Techno, Kawasaki, Japan). The indoor temperature was measured at the same sites as the CO2 level was monitored, and the outdoor
temperature, on the outside stairs on the 2nd floor of the Faculty of Regional Sciences building.
CO2 level monitoring
An infrared absorption type CO2 monitor (Telaire
7001, Onset Computer, Pocasset, MA) (measuring range: 0–10,000 ppm, accuracy: ± 50 ppm) was set up at desk-top height in the center of each room, and the CO2 level was continuously monitored at
in-tervals of 5 min throughout the period. CO2 levels
in the rooms before the monitoring start had been
Table 1. Characteristics and usage of monitored rooms with CO2 levels at monitoring start
Room X Room Y
Room volume (m3) 224 216
Seating capacity 48 81
Ventilation fan Not operated Operated Not operated Operated
CO2 at monitoring start (ppm) 408 437 497 471
Ventilation rate (times/h) 1.0 7.0 0.7 5.0
Number of people in the room
Period 2 64 [3.4] 59 [3.7]
Period 3 60 [3.6] 60 [3.6]
Period 4 24 [9.3] 25 [9.0] 55 [3.9] 60 [3.6]
Period 5 24 [9.3] 25 [9.0] 52 [4.2] 55 [3.9]
Monitored day (2007) 12 Dec. 19 Dec. 14 Dec. 21 Dec.
raised because of the previous lecture use, and so we started monitoring after CO2 levels fell to about
450 ppm. Following the monitoring in the lecture time, we continued monitoring until 9:00 AM on the next day, and attenuated CO2 levels were used
to calculate the ventilation rate (times of operating the ventilation fan) in after-school sealed rooms.
Calculation of the ventilation rate
The ventilation rate when the rooms were sealed was calculated with the CO2 data observed from
the lecture end to 9:00 AM on the next day, using the formulae (1) and (2) noted below (Pharma-ceutical Society of Japan, 2000): the ventilation rate when the rooms were fan-ventilated, using the formulae (2) and (3) (Pharmaceutical Society of Japan, 2000). The ventilation fan we used in each room was the total heat exchange ventilator with the air amount set to low to avoid the run-ning noise. The runrun-ning noise was measured with a Sound Level Meter NA-20 (Rion, Tokyo, Japan) at 30-min intervals for 5 min. The students were given lectures on general education. Most were se-ated at the beginning of the lectures and sat quietly during class. The number of people in a room was not changed excepting a few latecomers and those who left early. We assumed the number of people in the room or metabolic rate not changed, and analyzed the CO2 level generated by students
them-selves, with reference to the “Standards for School Environmental Sanitation” (0.022 m3/h) (Ministry
of Education, Culture, Sports, Science and Techno-logy of Japan, 2004). Ct = C0 + (l – e–Et) M 100 Vt Vt = VR t E V = 2.303 VR log C1 – C0 t Ct–C0 V = M 100 Ct – C0 E = V VR
where C0, CO2 level of air entering from outside
(%); C1, CO2 level of IA at a monitoring start (t = 0)
(%); Ct, average CO2 level of IA after time t (%); E,
ventilation rate (times/h); M, amount of CO2
gene-rated indoors (m3/h); t, elapsed time between a
mo-nitoring start and the next start (h); V, amount of ventilation (m3/h); VR, room volume (m3); Vt, total
amount of ventilation for time t (m3).
Estimation of CO2 levels
To make clear the CO2 level change during a
lec-ture over 90 min, we calculated the estimated levels with the formulae (4) and (5) (Pharmaceutical Soci-ety of Japan, 2000), at 5-min intervals according to the ventilation rate in ventilated or non-ventilated rooms.
Results
Table 1 shows fan-ventilating conditions, CO2
lev-els, number of people in the room and ratio of air volume/person classified by room.
Usage of Room X on monitored days
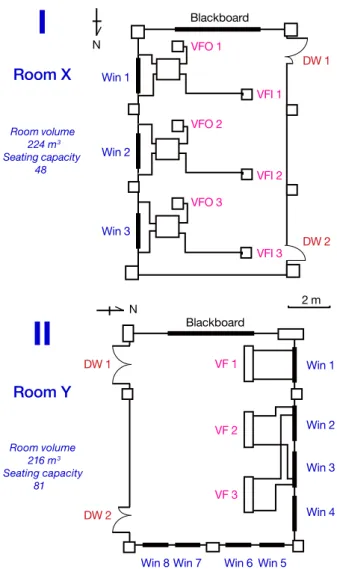
Figure 1-I shows the schema of Room X, where we monitored during Periods 4 and 5. The lecture on monitored days took 2 full periods, and no students entered or left as the lecture went on: breaks be-tween lectures were different from the usual. On 12 Dec. when Room X was not ventilated, the lec-ture break was from 16:35 to 16:45: this class was a laboratory class, and doors were often opened and closed. On 19 Dec. when Room X was venti-lated, the lecture ended at 16:40 without break.
Level change in Room X
Figure 2 shows changes in non-ventilated Room X (12 Dec.) and ventilated Room X (19 Dec.). This figure also shows openness or closeness of room doors, and ventilation or non-ventilation in door-way areas. Indoor CO2 levels at the monitoring
………… (1) ……… (2) ……… (3)
……… (4) ………… (5)
(time) (ppm) 14:00 15:00 16:00 17:00 18:00 0 1000 2000 3000
A
B
A
B
DW 1 DW 2 DW 2 VF 15:00 14:00 16:00 17:00 18:00 Period 4 Period 5 4000Fig. 2. Changes in CO2 levels monitored in Room X. A: not fan-ventilated. B: fan-ventilated. : fan-ventilated with doors open. DW, doorway; VF, ventilation fan.
start were 408 ppm on 12 Dec. and 437 ppm on 19 Dec. (Table 1). On 12 Dec., the CO2 level in
non-ventilated Room X began to rise from the lecture start (14:40), exceeded 1,500 ppm at 15:15 and con-tinued to rise. It dropped slightly during the break (16:35–16:45), but rose to 3,070 ppm at 17:20 when the laboratory class began. Thereafter, the level decreased in doorway areas as students frequently entered or left. At 17:50 when the class ended on 12 Dec., the level was 2,154 ppm and the outdoor CO2 level was 398 ppm. On 19 Dec., the CO2 level
in ventilated Room X rose from the lecture start (14:40), and reached 883 ppm 10 min later. By the lecture end (16:45), the level had increased by 750 ppm but did not exceed 1,500 ppm. The outdoor CO2 level on 19 Dec. was 403 ppm. The
ventila-tion rate was 1.0 time/h for after-school sealed Room X and 7.0 times/h for ventilated Room X (Table 2).
Usage of Room Y on monitored days
Figure 1-II is the schema of Room Y. During Pe-riods 2 to 5, CO2 levels were monitored in
non-ventilation on 14 Dec. and in non-ventilation on 21 Dec. There were about 60 people on both days (Table 1). During the lunch break, 4 to 20 people seated be-tween 12:00 and 12:40, and about 20 to 60 people between 12:40 and 13:00.
Level change in Room Y
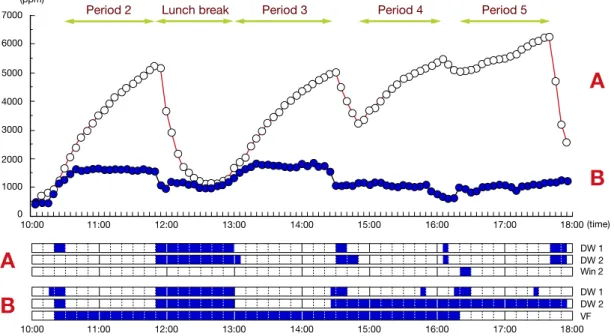
Figure 3 shows changes in Room Y on 14 Dec. when the room was not ventilated and on 21 Dec. when it was ventilated. Figure 3 also shows changes when the doors were open or closed, with ventilation or non-ventilation in doorway areas. The indoor level in non-ventilated Room Y was 497 ppm at 10:05 when the monitoring was started (Table 1). The students enterd the room immedi-ately after the monitoring start. At 10:30, the level exceeded 1,500 ppm, and at 11:50 (end of Period 2) reached 5,248 ppm. During the lunch break (11:50–13:00), Doorways 1 and 2 were opened, and the level was quickly dropped to 1,144 ppm. At 13:00, Period 3 began and the level rose again,
Fig. 1. Schemas of lecture rooms. I: Faculty of Agriculture
Room X. II: Faculty of Engineering Room Y. DW, doorway; VF, ventilation fan; VFI, VF inlet; VFO, VF out-let; Win, window.
and at 14:30 (end of Period 3) reached 5,036 ppm. Between 14:30 and 14:40 (break between Periods 3 and 4), Doorways 1 and 2 were opened. Till 14:50 Doorway 2 remained open even after the start of Period 4, and the level decreased to 3,273 ppm. However, once Doorway 2 was closed, at 16:05 (end of Period 4) it rose again to 5,312 ppm. Between 16:20 and 16:30, after Period 5 began, Window 2 was 25% open, and the level rise was slowed. Once Window 2 was closed, the level increase became more rapid, and at 17:40 (end of Period 5) reached 6,276 ppm. Between 17:40 and 17:55 (end of monitoring), Doorways 1 and 2 were intention-ally opened, and the level was decreased to 2,601 ppm.
The indoor level in ventilated Room Y was 471 ppm at 10:05 when the monitoring was started (Table 1). From 10:15, the level began to rise as the number of people in Room Y increased, and at 10:40 reached 1,653 ppm. By 11:50, the level changed to about 1,600 ppm (end of Period 2). During the lunch break, Doorways 1 and 2 were opened, and the level dropped to 1,100 ppm. At 13:00 (start of Period 3), Doorways 1 and 2 were closed, and by 14:25 the level reached 1700 ppm (end of Period 3). From 14:40 (start of Period 4),
Doorway 2 was open, and the level was decreased to about 1,050 ppm. Between 15:45 and 16:10, the level was further decreased to 650 ppm because the sources of CO2, students and teacher, moved to
another room and were gone. From 16:20, ventila-tion was stopped for Period 5. But by 17:55 (end of monitoring), the level was changed to 1,100 ppm, because Doorway 2 was open. We calcu-lated the ventilation rate in Room Y as 0.7 time/h in non-ventilation, 5.0 times/h in ventilation and 8.7 times/h in ventilation with Doorway-2 open (Table 2).
Change in estimated levels
We figured changes in the presently observed and theoretically estimated CO2 levels during the
lec-Fig. 3. Changes in CO2 levels monitored in Room Y. A: not fan-ventilated. B: fan-ventilated. : fan-ventilated with doors open. DW, doorway; VF, ventilation fan; Win, window.
Table 2. Ventilation rate and room ventilation
Ventilation rate (times/h)
Room X Room Y
Observed in non-ventilation 1.0 0.7 Observed in ventilation 7.0 5.0 [8.7] Estimated by the formulae 2.2 5.6 [ ], at Doorway 2.
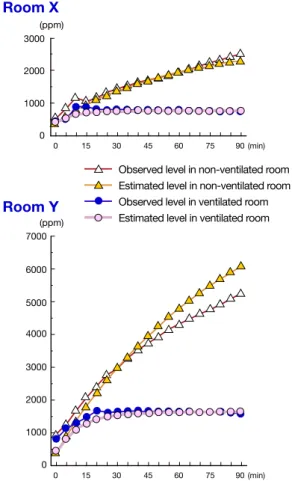
ture time over 90 min by room. The levels were based on the ventilation rates at 5-min intervals in ventilated and non-ventilated rooms (Fig. 4). The estimated value in non-ventilation at the end of the 90-min lecture was 6,075 ppm in Room Y and 2,307 ppm in Room X; while the observed value, 5,248 ppm in Room Y and 2,513 ppm in Room X. The estimated value in ventilated Room X fluctu-ated around 750 ppm 20 min after the lecture start, and was still 750 ppm 90 min later. The estimated value in ventilated Room Y fluctuated around 1,600 ppm 20 min after the lecture start, and was 1,621 ppm 90 min later.
Noise level
In non-ventilation, the noise level was 38 to 40 dB in Room X and 36 to 38 dB in Room Y. In venti-lation, the noise level was 40 to 42 dB in Room X and 38 to 40 dB in Room Y.
Discussion
In 2002, the Ministry of Education, Culture, Sports, Science and Technology of Japan deter-mined the standards for school indoor chemical substance density by revising the Standards for Environmental Hygiene in School (Ministry of Education, Culture, Sports, Science and Technol-ogy of Japan, 2002). The 2002 revision has recom-mended air quality control by checking the CO2
density and ventilation rate twice a year. Most school classrooms in Japan have natural ventila-tion. The revision demands 0.15% (1,500 ppm) or less as the preferable level, and fixes standard ven-tilation times for classrooms. On the other hand in 1970, the Ministry of Health, Labour and Welfare of Japan established CO2 standards for keeping
contaminants (CO2, formaldehydes and suspended
particles) below standards, 0.1% (1000 ppm) by the Law for Maintenance of Sanitation in Buildings (Japanese Government, 1970): the Law stipulates evaluation of IA quality and degree of IA pollution.
The above standards are for the overall index of IA quality, not based on CO2 effects on health, but
Fig. 4. Observed and estimated CO2 levels in ventilated and non-ventilated Rooms X and Y. Room conditions for calcu-lating estimated values were 0.022 m3/h/person, 400 ppm as CO2 of the indoor air at the monitoring start and 400 ppm as CO2 of the air entering from outside.
based on increase of other contaminants estimated to be in parallel with the increase of CO2 over 1,000
ppm. Indoor CO2 is increased by students’ exhaled
air. When the indoor level is high, it is assumed that the room is not ventilated. As the result of non-ventilation, oxygen is decreased, suspended particles are increased, bacteria are increased and body odor gets severer for students to be annoyed about unpleasant smells (Takahashi, 1982; Ministry of Education, Culture, Sports, Science and Tech-nology of Japan, 2004). On the other hand, 5,000 ppm has been determined as a permissible level by the Japan Association of Industrial Health and the American Conference of Governmental Industrial Hygienists (Araki, 1990; American Conference of Governmental Industrial Hygienists, 2007). The CO2 level observed in the non-ventilated rooms far
exceeded 1,500 ppm, the limit determined at the “Standards for School Environmental Sanitation”. Sometimes the level exceeded 3,000 ppm in Room X and 6,000 ppm in Room Y.
The CO2 level, an index of IA quality, is
in-fluenced by the ratio of air volume/person and ven-tilation rate. The ratio of air volume/person was higher in Room X than Room Y. Accordingly, the CO2 level in non-ventilated Room X should have
been lower than in non-ventilated Room Y. How-ever, in the case of no ventilation, the level was kept above the standard in either room. We think that the highness was due to the sealed nature of the room during leture: the doorways were open only when the teacher and students entered for class or exit after class, as in the same way during the break. Moreover, room doors were opened during the break for coming-in and going-out of students, and open-door ventilation decreased the high CO2 level. When doors were kept open in
Room Y between 12:00 and 13:00, over 5,000 ppm CO2 was decreased to below the standard. The
ef-fect of natural ventilation by opening room doors impacted.
As observed, when rooms were not ventilated, CO2 attained a high density, and we fully realized
the need of fan-ventilation. It is preferable to mea-sure by every room to know actual conditions, but we cannot monitor many rooms with the present method. This is the reason we tried to estimate the measurements using the theoretical formulae. The estimated level as well as the observed level ex-ceeded the standard of 1,500 ppm in non-ventilated rooms. The final CO2 level differed according to
the ratio of air volume/person; however, when the lecture room was sealed over 90 min, it was dif-ficult to keep the level below standard regardless of air volume. In estimating and observing the levels, we started by setting the the initial indoor level as 400 and 450 ppm, respectively. But, both levels exceeded the standard within 90 min. Even if the CO2 level was adjusted to below the standard
dur-ing a break, in the case of no ventilation durdur-ing a lecture, IA quality must be negatively affected and high-level air pollution would result. Accordingly,
to keep IA clean, it is important to ventilate the lec-ture room during the leclec-ture. The estimated levels were higher for Room Y than Room X both in ven-tilation and non-venven-tilation, presumably because the number of students in Room X was smaller than Room Y. The estimated levels higher than the observed in non-ventilated Room Y may be caused by ventilation taking place in Room Y by the open-ings and closopen-ings of doors.
The CO2 level in ventilated rooms with doors
closed was kept below the standard of 1,500 ppm in Room X, and slightly higher than the standard in Room Y. In considering these facts, ventilation of rooms can keep the CO2 level below or near the
standard, by which IA pollution would be reduced. The shift of estimated levels in ventilated rooms was similar to that of the observed, keeping below or slightly higher than the standard. In keeping IA clean in highly airtight university lecture rooms, it is important to ventilate the room during lecture by opening classroom doorways or by fan-ventilating. We observed that ventilation through opening doors had a large effect. However, opening doors introduces outside air directly indoors, and no tem-perature or amount of wind of the inflowing air can be controlled. We did not investigate the influence of opening doors on indoor thermal environment in the present study. We cannot expect that opening doors keep the environment within the comfortable range. Furthermore, when rooms are air-condi-tioned in summer and winter, ventilation by open-ing doors is not preferable also from the energy-saving aspect.
In contrast, ventilation by using ventilation fans can ensure a constant amount of ventilation. Accordingly, in the present study, we observed no rapid level change, but little change below the stan-dard or near above. In the case of using ventilation fans, however, the influence on the indoor tempera-ture and the amount of running noise will arouse concern. In the present study, the heat temperature setting for lecture rooms was fixed, and we could not confirm effects of ventilation on the thermal environment. By the way, the heat exchange type ventilation fan we used here can supply outside air
by exchanging the temperature close to the room temperature, and so it can ventilate without los-ing thermal energy by heatlos-ing and air condition-ing (Japan Electrical Manufacturers’ Association, 2007). The running noise when ventilation fans were operated exerted no influence on lectures, because the noise met the standard of 50 dB or less determined by the “Standards for School Environ-mental Sanitation”.
References
1 American Conference of Governmental Industrial Hy-gienists (ACGIH). Guide to Occupational Exposure Val-ues 2007 TLV (Threshold Limit ValVal-ues). Available from: URL: http://www.acgih.org/TLV/ [cited 2007 Dec 10]. 2 Araki S, Numata M, Wada O, eds. Kankyo Kagaku Jiten
[Encyclopedia of environmental science.] Tokyo: Tokyo Kagaku Dojin; 1990. p. 597 (in Japanese).
3 Clements-Croome DJ, Awbi HB, Bakó-Biró Zs, Kochhar N, Williams M. Ventilation rates in schools. Building and Environment 2008;43:362–367.
4 Griffiths M, Eftekhari M. Control of CO2 in a naturally ventilated classroom. Energy and Buildings 2008;40:556– 560.
5 Gupta S, Khare M, Goyal R. Sick building syndrome—A case study in a multistory centrally air-conditioned build-ing in Delhi City. Buildbuild-ing and Environment 2007;42: 2797–2809.
6 Hays SM, Gobbell RV, Ganick NR. Indoor air quality: solutions and strategies. New York: McGraw-Hill Educa-tion - Europe; 1995.
7 Iwashita G, Sakamoto M, Akasaka H. Pilot study on the occupancy condition and the time fluctuation of ventila-tion rate and indoor air polluventila-tion in the housing complex
during summer season. J Archit Plann Environ Eng 1997;501:93–99.
8 Japan Electrical Manufacturers’ Association. Reidanbo Koka Ga Sokonawarenikui Kankisen [Structure of ven-tilation fans for the minimum loss of air-conditioning effects.] Available from URL: http://www.kanki-day.jp/ papa/papa_01_04.html [cited 2008 Apr 8] (in Japanese). 9 Japan Society for Occupational Health.
Recommenda-tion of occupaRecommenda-tional exposure limits (2004–2005). J Occup Health 2004; 46:329–344.
10 Japanese Government. 304th Government Ordinance [A law enforcement order about hygienic environmental se-curity in buildings.] Kanpo 1970; Oct 12 (in Japanese). 11 Kinshella MR, Van Dyke MV, Douglas KE, Martyny JW.
Perceptions of indoor air quality associated with ventila-tion system types in elementary schools. Appl Occup Environ Hyg 2001;16:952–960.
12 Ministry of Education, Culture, Sports, Science and Technol-ogy of Japan. [Standards of school environmental hygiene.] Tokyo: National Printing Bureau; 2004 (in Japanese). 13 Ministry of Education, Culture, Sports, Science and
Tech-nology of Japan. [On the revision of the “Standards of school environmental hygiene”.] Available from URL: http://www.mext.go.jp/b_menu/houdou/14/02/020202.htm [cited 2007 Dec 10] (in Japanese).
14 Pharmaceutical Society of Japan. Eisei shiken ho: chukai 2000 [Hygiene docimasy: an explanatory note 2000.] To-kyo: Kanehara; 2000. p. 1005–1008 (in Japanese). 15 Shaughnessy RJ, Haverinen-Shaughnessy U, Nevalainen
A, Moschandreas D. A preliminary study on the associa-tion between ventilaassocia-tion rates in classrooms and student performance. Indoor Air 2006;16:465–468.
16 Takahashi E. Kankyo eiseigaku gairon [Introduction to environmentology.] Tokyo: Nanzando; 1982 (in Japanese).
Received September 4, 2008; accepted March 31, 2009 Corresponding author: Daisuke Houri, PhD