STUDIES ON T H E PRODUCTION AND THE SALT
BALANCE IN RELATION T O CALCIUM
PWOSPHOCASEINATE OF ABNORMAL MILK
Toyoki
MIYABE
(Laboratory of Animal Products Technology)
CONTENTS
Page
1
.
Introduction...
2Occurrence of abnormal milk
...
2Definition of abnormal milk
...
3Historical review of the investigations
...
32
.
Gross composition of abnormal milk...
...
...
53
.
Variation of f a t content in cow's milk in lactation period (Effect of temperature and humidity in the summer season )...
6...
Part 1.
Variation of fat content of normal milk..-
6Part 2
.
Variation of f a t content of abnormal...
104
..
Protein and its distribution of nitrogenous components in abnormal milk...-..
...
125
.
Blood constituents in relation to calcium and phosphorus in abnormal milk..
-
...
156
.
Distribution of calcium and phosphorus between dissolved and colloidal phases in abnormal milk...
19Part 1
.
Dialysis experiment...
19Part 2
.
Rapid pressure ultrafiltration experiment...
247
.
Comparative diagram of distribution of calcium and phosphorus between dissolved and colloidal phases in normal and abnormal milks ...a....
278
.
Composition of calcium-phosphocaseinate complex in abnormal milk...
299
.
Salt balance of abnormal milk with special reference to the effect of Part 1.
The first experiment...
34Part 2
.
The second experiment...
4010
.
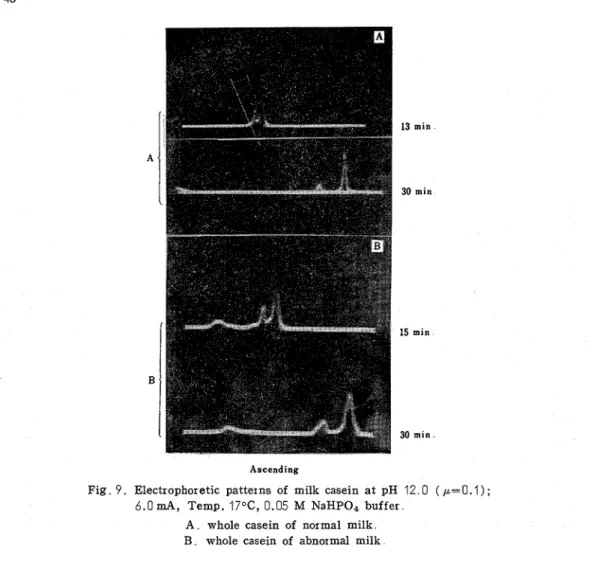
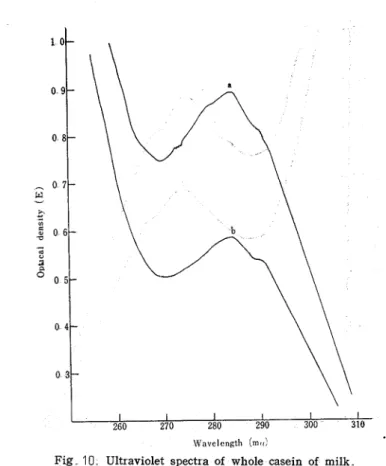
Chemicophysical properties of casein in abnormal milk...
4711
.
Biological value and digestibility of casein in abnormal milk using rat...
...
5112
.
Digestibility and dephosphorylation of a - andP -
caseins of abnormal milk with enzyme...
5513
.
Curd tension and balance of calcium and phospho~us in abnormal milk...
..
...-.-
a . 0 65 14.
Properties of soluble products in coagulation of a - andP -
caseins of ab- normal by action of pepsin...
7415. Effect of vitamins K , D, and C on milk stability
...
81 16. Conclusion...
83 Acknowledgement...
85 Literatures...
85 Summary in ,Japanese...
,...
,871.
INTRODUCTIONMilk has a very complex composition. Some of its constituents, such as milk sugar and casein are not found elsewhere, either in body or in nature. The most abundant protein in milk is casein, the part of milk which is coagulated by rennet or acid. Casein is comprised up to about 7% % of total protein in milk and employed profitably as an important constituent for the making of dairy products. The aim of this treatise is to give some of the informations that have as yet been unknown on the problems of the nutritive values and of the milk stability, which is concerned with salt balance and the composition of calcium phosphocaseinate in abnormal milk. The name "abnormal milk" in this paper indicates positive milk which coagulates by means of alcohol test even in fresh condition soon after milking. The term of this type of abnormal milk is more iully discussed in the later section. The various constituents in milk are present in the three phases of solution, colloidal dispersion, and emulsion. Above all, the content of certain salts in milk is greater than can be maintained in solution, but lather in large colloidal particles containing protein and also small quantities of calcium and phosphate. They are commonly refer red to "calcium phosphocaseinate" or "calcium caseinatephos
-
phate." Calcium, phosphate, magnesium, and citrate ions in milk serum interfere with these caseinate particles in colloidal suspension The mutual aid system, salt balance in a good condition has been said to preserve stable particles for alcoholic reaction or heat treatment.Occurrence of abnormal milk
Everyone has long been aware of the fact of producing a positive milk by some origin which is unknown enough to any. There has been found the appearance of positive milk in the rainy season of June when pathogenic organisms are apt to multiply. This rainy season, especially if the milk container is wet in the rain, may let drops of water which carry dirt and bacteria fall into it. After World War
a ,
the dairy industry has made progress rapidly in Japan. In 1959, the number of cattle came to about 73,1090 heads, roughly corresponding to ten times as many a s that of prewar days.I t is estimated in 1964 that there are about 1,238,000 cows in our country Then. as the production of milk has developed with further recognition on the nutritive value of milk as food, problems have arisen which have occurred eve1 ywhere considerable number of abnormal corns because of lacks of good concentrate and roughage. To determine the purchase price of milk from the practical dairymen, t h e alcohol test and the Gerber f a t test are practised in milk plant and dairy factory and the positive milk is dealt with at
moderate prices in grade of the second class. In respect to this abnormal milk, there- fore, the need for intensive research has appeared to be urgent because of the economic elevation of practicing dairymen or the improvement of the quality of dairy products.
Definition of a b n o r m a l milk
In the present time, there is some disagreement regarding the terminology of positive milk and the confusion has been happened by diverse terms employed in the field of dairy science. MAENO(') reviewed the work on the problem of abnormal milk to 1957, in which its definition was involved. He classified them into six categories: (1) Physiological abnormal milk (Colostrum, Late-lactation milk, and Parturient milk), (2) High acidic milk, (3) Adulterated milk, (4) Low-composition milk, (5) Bacteriological milk, (6) Normal acidic and alcoholic positive milk. YOSHIDA'~) classified roughly under two large divisions as
(1)
Mastitic milk and (2) Second-class milk, from the standpoint of bacteriology. Further
-
more, this mastitic milk was grouped as bacteriological and non-singular mastitic. Now non-singular mastitic milk means the one which varies temporarily by the effect of virus and the variation of external circumstance. In a narrow sense, abnormal milk indicates all kinds of milk which are not suitable for drinking and processing. As definition, i t is relatively easy to distinguish it f ~ o m normal milk. Also in a wide sense, abnormal milks, such as colostrum, low-composition milk, adulterated milk and others do not always show positive reaction by alcohol test. Table 1 indicates the present author's private plan. And then the present author divided them into three stages, the physiological, the bac- teriological, and the specific, and tried to make a more precisely classified list.Classification of abnormal milk (By the present author)
Abnormal milk
Physiological Nor ma1 acidic. and alcoholic
positive milk
Low -composition milk High acidic milk Low acidic milk {Mastitic milk
Bacteriological
Other bacteriological milk Adulterated milk
Par turient milk
The word Non-singular milk means the one which is secreted pe~iodically with
a normal function, and Singular milk irregularly with an abnormaI function
Historical review of t h e investigations
According to many works reported until recently, seven theories may be enumerated below : that is, (1) Acidosis theory, (2) Abnormal fermentation of rumen, (3) Functional
abnormality of mammary gland, (5) Feed theory, (6) Inflammation of liver,
(7)
Effect of external environment. WEINER~~) reported that the occurrence of abnormal milk was caus- ed by the mouldy silage which grew in the bottom of silo and ESCHENIQUE(~) observed that its production was due to the supplementation of a great amount of Xanthine Cava- nilliese (a kind of composite plant), but it might probably be due, as this roughage itself did not harm cows, to an increase of calcium content in milk. According to SEEKLES and SMEETS(", the composition, pH, and bacterial count of positive milk were much the same at any point as compared with those of normal milk. However, this cause was presumed to be largely due, in his opinion, to the salt unbalance resulted from the increase of ion-calcium in milk. BOOGAERDT~~) found it increase ion-calcium in positive milk which was in good agreement to this fact. An occurrence of a lot of abnormal cows was re- ported by MAENO('), which happened in the winter season in Hokkaidb district lacking the green roughage and was due to the sudden change of ration supplied. The change in the amount of mineral, especially an increase of calcium content in positive milk was reported by AUZINGER,(~) whereas an increase of sodium content in this milk by KAMATANI e t a1 (9) Also AKAMATZU and co-worker~('~) found sodium amount equal to about two timesits amount of normal milk. And then SATO and MURATA(") have proposed the acidosis theory ; namely, abnormal cow was deemed to be, according to their opinions, originated from acidosis, whose blood practically gave high contents of organic phosphorus and sod- ium, though it looked in appearance quite healthy. At the same time, this was low in the contents of inorganic phosphorus, calcium, potassium, and blood sugar. Moreover their works suggest that the degree of acidosis was in concord with positive reaction of milk and also the amounts of acetone body had some correlation between blood and milk.
On the other hand, it has been said by HIGAKI('~) that the positive milk was caused by ketosis which gave gastroentric and reproductive disorders, and simultaneously brought about the over -accumlation of acetone body and hypoglycemia. In the critical review of MAENO,(') the statement of Bergma has been written in which the disorder of digestive organ was accompanied' by the depression of casein number without changing the total protein content. The use of the distilled dry grain (D.
GI
as a curative means of ketosis, according to IwATA,('~) was with considerable effect, where the supplementation of 30%D. G to cows af ter parturition markedly caused the decrease of acetone body in blood and the increase of blood sugar. It has been stated by IIZUKA"~) that positive milk was with- out variation as to protein, fat, and lactose contents, but it contained more ion -calcium and less calcium.
Studies conducted by ~ H A R A ( ' ~ ) have indicated that when alcoholic reaction was positive, dialyzable calcium in blood tended to increase in concentration, while calcium and milk acidity to decrease. Hereupon the trend of increasing ion-calcium seems to have been common to some of the reports as can be seen till now. From the study of SEEKLES,('~) there appeared to have no any relation between latent mastitis and alcoholic positive milk examined by pH, bacterial count and others. We have had several reports on curative means for abnormal cows, but their effects as remedical medicine are not such that we
can use them with certainty a t present. IIZUKA('~) reported the results of injection of thyroxin to abnormal cows, which suggested that the degree of positive reaction of milk reached maximum after 12 hours and declined gradually after 36 to 60 hours, and in this case, there was no marked change in calcium content in milk, but the entrance and exit of calcium turned negative with increase of calcium in urine and faeces. On the other hand, MAENO(") has recommended the use of tricalcium phosphate a s bone meal, in which the amount of 3 to 5
%
in feedstuff supplied a day was the most effective to abnormal cows. And also the dose of potassium iodide of 20 to 30 g per head per day is sometimes likely to serve a s curative medicine.Let me add a few more words in conclusion. I n the postwar period we have seen re- markable and revolutionary change in dairy development in Japan. We cannnot but wonder a t the great increase seen of late years in the number of cows, although it matters little when compared with the United States and some European countries. Japan is not a dairy land from the first, but is a small island whose whole area is occupied for the most part with precipitous mountain region. There are few, in our country , vast grazing lands abundant in nutrious soiling crops and usually cows have been housed in narrow barns with the restricted exercise and by the supplementation of weeds growing on the ridges among rice-fields. I t is quite reasonable that in such the unfavourable condition, cows should be apt to give positive milk all over Japan. Accordingly, during the last twenty years, the appearance of abnormal cows has demanded prompt investigation in the field of dairy science because of the economic advancement of practicing dairymen and the improvement of the quality of milk and milk products.
As a matter of fact, very few series of publication pertaining to abnormal milk giving positive reaction by alcohol test even in fresh condition soon after milking have been made up to this time. In this publication, therefore, are given data elucidated a s to the problems of subject that have remained unknown until now a s described above. This treatise of abnormal milk includes the nutritive values, and the distribution of calcium and phosphorus between the dissolved and colloidal phases, which is practically concerned with milk coagulation. I t is hoped that this publication will be of value and help to the dairy scientist a s well a s to all those who are interested in milk and dairy products.
2. GROSS C0MPB)SITIQN OF A B N O R M A L MILK
Composition of samples of normal and abnormal milks which were all in the period of
3 to 5 months of successive lactation and while were within the normal range of 14.5 to
?8.5
except Nos. 1 and 2 of abnormal milk giving a strong positive, is given in Table2. Positive milk, abnormal milk gave suggestive data high and low in the f a t content as if there was some fluctuation in successive lactation period.
The results of the variation of fat content made a s the supplementary experiment are shown in the following Section 3. With the exception of fat content, other composition such a s protein, lactose, ashes, calcium, and phosphorus all did not show any marked difference among positive, semi-positive, and normal milks. Generally the ratio of the
TABLE 2.
T h e gross composition of abnormal milk
Milk Fat Protein Lactose Ash Ca P Milk Alcohol
No % % % % % acidity test Group % - - 3 7 340 485 066 0.088 0069 112
4-
Abnormal 1 8 364 472 080 0100 0071 110-k
milk 2 4 334 535 077 0123 0077 185+
Av 2 6 346 497 074 0104 0072 136+
Normal milk'
1 3 2 5 80 4 63 0 79 0 090 0 082 14 5 +.Milk acidity is represented a s the ml of 0 1 N NaOB solution consumed to neutralize the 100 ml of raw milk with phenolphthalein a s indicator
Semi-abnor
-
chloride- lactose number, according to KOESTLER, has a value of 1 .5 to 3.0 for normal milk,
but the chloride increases and the lactose decreases in mastitis or in the latter lactation period. As such, from this fact of no variation of lactose, we will have to distinguish abnormal milk, i . g
.
normal acidic and positive milk from mastitic milk, a s has also been proposed by MAENO("'. The work('*) in this section was published in Tech. Bull. Fac. Agr.
Kagawa Univ. 2 2 9 295 532 072 0097 0068 165*
3 3 5 421 489 075 0097 0062 190 t- 4 3 3 278 525 069 0102 0067 172 k Summary ma1 milk1
3 0 318 442 072 0107 0073 185 k 31 290 458 067 0097 0071 155*
3 2 350 493 076 0117 0081 160 t- 3 2 362 486 073 0101 0072 168 IThis section presents the composition of a b n o ~ m a l milk about which the study was initiated to find a hold. Except f a t content, no marked difference was found in protein, lactose, ashes, calcium, and phosphorus contents among abnormal, semi- abnor mal, and normal milks a t this time.
3.
VARIATION O F PAT CONTENT IN COW'S MILK IN LACTATION PERIOD ( Effect of Temperature and Humidity in the Summer Season)Part
1 .
Variation of fat content in mormal milkRather pronounced seasonal variations occur in the composition of milk, a t least in the hot summer season in Japan Above all, the fat content exhibits a distinct seasonal trend, being higher in winter than in summer. In this section, the following investigations
were carried out to elucidate the effects of temperature and humidity in summer -time on fat content in milk, especially in relation to abnormal milk.
Materials and Methods
The data obtained in the neighbourhood of this university of Kagawa-ken area during the summer in 1956 and while from thi~teen normal cows of Holstein that had been housed within the limit of about 2.5 km of the point of observation, are presented in these Tables and Figures.
The data of the meteological observations were those made in the laboratory of irriga- tion and drainage. At the same time, the present author wishes to express the gratitude to Dr. T . MAEKAWA and Dr. H. KIRA, the professors of this university, for offering of
weather chart. Fat was determined by Gerber's method three times in 10, 20, and 30 days per month.
Results and Dis~ussion (1) Effect of temperature
As the effect of environmental temperature on fat content of milk, there occurred an appreciable tendency to decrease when maxinlum temperature was in excess of 30°C. Na- mely, average value of fat content, when it got beyond 30°C during the period from the middle ten days of June to the first ten days of September, was 3.00 % in the range from 33.3"C as maximum to 21 .B°C as minimum of average temperature. On the other hand, the average fat content was 3.29
%,
as the temperature did not exceed 30°C during the period from the middle ten days of September to the last ten days of October the average of which was 25.b°C as maximum and 14.2"C as minimum.Between the temperatures of 21.4" to 37.4"C as maximum and of 1 1.3" to 25.2OC as minimum, there occurred 0.29
%
decrease in fat content as temperature fell by 7-5°C as maximum and by 7.6"C as minimum.O ' I ~ I h f I ~ l F I M I L I F I M I L I F I M I L F I M I L ( '
June I J u l y ( August
I
S e p t e m b e r 1 OctoberFig ? Seasonal variation of temperature in summer-time. a , Maximum temperature, b . Temperature a t nine in the morning
c.. Minimum temperature; F.. First ten days, M.. Middle ten days,
June
I
JulyI
AugustI
S e p t e m b e r 1 October1
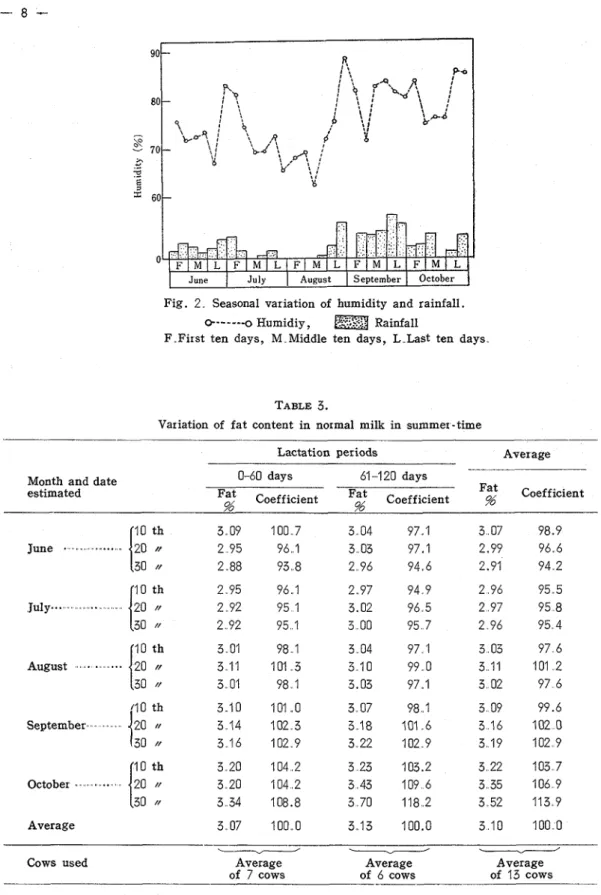
Fig. 2 , Seasonal variation of humidity and rainfall.
0 - - - 0 Humidiy, Rainfall
F..First ten days, M..Middle ten days, L..Last ten days.
TABLE 3.
Variation of fat content in normal milk in summer-time
Lactation periods Average
Average 3.07 100..0 3..13 100.0 3.10 100.0
--
-_Y_J ___C_j
-
Cows used Average Average Average
I I
F I M ( L I F I M I L I F I M I L I F I M I L I F I M I L
June
I
J u l yI
August1
September1
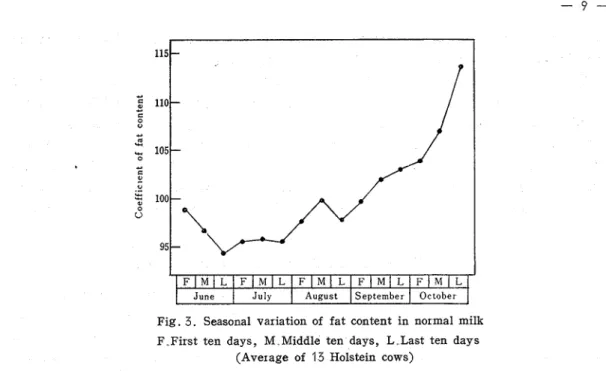
OctoberFig. 3. Seasonal variation of fat content in normal milk F First ten days, M Middle ten days, L Last ten days
(Average of 13 Holstein cows)
Variation in environmental temperature was, thus, found to be, responsible for milk fat content.
(2) Effect of humidity
From the middle ten days of September onwards, the fat content increased because the temperature was going down below 30°C regardless of high humidity of more than 80%. That is, the fat content was affected more markedly by temperature than by humidity. Great difference of 16
5%
of humidity from 67%
up to 83%
during the last ten days of June and while that of 24 % of from 63%
up to 87%
during the middle to the last of August, can be observed in Figure 2. However, the marked rise of humidity in these two places caused no great influence on fat content showing the decrease of a few 0.07% in June and 0.10%
in August.(3) Effect of season by the division of lactation periods
The fat content, which showed the lowest picture during a period of from the middle ten days of June to the last ten days of July, increased gradually from August onwards, and after this, showed an abrupt rise against the lowering of temperature from October And there was little difference on f a t content between the division of two lactation periods from 0 to 60 and from 61 to 120 days (Table 3 ) . The workc20) in this part was published in Chikusan no KenkyO.
Summary
Between June and October, 1956, effects of environmental temper ature and humidity on fat content in the summer season were investigated on the normal milk from 13 cows of Holstein. The temperature was recognized to have considerable influence on milk fat con- tent. Namely, between the temperatures of 21 4" to 37.4OC as maximum and of 11.3"
to 25.2OC as minimum, there occur red a decrease in fat content of 0.29
%
as temperature fell by 7.5"C as maximum and by 7.6"C as minimum.On the other hand, influence of humidity on fat content was not so great as that of temperature ; when the temperature was going down 3O0C, the fat content increased re- gardless of high humidity of 80%. Conversely, when the temperature became over 30°C,
fat content decreased under the same condition of humidity. The suddden rise of the humidity from 63 % up to 87
%
under the temperature of more than 30°C did not cause a great change of fat content, showing small decrease of a few tenth of 15%.
Nevertheless, simultaneity of the declines of temperature and humidity caused the increase of fat con- tent.Part
2.
Variation of f a t content i n abnormal milkThis study was undertaken in order to clarify the effect of seasonal climate condition of Kagawa-ken on the fat content of abnormal milk and also to investigate whether or not there is any fluctuation in the successive lactation period. This was performed in the same year described in Part 1 and so climate condition and others were much the same.
Results and Discussion
Data of this investigation show the milk fat content from 14 Holstein cows that gave birth in spring, 1956, and they give the monthly variations in the lactation period. The cow numbers are arranged in the order of the intensity of the positive reacion by alcohol test. Division of above 5
%
as the rate of positive milk per total milk yield is expressed as that of abnormal milk and that of below 5%
as semi-abnormal milk. It will be seen in Figure4
that the picture of fat content of abnormal milk was changeable in lactation period without indicating a definite type in comparison with Figure 3 of the standard data in Part 1.
ABLE 4.
Milk yield and percentage of abnormal milk during lactation
Lactation Milk yield
;g:,
yp
In 100 of total2::
Of period, per day, milk yieldGroup days k g
Negative Positive Negative Positive
i
1 Apr 2,1956 348 139 4089 749 817 183 Abnormal 2 May 10, // 289 10 5 271 3 316 884 116 milk 3 Nov 13, 1955 350 26 5 8606 680 92 4 7 6 4 May 23, 1956 276 13 6 351 7 233 93 4 6 6 5 Mar 8, N 260 11 3 2842 147 94 8 5 2 6 Dec31,1955 269 162 41 59 187 95 5 4 5 Semi-abnormal milk.
7 Feb 28, 1956 279 14.1 3785 145 96 2 3 8 8 Apr 10, // 288 10 3 2870 108 96 4 3 6 9 May 3, 11 Mar 5, 293 285 12 5 21 2 3441 6048 116 166 96 6 97 3 3 4 2 7 11 Aug 13, N 285 16 9 471 7 107 97 7 2 3 12 Feb 2, // 296 10 1 2940 55 98 1 1 9 13 Apr 22, // 245 7 3 1763 24 98 6 1 4 \ 14 AprI,
// 268 13 2 351 3 24 99 3 0 7-
Days of lactation
Fig. 4 Seasonal variation of f a t content in a b n o ~ m a l milk
TABLE 5 .
Fat content of abnormal milk in lactation period Fat content (%)
Days of lactation
Group Cow No 15 45 75 105 135 165 195 225 255 285 Ave.
1 3 5 0 3 0 3 3 6 7 3.57 2.93 2 9 3 3 3 3 3 4 3 3 3 0 3 3 0 3 3 1 Abnor ma1 ' 2 3 3 3 3 2 0 3 0 3 2.97 3 1 0 2.97 3 0 7 3 1 3 3 2 8 3 2 0 3 1 3 milk 3 4 0 0 3 2 0 3 2 0 3 3 7 3 2 8 3 4 5 3.10 4 3 0 0 2 6 7 2 6 0 2 7 7 2 9 3 3 0 8 3 2 8 3 5 3 3.57 3 6 5 3 1 1 3 2 5 3 4 2 3 7 7 3.40 5 3 1 0 2 9 0 2 7 0 2 5 3 2 4 3 2.43 2 7 7 3 1 0 3 7 7
-
2 8 6 6 3 4 3 3 2 0 2 8 0 2 9 0 3 0 2 3.20 3 3 0 3 7 2 4 1 7 5 0 0 3 2 7 7 3 2 0 3 0 7 3 2 0 3 1 0 3 1 0 3 0 8 3 4 2 3 7 7 4 3 2 4 6 0 3 4 9 8 5 2 0 3 6 3 3 1 0 3 1 5 3 3 0 3 5 0 3 9 3 4 5 7 4 9 0 4 9 7 4 0 3 9 3 80 2 87 2 70 2 87 3 05 3 42 2 82 3 73 3 63 3 75 3 32 10 3 30 3 10 2 92 2 93 2.87 3.18 3 03 3 03 3 33-
3 08 milk 11 3 9 0 3 4 0 2 8 0 2 8 7 2 9 7 3.05 3 0 7 3 1 7 3.23 3 2 7 3.17 12 3 0 0 2 9 2 3 1 7 3 2 3 3 0 7 2 9 8 3 0 7 2 9 7 3 3 7 3 9 7 3 1 8 13 3 9 0 3 3 8 3 0 3 3 1 0 3 0 3 2.80 2 7 0 2 9 2 3 1 3 - 2 8 9 14 4 0 0 3 3 0 2 9 7 3 1 8 3 5 3 3.36 3.62 4 1 7 3 8 3 3 7 0 3 5 8 --Pictures of Nos. 1,2,3,10, and 12 showed flat or high curves in 45 to 105 days of the periods in which they should be declined as a matter of course. And these curves of Nos. 4 , 5 , 6 , and 7 rose markedly or irregularly with the development of lactation in the middle to the latter periods. Semi-abnormal milk (No. 8) of high fat content followed a relatively typical normal curve, but its difference was remarkable, fat content exhibiting 5.2
%
in 15 days, 3.1%
in75
days, and 5.0%
in 285 days after parturition. The average of fat content of this abnormal milk was 4.0%
which was very higher than that of Holstein cows. The workc21) of this part was published in Chikusan no Kenkyti.Summary
The pictures of fat content of semi-abnormal milk in successive lactation period were more similar to the type of standard than those of abnormal milk. The pictures of abnor
-
ma1 milk were quite different from the standa~d, being irregular throughout whole lacta-
tion or sometimes high in the period late in lactation.4 . PROTEIN AND ITS DISTRIBUTION OF NITROGENOUS COMPONENTS IN ABNORMAL MILK
This study was begun in order to find some information. The main results of this section were that the depression of casein number was responsible for the coagulation of abnormal milk, which appeared to be produced by no infection a s the result of the im- pairment in the ability of synthesizing casein in mammary gland.
Materials and Methods
The classical determination and nitrogen distribution of milk were carried out by Row
-
LADN'S The nitrogen in the following filtrate and precipitate was determined
by the Kjeldahl method, and the content of protein was obtained by multiplying that of nitrogen by 6.38. Determinations : I. Total N. 11. Non-casein N (in filtrate from precipita- tion of casein a t pH 4.6 with acetic acid-sodium acetate). 111, Non-protein N (in filtrate from precipitation of protein with 12% trichloracetic acid). IV. Proteose-peptone N
+
Non -proteinN
(in filtrate from precipitation of casein and denatured serum proteins a t pH 4.6 from a boiled sample of the milk). V. Globulin N (in precipitate from treatment of filtrate I1 with MgS04)Sample milk was collected from Holstein cows housed by practical dairymen in the ne- ighbourhood of this university. This cow frequently produced positive milk in the lactation period. Skimmilk obtained from fresh raw milk soon after milking was used for analyses in this experiment. Alcohol test, milk acidity, and catalase content were estimated by the usual methods. Catalase was determined by the KONING method
Results and Discussion
Positive milk is subdivided to the three sections of the low-, the normal- and the high- acidities Usually normal acidity is in the range of 13.0 to 18.0 as the amount of 0.1
N
NaOH consumed to 100 ml of milk with phenolphthalein a s indicator. Normal milk generally has the value of2.50
or less in catalase test. Almost all the samples of ab- normal milk, except seven, were normal ( Tables 7 and 8 ).
I n these tables milk samples are arranged in the order of magnitude of casein number, i. g.%
casein N in total N. And this casein number had no definite correlation with catalase value.In general, the catalase content of milk varies considerably among cows and with the feed that the cow consumes. The catalase content is especially high in colostrum and in milk from mastitic udder. Furthermore, it tends to parallel to the leucocyte count. It increases with the multiplication of bacteria in milk. The abnormal or positive milk used in this experiment was neither colostrum or bacterial milk.
TABLE 6
Protein content and nitrogen distribution in normal milk
Milk No. 1 2 3 4 5 Ave
-.
Milk acidity i s expressed a s ml 0 1 N NaOH per 100 ml of milk Milk acidity, ml/dl
Total protein, g/dl
% in total nitrogen
TABLE 7
Protein and its distribution of nitrogenous components
I in semi-positive milk Casein N Albumin N Globulin N Proteose -peptone N Normal acidic -- -- -- --A Distr ibution 1 2 3 4 5 6 7 8 9 A v e
,
Non-protein N Alcohol test - + + + + + - + t f + i -Milk acidity, ml/dl 18 5 13 5 16 5 18 0 17 0 15 2 17 0 16 5 16 5 16.5 Catalase test, ml 1 05 2 55 4 65 1 00 1 05 - 2 01 0 75 5 55 2 33 Totalprotein,g/dl 403 434 407 315 410 290 346 467 387 3.84 % in total nitrogen 1 Casein N 663 71 2 71 7 743 759 766 772 797 79.3 747 ( Albumin N 9 7 8 2 8 3 6 0 7 3 6 2 7 5 4 7 4 1 6.9 Globulin N 7 4 7 9 8 0 51 4 2 5 8 4 3 5 4 3 9 5.8 Proteose-peptoneN 124 7 6 6 5 8 9 8 8 6 2 A 1 6 9 8 5 7.8,
Non-protein N 4 2 51 5 5 5 7 3 9 5 2 6 9 3 4 41 4 9Hereupon positive milk (+,
+)
alone giving low or high acidity was abnormal in ca- talase test. Thus these are not mastitic milk except these four samples markedly high in catalase content. The protein content did not show great difference between normal and positive milks. But protein content of semi-positive milk was higher in general.The casein number of positive milk
(+,
-I-) was, as average, 71.7 and that of semi -positive milk (+-) 74.5, being lower than 78.5 of the standard (Table6)
of normal milk. Above all, low acidic milk was the lowest and high acidic milk was also considerably low in casein number. No difference was, further, observed in casein number between positive and semi.positive milks in the division of magnitude of protein content, as average valueProtein and its distribution of nitrogenous components in positive milk
-
-Low acidic Noxmal acidic High acidic
- Distribution 1 2 A v 1 2 3 4 5 6 7 A v 1 2 A v e Alcohol test
St
-+
Milk acidity, ml/dl 12 0 7 0 Catalase test, ml 6 90 2 85 Total protein, g/dl 3 82 4 19 % in total nitrogenI
Casein N 67 0 67 8 Albumin N 12.6 1 0 1 Globulin N 7 8 7 31
Proteose-peptone N 8 1 8 8 Non-protein N 4 5 6 0 TABLE 9Nitrogen distribution of abnormal milk in difference of protein content
Positive Semipositive
-- positive
pE:$e
High Low High Low Average
Distribution in protein content (Ave ) (Ave )
Alcohol test .f ,# $-,,-it f i
Milk acidity, ml/dl 1 3 . 5 17.9 1 6 . 5 18 2 Total protein, g/dl 3 7 6 3 1 1 4 0 8 3 1 5 % in total nitrogen
I
Casein N 71 5 71 8 74 5 74 7 A l b u ~ i n N 8.4 8 5 7 3 6 6 Globulin N 7 2 5 4 5 8 4 8 Proteose-peptone N 6 8 7 5 8 5 8 5 Positive 1 6 . 4 3 62 No. of cows 5 5 7 3 10 10 20The expression of "high" or "low" in this table indicates the division of protein content in positive or semipositive milk
(Table 9). In place of the decrease of casein N in positive milk, there was a general tendency toward increase for PP t NP rather than A t G ; namely, the ratio of A -I- G :
PP+
NP was about 1.0 in positive milk and about 1.4 in normal milk in comparison between two tables. The in this section was published in J. Agr.
Chem. Soc. Japan.Summary
The results in this section are summarized as follows : that is,
(1)
positive milk of low orhigh acidity was the most abnormal in protein content and its nitrogen distribution, and also in catalase test. Usually, low acidic positive milk showed a strong positive reaction.
(2) There was considerable difference between normal and abnormal milks (positive and semi- positive) in casein number, i. g.
%
casein N in total N ; namely, value of this casein number is in order of 72 in positive, 75 in semi- positive, and 79 in normal milks. (3) In comparison with the difference of protein content in positive and semi- positive milks, no difference was observed in casein number and other nitrogen distribution. (4) In place of the decrease of casein N in abnormal milk, there was a general tendency toward increase for proteose-peptone S non-protein rather than for albumin t globulin.5..
BLOOD CONSTITUENTS IN RELATION TO CALCIUM AND PHOSPHORUS IN ABNORMAL MILKMilk is one of the most perfect food pr~duced from blood in natural state by the agency of complicated, sole function in the body of mammals. Normal milk is synthesized from due blood. If the blood constituents of cow are normal, therefore, the production of abnor- mal milk may be regarded as the one that is due to the functional impairment of mammary gland. This investigation was made to find the abnormality on blood constituents such as haemoglobin, protein components, calcium, phosphorus, and blood cell of the cow giving abnormal milk
Materials and Methods
Samples of milk and blood were from Holstein cows housed in the livestock-breeding farm of Fukuoka-ken. The experiment was done in duration of September, 1957. Quan- titative analysis of calcium and phosphorus was made by means of colorimetrage of the Beckman spectrophotometer
.
Calcium and ion -calcium were determined by the YANAGI-
SAWA method and phosphorus by the FISKE SUBBAROW method. The conception of principle of YANAGISAWA'S procedure is written in other Section 5. Determination of haemoglobin was made by the use of haemometer and blood cell by haematocrit instrument.
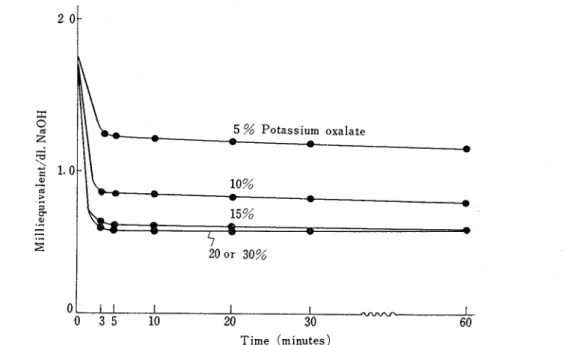
The protein components of blood plasma of cows were determined by being submitted to electrophoresis using the Hitachi HT-E type Tiselius apparatus. The practical procedures to obtain electrophoretic patterns are as follows : both 1 ..25 g of ammonium oxalate and 0.75 g of potassium oxalate were dissolved in 100 ml of water, and 2 ml of which was placed in the test tube with glass stopper of the 15 ml volume and dried. Blood plasma was obtained, following this, by pouring 15 ml of blood into it.. After this blood plasma was
adjusted to 2
%
protein concentration, the 5 ml was placed in cellophane paper and dialyzed for a day a t 5°C against water with 500 ml of veronal buffer.The potential was maintained at 20°C or so for 60 to 80 minutes a t
95
to 105 volt., giving a total current of 8 mA when electrophoretic apparatus was operated. A negative picture on the panchromatic photo-dry plate was enlarged nearly 6 to 8 times and its area of each peak was calculated as the relative ratio of protein components.Results and Discussion
On this analysis, the following results are given. No noticeable difference about total protein and phosphorus could be observed between normal and abnormal milks. However, the relatively high contents of calcium and magnesium, although not distinct owing to these few analyses, are given in Table 10. In addition to these results, the clear increase of non-protein nitrogenous components was also observed, which was similar to a preceding observation of Section 4. Compared with haemoglobin and total solid in blood of normal cows, those of normal cows lowered but blood-corpuscle and serum-content did not show any variation between the two on an average, as shown in Table 11. In average protein content there was an increase in blood serum of abnormal cows, which was in the fairly higher concentration of about 8.6 % than usually. These findings that there was an in- crease in protein and a decrease in haemoglobin in blood indicate that abnormal cow is a sort of "anemia" accompanied by the disorder of nutrition.
TABLE 10
Protein and mineral constituents in milk
Abnormal milk Normal milk
Constituent 1 2 Ave 1 2 3 Ave.
-
-
Total protein, g/dl 3 41 267 307 313 2.99 300 3.04I
Protein N, % 93 8 91 4 92 6 94 9 94 3 94 3 94 5 Non-protein N, % 6 2 8 6 7 4 5 1 5 7 5 7 5 5 Ca, mg/dl 134 8 118 0 126 4 134 4 114 6 109 6 119 5 P , I/ 876 1086 981 951 1008 981 98 1 Mg, 56 0 42 6 49 3 42 4 49 6 40 6 44 2 Ca : P 1 54 1 09 1 29 1 41 1 14 1 12 1 22It will be observed in Table 11 that both of total calcium and ion-calcium in blood serum were in high concentration for abnormal cow and then the average values of bound- Ca (mg) per blood-serum protein (g) were about 0.16 in abnormal cow and about 0.29 in normal cow ; namely, the low value of the former was due to the increase of ion-calcium which was free from protein. At the same time, ion-calcium in blood of abnormal cow passed toward milk being unchangeable in the high concentration or parallel each other. The increase of calcium content in abnormal milk observed frequently in the previous section was deemed to be due to that of ion-calcium in the blood.
Tables 12, 13 and 14 give the f ractionation of blood-plasma protein by electrophoresis with the Tiselius apparatus. This result indicates that their electrophoretic patterns of y-globulin, fibrinogen, and ,@-globulin increased and those of albumin and a-globulin dec- reased in the case of the blood plasma of abnormal cow in comparison with average values of these normal cows. Due to the expansion of patterns of fibrinogen and y -globulin, above all, the value of A : G ratio decreased indicating a fairly smaller value of 0.74 in abnormal cow than
0
93 in normal cow as indicated in Table 12. In Table 13 is summa- rized the percentage of increase or decrease in the components of blood-plasma protein of abnormal cows per 100 of those of normal cows. From the data can be found the fact thatTABLE 11
Comparison of blood constituents between normal and abnormal cows
Blood constituent
Abnormal cow Normal cow
1 2 Ave 1 2 3 Ave
'
Water ,% 81 0 81 3 81 2 80 1 79 1 81 4 80 2 Bound- Ca(mg)per protein(g))
0.182 0 1 3 0 0 7 5 6 0 3 3 3 0 3 0 9 0 2 2 2 0 2 8 8 Total P, mg/dl 13 0 11 2 12 1 15 5 11 2 12 6 13 1 Blood ( ' Total protein, g/dl 8 8 0 8 4 8 8.64 8 1 0 7 7 8 7 6 6 7 8 5Protein components of blood plasma (Electrophoresis using the Tiselius apparatus)
Total solid, % 19 0 19.0 19 0 20
U
20 9 18 6 19 8Hb,% 9 0 0 9 6 9 9 3 5 1 0 0 3 1 0 0 3 11 24 1 0 4 3
Blood-corpuscle, % 32 7 33 7 33 2 34 7 32 0 34 3 33 7
Blood serum
,
% 67 3 66 3 66 8 65 3 68 0 65 7 66 3'load (
Total Ratio of protein components
g '
protein A/G A / F A/(?'-G)g/dl Alb al-Glo az-Glo. 6-Glo Fib Y-Glo
Total Ca, mg/dl 1 0 0 9 0 9 5 9 0 8 7 8 2 8 6 Ion -Ca, mg/dl 8 4 7 9 8 2 6 3 6 3 6 5 6 4 Ionized Ca ,% 84 0 87 8 85 9 70 0 72 4 79 3 73 9 1 10.92 3 4 2 5 4 1 2 8 11 5 1 9 4 1 8 9 0 7 0 1 7 6 1.81 Abnor ma1 cow
(
2 1 0 5 2 3 5 3 3 4 1 0 5 9 0 1 9 4 2 2 4 0 7 8 1 8 2 1 5 8 Ave 10 72 34 7 4 4 11 7 1 0 3 19 4 20 7 0 7 4 1 7 9 1 70 1 9 9 5 3 6 9 4 7 11 5 1 0 8 1 8 6 1 7 6 0 8 3 1 9 8 2 1 0 Nor ma1 cow(
9 1 6 4 6 1 7 5 11 7 6 3 1 5 1 1 3 4 1 1 8 3 0 5 3 4 4 8 69 39 5 4.7 15 1 11 1 10 7 19 1 0 79 3 70 2 07 Ave 9 27 40 8 5 6 12 8 9.4 14 8 16 7 0 93 2 91 2 54about 15 % of albumin and about 21
%
of a* -globulin decreased and about 31 % of fibri- nogen and about 24% of y-globulin increased respectively.I t would seem, however, that this change of electrophoretic patterns was not so great a s in the case of the severe liver -disease, but the cow giving abnormal milk was in worse nutritive state than normally, which was accompanied with anemia-disease i n addition to the decrease of haemoglobin content and blood-cell count. The greatly differing results could not be found in the relative mobilities which were obtained from data of distance migrated by the similar electrophoresis (Table 14).
The rate of increase or decrease of protein components i n blood plasma Protein components
A/G A / F A/(Y -G) Alb, al-Glo.. az,.Glo. @-Glo.. Fib. 7-Glo.
Increase or , ,,. ,,,,
...,
,.
- decrease}
Alb (Albumin), Glo. (Globulin), Fib. (Fibrinogen)
TABLE 14.
Relative mobility of protein components in blood plasma
Cow Alb a l - G l o as-Glo p-Glo Fib 7-Glo
No 1 100 8'20 699 487 382 255 Abnormal cow
.
. .
k
100 100 802 81 1 727 71 3 50.6 49 7 39.5 38 9 297 27 6 100 82 4 75 2 54 3 44 4 32 0 100 82 4 71 1 47 2 36 6 26 1 Normal cow".. .
100 856 747 466 384 295 100 835 737 492 398 292Alb.. (Albumin), Glo. (Globulin), Fib. (Fibrinogen)
It has been said in general that Y -globulin, immune globulin is produced a s protein in
the organ like plasma or lymphatic gland and fibrinogen in the liver tissue On refering to the thing, the past literatures of GRAM(^^', GRAY and BAR TON(^^' and WUHRMANN(~~) have indicated that electrophoretic patterns of more globulin, especially y-type and less albumin are regarded a s those which occur in the case of inflammation of liver. Furthermore, MARTIN(") has stated that much the same picture of patterns mentioned above was closely concerned with liver -disease. According to GRAM"^), it is stated that fibrinogen in blood increased due to inflammation and decreased markedly a s the disease proceeded, contrary to the mild disease. The of this section was published in J Agr. Chem. Soc Japan.
Summary
From the findings of increase in protein and of decrease in haemoglobin in blood, ab- normal cows were considered to be a sort of "anemia" accompanied with the disorder of nutrition. Both of total calcium and ion-calcium in blood were in high concentration for abnormal cows. The values of bound-Ca (mg) per blood-serum protein (g) were about 0.16 in abnormal cow and about 0.29 in normal cow ; namely, the low value of the former was due to the increase of ion-calcium which was free from protein. Then the increase of calcium content in abnormal milk was due to that of ion-calcium in the blood. The change of electrophoretic patterns in blood-plasma protein of abnormal cows was not so great as in the case of the severe liver -disease, but their patterns of y -globulin, fibrinogen, and P-globulin increased and those of albumin and a-globulin decreased.
6.
DISTRIBUTION OF CALCIUM AND PHOSPHORUS BETWEEN DISSOLVED AND COLLOIDAL PHASES IN ABNORMAL MILKPart
1.
Dialysis experimentThe content of certain salts in milk is greater than can be maintained in solution, that is, the solubility is exceeded. The excess of these salts is not present in true solution, but rather in colloidal particles containing calcium, magnesium, phosphate, and citrate. Some methods of study have been used to separate dissolved phase or milk sera in the experiment on salts of milk In this case, four principal methods used for this purpose are pressure ultrafiltration, equilibrium dialysis, high speed centrifugation, and rennin coagulation. Of these methods, equilibrium dialysis and pressure ultrafiltration were used in this experiment. The depression of casein content was already written a s the results recognized in Section 4, which occurs during the synthetic process in mammary gland of cows giving abnormal milk.
Therefore, the study in this section was performed on the assumption that the depres
-
sion of casein content may probably induce the unbalance of distribution of calcium and phosphorus between dissolved and colloidal phases in abnormal milk. The state of mag- nesium in milk was omitted from this study because there was little difference of this content between normal and abnormal milks as can be seen in Section 5. The study of citrate was quite omitted from the first.Materials and Methods
Among Holstein cows 460 housed individually by practicing dairymen, cows 20 were found as abnormal cows with the exception of mastitic milk, whose samples were decided by doing methylen blue reduction and KONING'S catalase tests. Usually normal value of catalase test is within 2.50 ml as oxygen amount produced. In the determinations of calcium and phosphorus, the color which developed after the reagent was added to each sample was measured by the T8ky6 K8den photometric calorimeter (ANA-7A type) using a definite wave-length filter (620 or 720 mp)
.
Calcium was determined by the YANAGISAWAmethod(2g) and phosphorus by the FISKE SUBBAROW method(30). In this calcium determina- tion is applied the principle in which the color of Plasmo Corinth B (disodium salt of 1
-
hydroxy-4-chloro-2, 2-diazobenzene-l , 8-dihydroxy naphthalene-3, 6-disulfonic acid) is fugitive in the presence of ion-calcium and changes from violet to red in a strong alka- line solution. Alcohol and milk acidity tests were conducted by the same procedure as is usual.He~eupon fresh raw milk was de-fatted and approximately 3 to 5 drops of toluene were added to 100 ml of skimmilk. The procedure of dialyzable calcium or phosphorus was similar to the one described below. The apparatus used for equilibrium dialysis of skim- milk was prepared as follows : namely, a glass pipe ( 1 cm in diameter by 5 cm in length) having fishskin membrane (Aidearu Co.) a t the bottom was used. This membrane which involved the 1 ml content was tightly wrung with rubber band. Following this, it was allowed to stand for 4 hours,during which the distilled water was kept a t approxi. mately 2Z0C in thermostat, by stirring through once in every 30 to
40
minutes. To the dialyzed skimmilk was added double distilled water to make a total volume of 70 or 20ml. This skimmilk was analyzed as samples for bound -calcium and bound- phosphorus. In this case, since the sharp rise of the dialyzed percentage was shown a t a point of 4
hours on the curve, the values analyzed a t this point were expressed as dialyzable calcium or phosphorus in milk. The figure of bound-calcium was expressed as calcium (mg) per casein (g) the value of which, obtained from setting off the dialyzable calcium against the total calcium (mg %), was divided by casein amount (g) per 100 ml of milk. Similarly the expression of bound-phosphorus was taken in the same way as mentioned above.
Results and Discussion
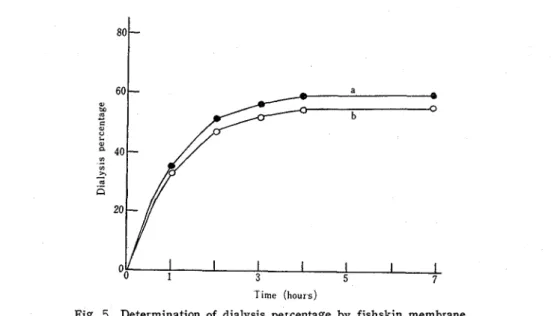
Figure 5 gives the picture of dialysis experiment of calcium and phosphorus in milk using
Time (hours)
Fig 5 Determination of dialysis percentage by fishskin membrane a dialyzable calcium b dialyzable phosphor us
fishskin membrane. This picture indicates that the nearly great parts of calcium and phosphorus were diffused in the place of 3 to
4
hours a t which their determinations were practically conducted. As shown in Tables 15 and 16, the calcium content of abnormal milk (Jh,+, +)
giving normal acidity did not vary markedly and was almost consistent ail over, but it was in a noticeably high concentration only in low acidic positive milk. In comparison with dialyzable calcium and phosphorus, the ionized percentage of calcium was, a s average, more by about 8%
in abnormal milk than in normal milk, while that of phosphorus was much more by about 15% than in the case of calcium. Whilst very much the difference was not found in the ratio of Ca : P between normal and abnormal milks. But a partial difference was recognized only in abnormal milk giving low acidity, and this ratio was in a markedly higher level of about 2 . 0 In comparison of the values of bound-calcium or phosphorus in normal milk, neither difference was significant a s average, but there were considerable lower values among the individual samples, in particular e x . hibiting this trend noticeable for bound-phosphorus. This trend exhibiting low value of bound-phosphorus was found by half in positive milk (Jh,+).
Owing to this downward trend of bound-phosphorus, the ratio of bound-Ca: P became high very much for the most part in positive milk (Jh, + ) but was not so changeable in semi-positive milk (+). Hereupon, the remaining substances or "bound-salts" such as calcium and phosphorus are those that were not diffused any longer toward water through membrane during equili- brium dialysis. The Ca:P ratio did not always run parallel with bound-Ca:P ratio.In this study, the cause of milk coagulation became evident, which was resulted from the rise of bound-Ca : P attributing to a fail of bound-phosphorus combined with casein The 3 1 ) was published in J Agr. Chem. Soc. Japan and Jap. J. Food and Nutr.
TABLE 1 5 .
Distribution of calcium and phosphorus combined with casein in semi-positive milk (By dialysis experiment)
Normal acidic
Milk No. 1 2 3 4 5 6 7 8 9 Ave..
Total Ca, mg/dl Dialyz Ca, mg/dl % D Ca in T Ca Total P, mg/dl Dialyz P, mg/dl % D P i n T P Ca : P
Bound-Ca (mg per g casein) Bound
-
P (mg per g casein) Bound-Ca : PDistribution of calcium and phosphorus comblned with caseln in positlve milk (By dialysls experiment)
Low acidic Normal acidic High acidic
--- - Total
Milk No. 1 2 Av 1 2 3 4 5 6 7 A v 1 2 Av. Average
Total Ca, mg/dl Dial yz
.
Ca,
mg/dl96
D. Ca in T. Ca Total P , mg/dl Dialyz. P , mg/dl % D; P in T . P Ca : PBound-Ca (mg per g casein) Bound-P (mg per g casein) Bound-Ca : P
TABLE 17
Distribution of calcium and phosphorus combined with caseln ir. normal milk (By dialysis experiment)
Milk No. 1 2 3 4 5 6 7 8 9 10 11 12 13 Ave.
Alcohol test Milk acidity, ml/dI Total protein, g/dl Casein, g/dl Casein number Total Ca, mg/dl Dialyz. Ca, mg/dl % D. Ca in T . Ca Total P , mg/dl Dialyz. P , mg/dl 9 6 D P i n T P Ca P
Bound-Ca (mg per g casein) Bound-P (mg per g casein) Bound-Ca P
Summary
A dialysis experiment was carried out in this section in which this major objective was to demonstrate whether there is a difference a s to the distribution of calcium and phos- phorus between dissolved and colloidal phases in normal and abnormal milks.
The calcium content was noticeably higher in the low acidic and positive milk I n the normal acidic and positive milk, there was not so great difference as in the low acidic and positive milk. The ionized percentage of calcium was, as average, more by about 8
%
in abnormal milk than in normal milk, while that of phosphorus was much more by about15
%
.
And in abnormal milk, considerable lower values in bound-phosphorus was found ; namely, this tendency was found by half in positive milk (it,+).
The difference of bound -calcium values between the two was not so great a s that of bound-phosphorus ones The investigation indicates that the cause of coagulation of abnormal milk was due to an unbalance of Ca : P ratio combined with casein.Part 2 . Rapid pressure ultraf iltration experiment
The defect of equilibrium dialysis is isolating of the salts such as calcium and phos- phorus combined weakly with casein particles in milk. Recently the study by the use of pressure ultrafiltration has been made on the distribution of calcium and phosphorus between dissolved and colloidal phases in milk. The rapid pressure ultrafiltration has a characteristic that milk serum, which is naturally present in milk, may be collected for a short time with no change of its nature. I t serves to the determination of the dissolved phase or the part of true solution, which is in the salts-ionizing state. The purpose of the present study in this section is to elucidate the difference of the distribution of calcium and phosphorus between dissolved and colloidal phases in both of normal and abnormal milks and to demonstrate the reason why abnormal milk is liable to be coagulated by alcohol test.
Materials and Methods
Experimental cows : Holstein cows giving abnormal milk were employed in this study. Methods : Skimmilk obtained from fresh raw milk soon after milking was used for ana- lysis in this experiment. For the purpose of antisepsis, approximately 3 to 5 drops of toluene were added to 100 ml of skimmilk. The determinations of ultrafiltrable calcium and phosphorus were made by the procedure given below. Milk serum was obtained by pressure ultrafiltration through a cellophane filter using an apparatus initially devised by TESSIER and DYSON ROSE('^) and modified by the present author (see Figure 6). The apparatus was washed well with double distilled water and dried prior to use. After washing with double distilled water, the cellophane filter (No. 300 cellophane film, a product of Dainippon Co..) was half -dried to a state of remaining a certain amount of moisture, and the first 3 ml of sera ultrafiltrated was discarded to eliminate its moisture contained in the half -dried cellophane filter.
the pressure of 1.2 kg per cm2 for 5 hours, in which the caseinate particles could hardly be observed with a electron microscope of 15,000 magnifications Calcium and phospho- rus in this ultrafiltrated milk serum were determined colorimetrically by the methods of Y A N A G I S A W A ( ~ ~ ) ~ ~ ~ FISKE S U B B A R O W ( ~ ~ ) W ~ ~ ~ a T6ky6 Kbden photometric calorimeter (ANA- 7A type) using 620 mp (calcium) or 720 mp (phosphorus) wave- length filter. The nitrogen distribution was determined by the Kjeldahl method, and the content of protein was ob- tained by multiplying that of nitrogen by 6.38.
Indian rubber tube 0 5cm g l a s s tubing S t a i n l e s s s t e e l supporting s c r e e n
C.-
4 5cm4
Fig 6 Apparatus for sapid ultrafiltration of milk
Results and Discussion
(1) Distribution of calcium and phosphorus between dissolved and colloidal phases in normal milk
In Table 18, cow No. 4 alone was late in the lactation. All of the other cows were in
the early to the middle lactation periods. In Table 18 are presented data obtained from the examination of normal milk. Alcohol test gave negative reaction for all samples. And then the entirely no abnormalities were found in milk acidity, and catalase and methylen blue reduction tests. Further it was found from the results of Table 18 that on an ave- rage, total protein content was 3.00 %, as samples were from Holstein cows, whose milk has a lower protein content, and casein number, i. g.
%
casein nitrogen in total nitrogen was 77.0 which accorded substantially with 78.0 of the ROWLAND data.Cs3)See the average values of normal milk (Table 18). These results obtained as average were compared with data of abnormal milk summarized in the next Table 19.
(2) Distribution of calcium and phosphorus between dissolved and colloidal phases in abnormal milk
Alcohol test showed positive for all samples. Milk samples were generally in the nor- mal range (13.0 to 18.0) but there were also a few of the low or high acidic milks..
The catalase and the methylen blue reduction tests did not show any abnormalities. A great portion of lactation was in the middle periods but Nos. 4 and 6 were near to the end. At the same time, except these two, others all showed low-protein content which was in the range of 2.6 to 2.7%. These were a sort of low-composition milk. And also
TABLE 18
Protein content, and distribution of calcium and phosphorus between dissolved and colloidal phases in normal milk (By ~ a p i d ultrafiltration)
Milk No. 1 2 3 4 5 6 7 Ave
Total protein, g/dl Casein, g/dl Casein number Total Ca, mg/dl Ultraf il Ca
,
mg/dl % U Ca in T . Ca Total P , mg/dl Ultraf il P,
mg/dl % U P i n T . P Ca : PBound-Ca (mg per g casein) Bound-P (mg per g casein) Bound-Ca : P
TABLE 19.
Distribution of calcium and phosphorus between dissolved and colloidal phases in abnormal milk (By rapid ultrafiltration)
Milk No. .- .- Type1 Type2 Items 1 2 3 4 5 6 7 Av Av Total protein, g/dl Casein, g/dl Casein number Total Ca, mg/dl Ultrafil Ca, mg/dl % U Ca in T Ca Total P , mg/dl Ultrafil P, rng/dl % U P i n T P Ca : P
Bound-Ca(mg per g casein) Bound-P (mg per g casein) Bound - Ca : P
the casein number was generally lower than about 77 of normal value.
It became apparent that there were two types of dividing abnormal milk, one of which was type 1, which was low in both of ultrafiltrable calcium and phosphorus, the other was type 2, which was high in ultrafiltrable calcium and was low in ultrafiltrable phosphorus (Table 19). The value of U. Ca in T . Ca of type 1 was, on the average, about 16 %
ranging from about 10 to 2156, whereas that of the same P was about 14% ranging from about 5 to 19%. In this case, abnormal milk of type 1 contained more phosphorus ; on an average, it contained more of the phosphorus than the standard, the content of which was 171 mg per 100 ml. Total calcium did not give marked difference but exhibited a small tendency to increase in concentration. Except No. 4, therefore, the ratio of Ca : P was mark- edly in the lower level, the content of total phosphorus being more prominent than that of total calcium and while the ratio of bound-Ca : P was similar to that of the totalCa :
P.
Thus almost all of the values of examination were different from data of the standard given in Table 18 and the milk coagulation of type 1 appeared to be originated from unusual unbalance of calcium and phosphorus between dissolved and colloidal phases. On the other hand, the value of U. Ca in T . Ca of type 2 was, on an average, about 48% ranging from about 45 to 50%, whereas that of the same P was about 25% being from about 16 to 37% ; that is, a characteristic of this type 2 was overionizing of calcium and then the ionizing phosphorus was less than enough. In type 2 being different from type 1, total calcium content was somewhat less than the standard value, and similarly, total phosphorus did not show greater difference but tended to increase in concentration. Consequently the decline of the ratio of total Ca : P was similar to the case of type 1. Bound-Ca (mg per g casein) of type 2 was manifestly less than the standard value. The similar bound-P was no less in amount in comparison with the standard. And the bound- Ca : P ratio showed a small value similar to the total Ca:P ratio.
Summary
The characteristics of the distribution of calcium and phosphorus between dissolved and colloidal phases in abnormal milk became apparent from data of this section. This ex- periment was done by the method of pressure ultrafiltration.. It became obvious that there were two types in abnormal milk, one of which was type 1, which was low in both of ultrafiltrable calcium and phosphorus, the other was type 2, which was high in ultrafiltra- ble calcium and was low in ultrafiltrable phosphorus.
7 .
COMPARATIVE DIAGRAM OF DISTRIBUTION OF CALCIUM AND PHOSPHORUS BETWEEN DISSOLVED AND COLLOIDAL PHASES IN NORMAL AND ABNORMAL MILKSIn Figure 7 is illustrated the comparative diagram of distribution as to calcium and phosphorus between dissolved and colloidal phases in normal and abnormal milks. This diagram was made on the basis of data of Section 6 or of the average obtained from
dialysis equilibria and pressure ultrafiltration experiment. The data of phospho~us or cal- cium in sera obtained by means of rapid pressure ultrafiltration are presented as calcium or phosphorus in dissolved phase, which are a truly ionized calcium or phosphorus exists in natural state. And this part of milk serum is generally called "dissolved phase," where- a s that of colloidal particles containing protein "colloidal phase."
Dissolved phase
-3
Collo~dal phaseDialyzable phase Non-d~alyzable phase
Fig 7 Distribution of calcium and phosphorus in milk
Range of dissolved or ult~afiltrable phase : Normal milk, Ca 27 to 33 per cent, P 31 to40 per cent ; Abnormal milk, Type1 Ca 10 to 21 per cent, P 5 to 19 per cent, Type 2. Ca 45 to 50 per cent, P 16 to 37 per cent Range of dialyzable phase : Normal milk, Ca 50 to 59 per cent, P 41 to 61 per cent, Abnormal milk, Ca 52 to 68 per cent, P 48 to 79 per cent ; N M
(Normal milk), A M (Abnormal milk)
It became apparent that there were two types of dividing abnormal milk,one of which was type 1, which contained calcium and phosphorus in large quantities in colloidal phase, the other was type 2, which contained calcium in small quantities in colloidal phase and phosphorus in large quantities in colloidal phase. Thus abnormal milk has characteristic
TABLE 20
Distribution of calcium and phosphorus in milk
Abnormal milk
Distribution Normal milk
T y p e I Type 2 % % 96