Vol,, 17, No.. 1 (1965)
SHALLOW GROUND WATER IN T H E
DOWNSTREAM BASIN
OF THE AYA RIVER
Kiyoshi FUKUDA, Tadashi OCHI, Tadao MAEKAWA, Yoshihiro KONO,
Kazuhiro SHIIKI, Toshiaki NARUHIRO
and Shuji SHIMONO
INTRODUCTION
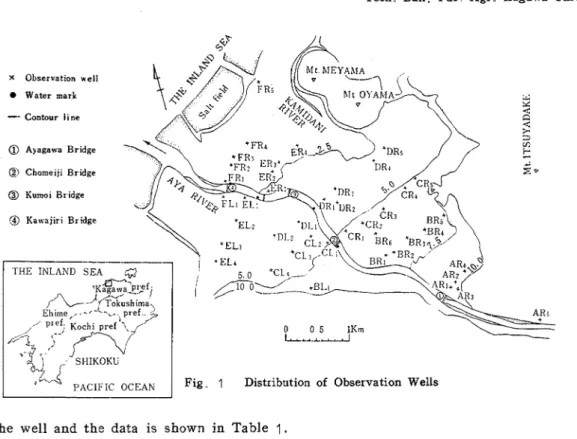
Field investigations of the shallow ground water are now in an active progress in the downstream basin of the Aya River in the northwest portion of Kagawa Prefecture, Shikoku,
Japan. The area carrying out the investigation, about 738 hectares of paddy fields, is
bounded on t h e east by the feet of Mt. Meyama (154.4 meters high above sea level), Mt.
Oyama (141.6 meters) , Mt. Shiramine (336.9 meters)
,
Mt. Itsuyadake (351.3 meters)and Mt. Eboshidake (260.9 meters); and on the south by the feet of Mt. Kiyama (462.3 meters) and Mt. Kanayama (281.0 meters) as shown in Fig. 1.
Ground surface slopes gradually and unif o r n l y to the northwest, with elevation ranging from 10.0 meters inland to almost sea level along the coast. Soil in this area is recent alluvium (fan-delta) which have been transported and deposited by the Aya River. S u ~ f a c e soil is generally loam and sandy loam(').
Objectives of the investigation are 1) to study the present condition of the shallow ground water of this area, and 2) to study the mechanism of the movement of the shallow ground water in this area in relation to the agricultural engineering of the paddy fields. T h e purpose of this paper is to report some results of the investigation carried out from July to November 1964.
METHODS
I n this area, there are a number of shallow wells that are used for domestic purposes. From these domestic shallow wells, 41 observation wells were selected as shown in Fig. 1. The observations were taken using sounder consisting of a wooden float and measuring rope; and observations were made by the well users.
In the observation, the water table depth was measured from the standard point a t the top of the well to the water surface. This was done in the morning or late at night for every well every day in order to avoid the fluctuation caused by daily usuage.
To obtain the height above sea level of the standard point, the leveling was accomplished by the height of the bench mark and the level station nearby. By this, the altitude of the shallow ground w a t e ~ a t every well site was obtained and the elevation of the water table was calculated in centimeters above sea level
Tech,, Bull. Fac Agr. Kagawa Univ . X Observat~on uell Water mark I l t U l A d
--
Contour line @ A>agarva B r ~ d g e '- @) C h o m e ~ j ~ B r ~ d g e @ Kumo~ Br ~dge @ Kaaajlr~ Bridge EL 2 ? -0 0 5 1Km LA- &d*liL
oCEAh Fig 1 Distribution of Observation Wellsof the well and t h e data is shown in Table 1.
RESULTS AND DISCUSSION Observation Wells
Dividing this area into segments by contour lines 1, 2, 3, 4, 5, 6, 7, 8, 9 and 10.0 meters, 41 observation wells f o r every range of depth were listed in every section of t h e altitude and t h e percentage was calculated to the total number in that segment. These
Table 1 THE DEPTH OF OBSERVATION WELLS
Altitude -- Well depth (m) Total
o f w e l l 1.0- 1.5- 2 0 - 2.5- 3 0 - 3 5 - 4 0 - 4 5 - 9 5 - %
c %
site (m) 1.5 2.0 2.5 3.0 3.5 4.0 4.5 5.0 10.0Vol.. 17, No.. 1 (1965) 3 1
data are tabled in Table 1.
As seen in this Table, the well depth varied from 1.0-1.5 meters to 9.5-10.0 meters: 2.0-2.5 meters and 1.5-2.0 meters are predominent. The depth of 9.5-10.0 meters is the deepest and one well has the depth of less than 1.5 meters. On the whole, t h e depth of most of the wells in this observation are less than 5.0 meters.
As to the altitude of the well sites. 13 wells (about 32% of the total number) are distributed in the zone having altitude of 2.0-3.0 meters, and the next 7 wells (about
17 %) are at the altitude of 5 0-6.0 meters. On the whole, most of the wells used for this observation are distribut-d in ths zone having altitud? ranging less than 8 meters.
Water Table Map
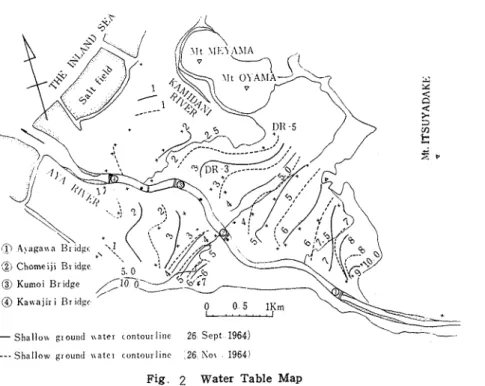
Fig. 2 shows the water table map obtained from the results of the observations. In this map. the distribution of the contour lines of the water table resembles generally that of the contour lines for topography.
---- S h a l l o w g ~ o u n d a n t e l contoul llnc 26 Sox 1964) Fig 2 Water Table Map
It is clear that the contour lines in the non-irrigation season (26, November, 1964) recede from the position of the contour lines in the irrigation season (26, September, 1964). For example, the contour line having 3 meters in height, the recessions are from about 200 meters to about 400 meters.
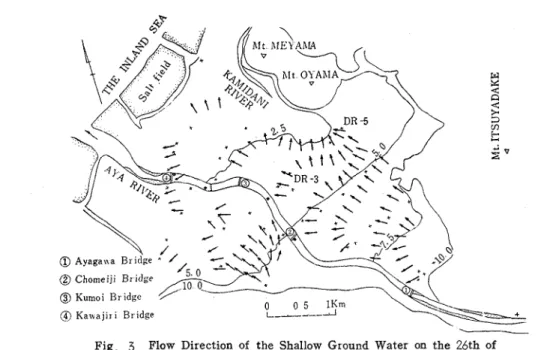
According to the distribution of the contour lines, the direction of the shallow ground water flow takes approximately the direction as shown by the arrows in Fig. 3.
As a whole, the shallow ground water which originated from the southeast mountain districts and gathered into this area flows in a northwestly direction and in a direction
Tech,. Bull. Fac,. Agr. Kagawa Univ.
-
Fig 3 Flow Direction of the Shallow Ground Water on the 26th of November 1964, Calculated from Fig. 2
parallel to the Aya River.
However , in the area on the right side of Aya River, it can be inferred, according to the valley formed by the contour lines and the direction of the arrows, that the flow of the shallow ground water in the northwest district (near observation points DR-3 and DR-5) is i n accord with the stream course of the Kamidani River.
On the other hand, along a narrow strip on the right side of Aya River, it can be inferred that the shallow ground water in this area influences the Aya River. Along a narrow strip on the left side of Aya River, the shallow ground water i n the upper district influences the Aya River, and in the low positions are influenced by the Aya River.
Water Table Profile
Fig. 4 shows t h e water table profiles of each observation line. From this figure, it can be pointed out that the depth of the water table, measured from the surface to the shallow ground water table, in the irrigation season (26, September, 1964) is more shallow than that in the non.irrigation season (26, November, 1964). In the irrigation season, the depth of the water table is varied from about 0.3 meters (AR- 2 ) to about 1.9 meters (AR- 1 ) and in the non-irrigation season, the value is varied from about 0.6 meters (FR- 4 ) to about 2.4 meters (AR- 1 ) . T h e difference of the depth between the two seasons is varied from about 0.24 meters (FR-line) to about 1.6 metrs (CL-line)
.
In the water table profiles of the observation line-DR, there is a water table mountain near observation point DR-3 and a valley near point DR-4. From this, i t can be inferred that the shallow ground water flows in the direction from point DR-3 to point DR-4 and from point DR- 5 to point DR- 4
,
and from point DR- 3 to point DR- 1 . And the flow from point DR- 3 to point DR-1 may influence t h e Aya River and the same can be inferred forVol. 17, No. 1 (1965)
-
So11 surface-, U a t e , t a b l e surface (26 S e p t 1964)
...-.- \ V a t ~ ? tahle surfnee (26 INov 1964)
Clll CR' Cllr
____._----
Fig,, 4 Water Table Profile
the other observation lines such as lines -AR, -BR, -CR, -ER and-FR.
Water Table Fluctuation
I t is generally known that many ground water levels show a seasonal pattern of fluc- tuation. These result from influence such as recharge from rain fall and irrigaiton and discharge.
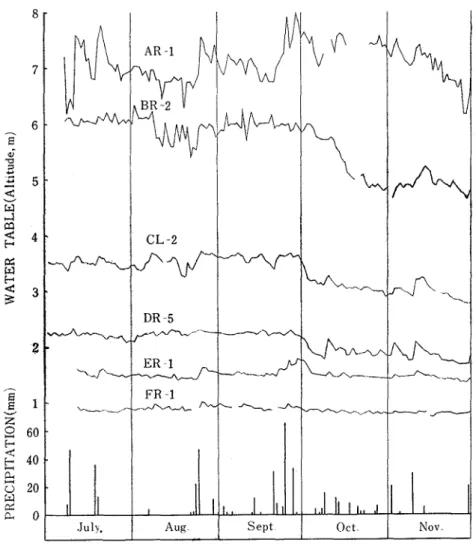
T h e seasonal fluctuation (from July to November,
1964)
in this area is shown i n Fig. 5.From this figure, it is clear that the higher positions of the water tables occure around July and the positions begin to lower at the beginning of October, marking t h e beginning and the end cf the irrigation season.
Although rain fall is not a n accurate indicator of the ground water level change, from Fig. 5 , it can be inferred that heavy precipitation supply large quantities of ground water recharge and thus causes fluctuation on t h e ground water table. And also i t c s n be pointed out that after one or two days of heavy precipitations t h e ground water level reaches a higher position dnd the higher the precipitation the higher t h e ground water level. This is clear in the case of observation points AR- I , BR- 2 and CL- 2 i n the same figure
.
34 Tech. Bull
..
Fac . Agr.
Kagawa Univ. such a s ER- 1 and FR- 1 that are near the coast. From t h e figure and the well positions, i t can be inferred that this illustrates the effect of the wells that are close to t h e shore.-- -
Fig 5 Water Table Fluctuation from July to November 1964
SUMMARY Using 41 wells, a study of the shallow ground water in the downstream basin of the Aya River, Kagawa Prefecture, Shikoku, Japan, are now in an active
progress. This report is the result of the hydrological field investigation carried
out from July to November 1964. The depth of most of the wells used for this
observation were less than 5 meters. The shallow ground water contour lines resemble
that of topography which slopes from the southeast to the northwest with elevation
ranging from 10.0 meters inland to sea level. From the shape of the water table map,
t h e flow direction of the shallow ground water was determined to be, as a whole, from the southeast t o the northwest. The mean depth measured from the soil surface to t h e
Vol. 17, No.. 1 (1965) 35 1964), and about 1.5 meters in the non-irrigation season (26, November, 1964). T h e
fluctuation of the shallow ground water table was figured from the observation data.
ACKNOWLEDGEMENTS
The writers thank the observers for their daily observations, and also Professor Hitoshi Fukuda, Assistant Professor Hiroyuki Ogata both of Tokyo University for their suggestions concerning this work. Also Professor Minoru Saito of Kagawa University for his sugge- stions. Mr. Hideyuki Fukumoto and Mr. Masaaki Onishi, both students of Kagawa University, Mr. Toshihide Nagano and MIS. Chieko Matsubara both members of the
laboratory for their assistance in facilitating this work. And Mr. Terumasa Uyama an
engineer for Kagawa PI efectural Office for his assistance.
(Received May 31, 1965)
REFERENCE
(1) Kagawa Prefectural Agricultural Experiment Station : Agricultural Atlas of Kagawa-Ken, Plate 4 ,