Proposal of Material Design Direction using Material
Softening by Bi off-center on BiFeO3-BaTiO3 system for
High Performance Piezoelectric Energy Harvesting
A Doctoral Dissertation
Presented by
Sangwook Kim
A Dissertation submitted to the University of Yamanshi
in Partial Fulfillment of the Requirements for the
Degree of Doctor of Philosophy
Special Doctoral Program for Green Energy
Conversion Science and Technology
Interdisciplinary Graduate School of Medicine and Engineering
University of Yamanashi
I
ABSTRACT
Energy-harvesting technology has attracted significant attention as one of the solutions to harness energy continuously from eco-friendly and non-renewable energy sources. Energy Harvesting is a technology that converts natural energy such as sunlight, wind, and heat into electric energy, and refers to the technology that converts waste energy into useable electric energy. Piezoelectric energy harvesting is based on the phenomenon that a potential difference is created in piezoelectric materials upon the application of mechanical energy as a result of dipole and a compensating charge are formed to generate a current flow. It is very important to choose an appropriate piezoelectric material for piezoelectric energy harvesting. In agreement with the equation of figure of merit (FOM) for energy harvesting, the piezoelectric materials with high piezoelectric constant and low dielectric constant are required to obtain high FOM. However, piezoelectric constant and dielectric constant are proportional. Therefore, the piezoelectric materials with high elastic compliance s33 can be selected for high
performance piezoelectric energy harvesting. The s33 is strongly related to the material’s
softness. Material softening can be observed in Bi-based lead-free piezoelectric materials.
In order to understand the origin of material softening, the electrical and structural properties were investigated in the BF-BT ceramics. The maximum material softening was exhibited by the BF30BT ceramics. The synchrotron radiation X-ray diffraction (SR-XRD) patterns of BF30BT ceramics with undivided diffraction peaks suggested the material to have cubic- like symmetry. Moreover, the single peak shape of BF30BT ceramics was maintained above the Curie temperature (TC) that was investigated from temperature-dependent SR-XRD
measurement.
II
high temperature (950 K) crystal structure of the BF30BT ceramics was investigated by Rietveld structure refinement method. The crystal structure of BF30BT ceramics at 950 K was cubic with Bi3+ ion off-centering along 6 equivalent [100] direction, while the position of the
Ba2+ ion was on-centered. On the other hand, the crystal structure of BF30BT ceramics at room temperature (300 K) was rhombohedral with very small distortion. Furthermore, the Bi3+ ion occupied 3 neighbor sites with one side along the [100] direction in room temperature. The Bi3+ ion disordering behaviors might be related to the material softening under the electric field. Therefore, the crystal structure of BF30BT ceramics was investigated by SR-XRD under the electric field. The single peak shape in SR-XRD patterns of BF30BT ceramics was maintained under the electric field. However, the hysteretic polarization – electric field (P-E) loop and large piezoelectric response was exhibited, which is the evidence of domain switching. The evidence of domain switching such as the change of intensity ratio (domain reorientation) was not observed from the SR-XRD patterns measured under the electric field. Therefore, large piezoelectric response occurrence in the BF30BT ceramics with small structural distortion is strongly related to Bi3+ off-centering. We suggested new mechanism of electric-field-induced stain with off-centered Bi3+ ordering under the electric field, which was confirmed by the
intensity ratio of odd and even numbered peak.
The material softening mechanism is confirmed to be related to Bi3+ ion off-centered crystal
structure in BFBT ceramics. We observed that materials softening is revealed in the wide range of composition that differs depending on various structural parameter such as lattice constant, atomic position, bond-length, distortion, etc. The BF30BT ceramics revealed the maximum Bi off-center displacement, while the Bi-O bond-length was maintained to minimum. Thus, the short Bi-O bond-length was responsible to make a stable Bi off-center position. Therefore, the large material softening is occurred by stable Bi off-center positon and large off-center
III displacement.
Finally, the material design direction was proposed with material softening mechanism caused by Bi off-center. The Bi3+ ion off-centering is expected to become larger when the ionic-radii-difference between A-site cations (Bi3+ and other ions) in the unit cell is huge. The large Bi3+
off-centering will provide large material softening thereby revealing the superior piezoelectric response.
IV
LIST OF CONTENTS
ABSTRACT
... ILIST OF CONTENTS
... IVLIST OF FIGURE
... VIIChapter 1 Introduction and Background
... 11.1 Introduction ... 1
1.2 Background ... 4
1.2.1 Concept of energy harvesting ... 5
1.2.1.1 Piezoelectric energy harvesting ... 6
1.3 Piezoelectricity ... 6
1.3.1 Piezoelectric effect ... 6
1.3.2 Lead-free piezoelectric ... 9
1.4 Ferroelectricity ... 11
1.5 Outline of the thesis ... 13
References ... 13
Chapter 2 Experimental Techniques
... 182.1 Synchrotron radiation X-ray sources ... 18
2.1.1 BL02B2 beam line ... 19
2.2 X-ray diffraction ... 19
2.3 Rietveld method ... 21
2.3.1 Principle of Rietveld refinement ... 22
2.4 Maximum entropy method ... 23
2.4.1 Advantage of maximum entropy method ... 24
2.4.2 Maximum entropy method applied in the crystallographic ... 25
2.4.3 Principle of maximum entropy method ... 26
References ... 28
Chapter 3 Measurement of electrical properties in high quality samples, and
proposal of new phase diagram for BiFeO
3-BaTiO
3ceramics
... 31V
3.1 Introduction ... 31
3.2 Experimental details... 33
3.3 Results and discussion ... 35
3.4 Conclusion ... 50
References ... 51
Chapter 4 Temperature dependence of crystal structure in 0.70BiFeO
3-0.30BaTiO
3ceramics
... 554.1 Introduction ... 55
4.2 Experimental details... 56
4.3 Results and discussion ... 57
4.4 Conclusion ... 71
References ... 72
Chapter 5 Electric field dependence of crystal structure in 0.70BiFeO
3-0.30BaTiO
3ceramics
... 755.1 Introduction ... 75
5.2 Experimental details... 77
5.3 Results and discussion ... 78
5.4 Conclusion ... 95
References ... 96
Chapter 6 Chemical composition dependence of crystal structure at high
temperature
... 986.1 Introduction ... 98
6.2 Experimental details... 99
6.3 Results and discussion ... 100
6.4 Conclusion ... 109
References ... 109
Chapter 7 Proposal of material design direction by material softening with
Bi off-centering
... 1127.1 Introduction ... 112
VI
7.3 Results and discussion ... 114
7.4 Conclusion ... 122
References ... 123
Chapter 8 Conclusion
... 124VII
LIST OF FIGURE
Chapter 1
Figure 1.1 Pictures showing energy harvesting from various natural resources. ... 1 Figure 1.2 The piezoelectric constant versus dielectric constant in lead-based and lead-free
piezoelectric ceramics. ... 3
Figure 1.3 A typical electromechanical hysteresis loop showing lattice expansion and
contraction under the influence of an electric field. ... 8
Figure 1.4 The piezoelectric coefficient and dielectric constant, and planar electromechanical
coupling factor (Kp) in PZT with MPB.37,38 ... 9 Figure 1.5 The crystal structure of BaTiO3 with ABO3 type perovskite. ... 11 Figure 1.6 A typical polarization-electric field hysteresis loop with characteristic domain
reorientations... 12
Chapter 2
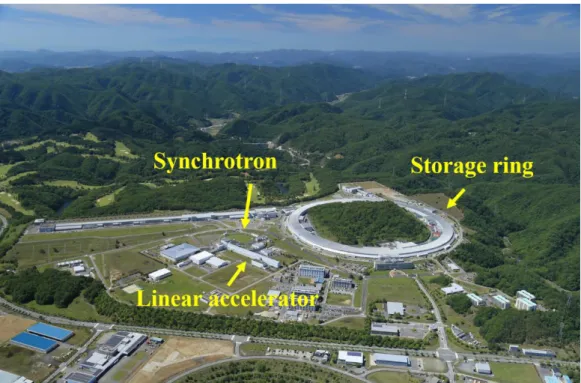
Figure 2.1 The SPring-8, a third generation synchrotron radiation source. The linear
accelerator, booster synchrotron, and storage ring are labelled in the figure (From www.Spring8.or.jp). ... 18
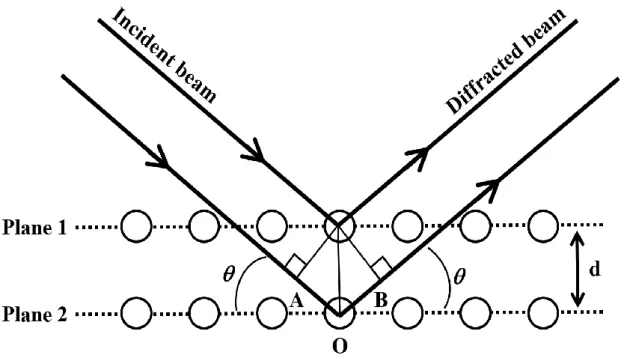
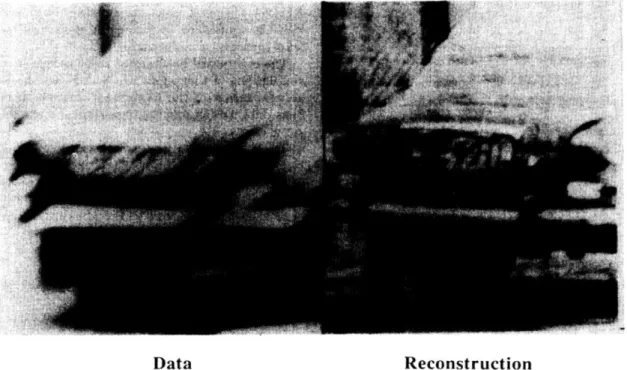
Figure 2.2 The geometry of X-ray reflection by planes of atoms in crystal. ... 20 Figure 2.3 The example of the maximum entropy method used to improve the image in the
field of image restoration technology.3 ... 24
Chapter 3
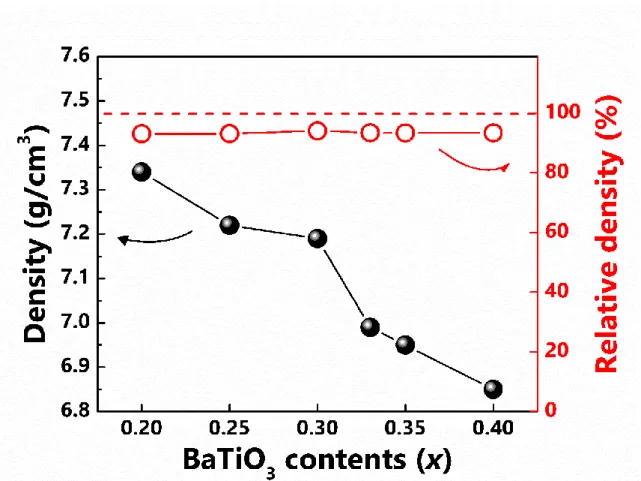
Figure 3.1 The absolute and relative density of BiFeO3-BaTiO3 ceramics as a function BaTiO3
concentration. ... 34
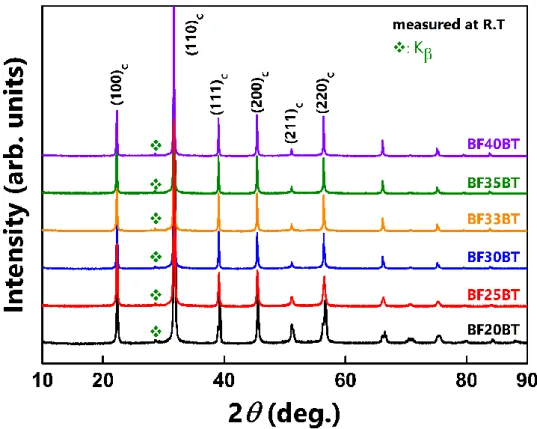
Figure 3.2 The Cu K X-ray diffraction patterns of BiFeO3-BaTiO3 ceramics as a function of
BaTiO3 concentration... 36 Figure 3.3 X-ray diffraction patterns of BiFeO3-BaTiO3 ceramics as function BaTiO3
concentration with selected 2 in range of (a) 31 ≤ 2 ≤ 33 for (110)C, (b) 38 ≤ 2 ≤ 40 for
(111)C, and (c) 44 ≤ 2 ≤ 47 for (200)C. ... 36 Figure 3.4 The P-E hysteresis loops measured at room temperature with AC bias of 0.1 Hz for
VIII
Figure 3.5 The Bipolar S-E curves of BiFeO3-BaTiO3 ceramics as a function of BaTiO3
concentration. ... 38
Figure 3.6 (a) The piezoelectric charge constant; d33 and piezoelectric actuator constant; d33*
of BiFeO3-BaTiO3 ceramics as a function of BaTiO3 concentration. (b) The strain hysteresis of
various piezoelectric ceramics (BNT-based, PZT-based, and BT-based) with piezoelectric actuator constant; d33*. ... 40 Figure 3.7 The frequency dependence of dielectric constants in BiFeO3-BaTiO3 ceramics as a
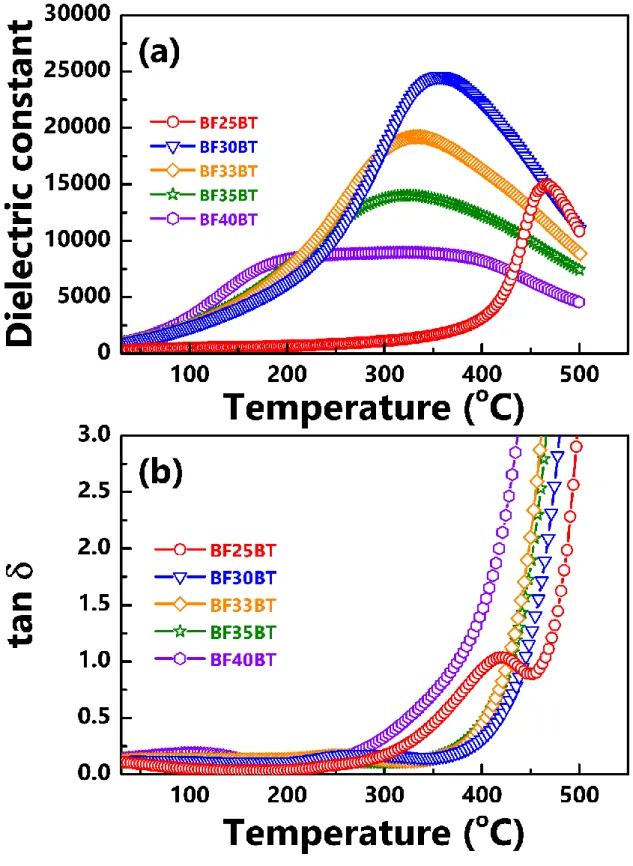
function of BaTiO3 concentration. ... 41 Figure 3.8 Temperature dependence of (a) dielectric constants and (b) dielectric loss of
BiFeO3-BaTiO3 ceramics as a function of BaTiO3 concentration. ... 44 Figure 3.9 The temperature dependence of dielectric constants for 0.70BiFeO3-0.30BaTiO3
composition at various frequencies. ... 45
Figure 3.10 The spectra of (111) reflection peaks under the synchrotron radiation in (a)
BF10BT, (b) BF20BT, (c) BF25BT, (d) BF30BT, (e) BF33BT, (f) BF35BT, and (g) BF40BT piezoelectric ceramics. ... 46
Figure 3.11 The synchrotron radiation X-ray diffraction of BiFeO3-BaTiO3 ceramics at various
temperatures. The 2angle is selected for (110)C peak of (a) BF20BT, (b) BF25BT, (c) BF30BT,
(d) BF33BT, (e) BF35BT, and (f) BF40BT. ... 48
Figure 3.12 The synchrotron radiation X-ray diffraction of BiFeO3-BaTiO3 ceramics at various
temperatures. The 2angle is selected for (200)C peak of (a) BF20BT, (b) BF25BT, (c) BF30BT,
(d) BF33BT, (e) BF35BT, and (f) BF40BT. ... 49
Chapter 4
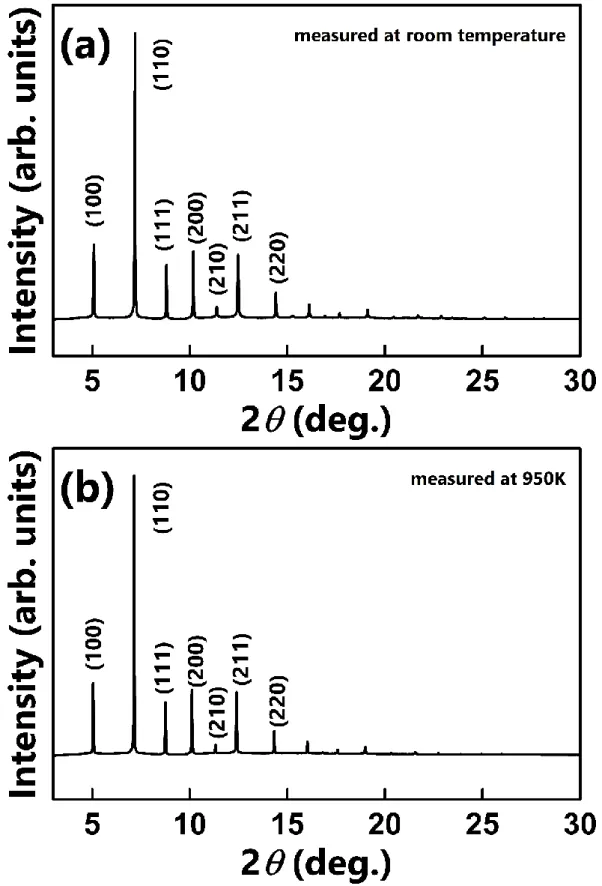
Figure 4.1 Synchrotron radiation X-ray diffraction of 0.70BiFeO3-0.30BaTiO3 ceramics,
which was measured at (a) room temperature and (b) 950 K. ... 58
Figure 4.2 Structural refinement results at high temperature with normal cubic symmetry for
selected 2 angle (a) 3o < 2 < 20o and (b) 20o < 2 < 30o. ... 59 Figure 4.3 The ion off-centered model in the unit cell of the crystal with (a) both ions, (b) Bi
ion, and (c) Ba ion. ... 60
Figure 4.4 The variation of weighted profile agreement factor Rwp with off-centered atomic
position of (a) ions involved in the off-centering and (b) off-centering directions. ... 62
Figure 4.5 Structural refinement results at high temperature with Bi3+ ion off-centered along
[100] direction model. ... 63
Figure 4.6 The MEM electron density distribution in 0.70BiFeO3-0.30BaTiO3 ceramics at high
temperature (950 K). ... 65
IX
(Fe/Ti) on (100) plane. ... 66
Figure 4.8 One-dimensional profiles of MEM electron density distribution along [100], [110],
and [111] direction at (a) A-site (Bi/Ba) and (b) B-site (Fe/Ti). ... 67
Figure 4.9 Structural refinement results at room temperature with rhombohedral structure. . 68 Figure 4.10 Visualization of unit cell of 0.70BiFeO3-0.30BaTiO3 ceramics at room temperature
and 950 K. ... 70
Chapter 5
Figure 5.1 The synchrotron radiation X-ray diffraction of 0.70BiFeO3-0.30BaTiO3 ceramics
with selected 2 in the range of (a) 3o ≤ 2 ≤ 30o, (b) 7.0o ≤ 2≤ 7.4o for (110), (c) 8.6o ≤ 2≤
9.0o for (111), and (d) 10.0o ≤ 2≤ 10.4o for (200), respectively. ... 79
Figure 5.2 (a) The P-E hysteresis loop and (b) bipolar S-E curve of 0.70BiFeO3-0.30BaTiO3
ceramics. ... 80
Figure 5.3 The schematic diagram of synchrotron radiation X-ray diffraction measurement
under the electric field. ... 82
Figure 5.4 The SR-XRD patterns of 0.70BiFeO3-0.30BaTiO3 ceramics under the electric field
with selected 2 angles (a) from 7.0o to 7.4o for (110), (b) from 8.6o to 9.0o for (111), and (c)
from 10.0o to 10.4o for (200), respectively. ... 83 Figure 5.5 The lattice strain versus electric field curves of 0.70BiFeO3-0.30BaTiO3 ceramics
along [110], [111], and [200] miller planes. ... 85
Figure 5.6 The (a) P-E hysteresis loop and S-E curves of BaTiO3 ceramics. ... 86 Figure 5.7 The synchrotron radiation X-ray diffraction of BaTiO3 ceramics for (002) and (200)
peaks under the (a) zero and 50 kV/cm electric field, and (b) lattice strain response of (200) and (002) peaks. ... 87
Figure 5.8 (a) bulk strain response and (b) lattice strain response of Pb(Zr,Ti)O3 ceramics. . 88 Figure 5.9 The synchrotron radiation X-ray diffraction of 0.70BiFeO3-0.30BaTiO3 under the
zero and 50 kV/cm electric field with selected angle range (a) from 4o to 8o, (b) from 8o to 13o, and (c) from 14o to 20o. ... 89
Figure 5.10 The ratio of peak’s intensity measured at an electric field of 50 kV/cm to peak’s
intensity measured at zero electric field in SR-XRD for odd- and even-numbered peaks. ... 90
Figure 5.11 The model of Bi ions ordering under the electric field. ... 91 Figure 5.12 (a) Experimental results and (b) simulation results of peak intensity ratio of 50
kV/cm and zero electric field SR-XRD patterns. ... 93
Figure 5.13 Phase transition of BF30BT ceramics with various condition (temperature and
X
Chapter 6
Figure 6.1 The unit cell of ABO3 type perovskite with Bi off-centering. ... 101 Figure 6.2 Trend of the Structural parameters’ value expected in BiFeO3-BaTiO3 ceramics as
a function BaTiO3 concentration. ... 102 Figure 6.3 Synchrotron radiation X-ray diffraction of BiFeO3-BaTiO3 ceramics as a function
BaTiO3 concentration at 950 K. ... 104 Figure 6.4 The structural refinement results at 950 K with Bi3+ ion off-centered model in (a)
BF20BT and (b) BF40BT ceramics. ... 105
Figure 6.5 The structural parameters of BiFeO3-BaTiO3 ceramics as a function BaTiO3
concentration. ... 106
Figure 6.6 The bipolar S-E curves of BiFeO3-BaTiO3 ceramics as a function BaTiO3
concentration. ... 107
Figure 6.7 The origin of material softening with Bi3+ off-centering. ... 108
Chapter 7
Figure 7.1 The (111) peak of SR-XRD under the electric field in (a) BF20BT, (b) BF25BT, (c)
BF30BT, (d) BF35BT and (e) BF40BT ceramics. ... 116
Figure 7.2 The SR-XRD of (a) BF20BT, (b) BF25BT, (c) BF30BT, (d) BF35BT and (e)
BF40BT ceramics under the electric field with bipolar cycling. ... 117
Figure 7.3 The (111) lattice strain of BiFeO3-BaTiO3 ceramics as a function BaTiO3
concentration. ... 118
Figure 7.4 Electrical properties versus Bi off-centering displacement in BiFeO3-BaTiO3
ceramics; (a) remanent polarization vs. Bi off-centering displacement, (b) dielectric constant vs. Bi off-centering displacement, and (c) d33* vs. Bi off-centering. ... 119 Figure 7.5 Displacement of B-site (Fe/Ti) ion from the on-center position in BiFeO3-BaTiO3
ceramics as a function of BaTiO3 concentration. ... 120
Chapter 8
Figure 8.1 Electrical properties of BiFeO3-BaTiO3 as a function of BaTiO3 concentration; (a)
remanenet polarization versus d33* and (b) dielectric constant versus d33*. ... 125 Figure 8.2 Visualization of unit cell of 0.70BiFeO3-0.30BaTiO3 ceramics at room temperature
(300 K) and high temperature (950 K). ... 126
XI
on a published result of BiFeO3 [(J. Wang et al., Science 299, 1719 (2003)], synchrotron
radiation X-ray diffraction (SR-XRD_TC), and temperature dependence of dielectric constant
1
Chapter 1 Introduction and Background
1.1 Introduction
Nowadays, the new energy generation systems capable of harnessing energy from sustainable, renewable, and eco-friendly sources are needed because of the limited reserves and rapid depletion of eco-unfriendly non-renewable energy sources such as fossil fuels, natural gas, radioactive elements, etc.1 Energy-harvesting technology has attracted lots of attention as
one of the alternative solutions to these problems. Energy Harvesting is a technology that converts natural energy such as sunlight, wind, hydropower, and heat into electric energy as shown in Figure 1.1.
The concept of energy harvesting began with solar technology in 1954 on Bell laboratory in the United States. Prior to the development of technology, energy harvesting technology had a drawback of low sensitivity and limited applications due to device size problems. Recently, the energy harvesting technology has paid much attention in the development of miniaturized and
2
low power electronic devices due to an advancement in the semiconductor technology and the wireless communication technology. The electronic devices are becoming smaller and with a higher performance are heading towards the era of advanced ubiquitous. On the other hand, the issue of energy supply requires much research. Energy harvesting is the most attractive technology for these small electronic devices and studies on utilization techniques such as piezoelectric, heat, and triboelectricity. Especially, the piezoelectric energy harvesting has an advantage with high power density and wide application in comparison to other energy harvesting techniques.
Piezoelectric energy harvesting (PEH), a technology that is attracting attention as a next-generation energy source, converts energy such as vibration, pressure, etc., which are used in our daily lives into electric energy. Piezoelectric energy harvesting is based on the phenomenon that a potential difference is created in piezoelectric materials by the application of mechanical energy. The applied mechanical energy is responsible for net dipole moment and a compensating charge are formed that generate a flow of current. It is crucial to choose an appropriate piezoelectric material for piezoelectric energy harvesting.
An important factor in the piezoelectric energy harvesting is the figure of merit (FOM). FOM is a numerical expression which represents the performance in energy harnessing. The equation of FOM for energy harvesting is expressed as follows;2
FOM ≈ 𝑑33∙ 𝑆33 𝜀33
where d33 and s33 is piezoelectric coefficient and elastic compliance constant, respectively. The
33 is dielectric constant. Higher FOM values are required for high-performance piezoelectric
harvesting.
3
coefficient and low dielectric constant are required for obtain high performance in energy harvesting. Figure 1.2 shows dielectric constant versus piezoelectric coefficient in the lead-based and lead-free piezoelectric materials.3-25 The piezoelectric coefficient is usually increased with increasing dielectric constant because piezoelectric coefficient and dielectric constant are proportionally related. Therefore, the piezoelectric materials with high d33 values
and large dielectric constants cannot be used in the piezoelectric energy harvesting. The piezoelectric materials with high s33 value can be selected for high performance piezoelectric
energy harvesting. The s33 is strongly related to material’s softness. Higher the softness of the
material, larger will be the s33 value. The new piezoelectric materials with high s33 value are
needed to be developed for efficient piezoelectric energy harvesting.
Figure 1.2 The piezoelectric constant versus dielectric constant in lead-based and lead-free
4
Material softening can be observed in Bi-based lead-free piezoelectric materials. For example, ferroelectric properties of (Bi0.5Na0.5)TiO3 (BNT)-based materials tend to decrease
with composition ratio. The maximum positive strain, however, is exhibited in the particular composition ratio despite the diminution of negative strain.26,27 This material softening in BNT-based lead-free piezoelectric ceramics seems to be applicable to piezoelectric energy harvesting. However, the BNT-BT material is difficult to apply to real applications due to the depolarization temperature.
The BiFeO3-BaTiO3 (BFBT) materials have attracted attention as new lead-free piezoelectric
materials due to their high Curie temperature without depolarization temperature. Meanwhile, the piezoelectric charge constants; d33 are 324 and 420 pC/N in 0.97[0.67Bi1.05FeO3
-0.33BaTiO3]-0.03Bi1.05(Zn0.5Ti0.5)O3 and 0.67Bi1.05(Fe0.97Ga0.03)O3-0.33BaTiO3 ceramics with
466 and 454 oC Curie temperature, respectively.28 Material softening can also be observed in BFBT lead-free ceramics. However, the reason for the material softening has not yet been clarified.
In this study, the origin of the material softening is clarified through the study of electrical and structural characteristics of the BFBT lead-free piezoelectric ceramics, and the material design direction for a new lead-free piezoelectric material is proposed for high performance piezoelectric energy harvesting using the material softening.
1.2 Background
In this section, we review the basic concept of piezoelectricity and ferroelectricity. In addition, we briefly describe energy harvesting, and crystal structure analysis such as Rietveld structure refinement method and maximum entropy method (MEM).
5 1.2.1 Concept of energy harvesting
Energy harvesting is the process of transforming various forms of energy and preserving them in the form of electrical energy from discarded sources such as sunlight, geothermal, wind, vibration and pressure that are suitable for compact, wireless, autonomous devices or wearable electronic equipment. There are various ways to convert various forms of energies from different external sources to electrical energy.
The solar energy harvesters use solar cells to convert the sun's light (solar energy) into electric energy. These are mainly used for external applications in places that receive sunlight.29
Thermal energy harvesters are generally divided into two categories. The first type utilizes the Peltier effect to generate a voltage output from a temperature gradient whereas the second type generates a voltage output from a thermal gradient to produce useful energy from a heat source.30
Piezoelectric energy harvester converts mechanical vibrational energy and converts it into output voltage using piezoelectric, electromagnetic or electrostatic transducers. These harvesters are widely used for mechanical excitation sources such as vibrators and vibrations that induce air flow.31
The magnetoelectric effect is inducing magnetic (or electric) polarization by applying an external electric (or magnetic) field, and the effect can be linear or non-linear when applied the electric field or magnetic field. In general, the magnetoelectric effect is different on temperature and frequency. Magnetoelectric effect could be obtained from the composites of magnetostrictive and piezoelectric material.32
6 1.2.1.1 Piezoelectric energy harvesting
The piezoelectric materials are used in the electronics industry for devices such as actuators, sensors, transducers, and motors. Piezoelectric materials are very attractive due to their high energy conversion efficiency and high power generation, despite their relatively small weight and bulk, which is becoming more important as the renewable energy industry develops. Piezoelectric energy harvesters are more attractive sources of energy because of their stable operating conditions and their ability to convert vibrational energy into electrical energy at relatively low frequencies. Piezoelectric energy harvesters generally use low-frequency mechanical energy.
1.3 Piezoelectricity
The piezoelectric has a two interesting physical properties. The electrical polarization occurs in proportion to stress when a mechanical stress is applied to crystal; direct piezoelectric effect, and a mechanical deformation occurs in proportion to an electric field when an electric field is applied; converse piezoelectric effect. Jacques Curie and Pierre Curie first discovered piezoelectricity in 1880. The piezoelectricity was found in the various single crystals such as quartz and rochelle salt, etc. The research and application of piezoelectricity have begun by the period when quartz was applied to sonar during the First World War.
1.3.1 Piezoelectric effect
The piezoelectric effect is strongly related to occurrence of electric dipole moment. The piezoelectric effect has two different effects (direct piezoelectric effect and converse piezoelectric effect). The direct piezoelectric effect revealed is caused by polarization change when mechanical energy is applied. Changes in polarization are caused by rearrangement of
7
dipoles due to changes in the surrounding environment inducing dipoles, or changes in the direction of dipole moment due to changes in the direction in which molecules are arranged due to external stress. Therefore, the direct piezoelectric effect is revealed when the change in direction and size of polarization is occurred.
The inverse piezoelectric effect is indicated by mechanical deformation generated when an electric field is applied from the outside, contrary to the direct piezoelectric effect. The inverse piezoelectric effect is exhibited with bipolar strain – electric field curves as shown in Figure 1.3. When electric field and polarization are parallel, the lattice is expanded along the direction of electric field as shown in Figure 1.3(a) and 1.3(c), which is positive stain. On the other hand, the lattice is shrunk when polarization and electric field are antiparallel as shown in Figure 1.3(b) and 1.3(d), which is negative strain. The direct piezoelectric effect and the inverse piezoelectric effect are expressed by the following equations.
𝐷 = 𝑑𝑇 + 𝜀𝐸
𝑆 = 𝑠𝑇 + 𝑑𝑇𝐸
where D is electric displacement. E is electric field. S and T are strain and stress. d and s are piezoelectric constant and elastic compliance constant. ε is dielectric permittivity.33 According
to the equation, d can be expressed as a proportional relationship between displacement and stress or deformation and electric field as follows.
𝐷 = 𝐷 𝑇 =
𝑆 𝐸
When the unit is calculated based on the above formula, the unit of the piezoelectric charge constant (d33) is pC/N and the piezoelectric actuator constant (d33*) is pm/V, respectively.
8
Figure 1.3 A typical electromechanical hysteresis loop showing lattice expansion
9 1.3.2 Lead-free piezoelectric
The lead-based piezoelectric ceramics are widely used in the various electromechanical devices, because of their high piezoelectric property near the morphotropic phase boundary (MPB) composition.34-36 The highest piezoelectric coefficient and dielectric constant, and planar electromechanical coupling factor (Kp) are observed in PZT with MPB as shown in
Figure 1.4.37, 38 However, the toxicity of lead and lead-oxide has demanded the development
of alternative lead-free piezoelectric materials that are environmentally benign from the viewpoint of sustainable development.25,39,40
Various lead-free piezoelectric ceramics has been studied to replace lead-based piezoelectric ceramics. BaTiO3 (BT) is the typical ferroelectric material, well known for its large
piezoelectric response41,42, however, the Curie temperature (TC) of around 130 oC43,44 has
limited its application in diverse areas. The large piezoelectric properties have been reported for various BT-based lead-free piezoelectric ceramics such as (Bi,Na)TiO3-BaTiO3 (BNT-Figure 1.4 The piezoelectric coefficient and dielectric constant, and planar electromechanical
10
BT)45,46 and Ba(Ti,Zr)O3-(Ba,Ca)TiO3 (BTZ-BCT).47 The BNT-BT based system has a giant
strain,26,48-50 however, the depolarization temperature has limited its real application.49 On the other hand, the BTZ-BCT system has a large charge constant (d33) which is approximately 620
pC/N. However, this system is difficult to use in the real application, because of its low TC (93 oC).47
The (K, Na) NbO3 (KNN) is also attracting attention as a lead-free piezoelectric material,
which has been studied extensively. It is reported that characteristics of KNN-based lead-free piezoelectric materials are similar shown to those of commercial PZT.3 In addition, excellent
piezoelectric properties are exhibited around room temperature where the crystal structure is changed from orthorhombic to tetragonal structure. However, the hygroscopic nature of Na has been the impediment for this system.21,51
The BiFeO3 (BFO) materials have long been studied and are well-known for their high
polarization52 and high T
C (~ 1100 K).53,54 However, the reported d33 (~ 4.2 pC/N)55 of BFO is
extremely low, which could be enhanced by making its solid solution with BT, (Bi0.5K0.5)TiO3
(BKT), and BNT. 56-60 The solid solutions of BiFeO3-BaTiO3 (BF-BT) have been recently
studied and the reported TC for low BT content is over 400 oC. Meanwhile, the d33 are 134, 135,
and 104 pC/N in 0.75BiFeO3-0.25BaTiO3, 0.70BiFeO3-0.30BaTiO3, and 0.65BiFeO3
-0.35BaTiO3 composition, respectively.56-58 On the other hand, the d33 is 140 pC/N for BNT
doped BF-BT lead-free ceramics.60 Thus, BFO based piezoelectric ceramics have been viewed as promising candidate lead-free piezoelectric ceramics.
11 1.4 Ferroelectricity
Ferroelectricity refers to the property that a spontaneous polarization is caused by an external electric field and the polarization is reversed according to the polarity when the direction of the external electric field is changed. A substance having such properties is made to be a ferroelectric.
Most ferroelectrics have ABO3 type perovskite structure such as BaTiO3 (BT) as shown in
Figure 1.5. The A site has a relatively large cation at the corner of the unit cell and the B site is at the body center of the unit cell. And oxygen atoms are located at the center of each side of the unit cell. The ferroelectrics has a centrosymmetric crystal structure above Curie temperature (TC) that is changed to non-centrosymmetric crystal structure below TC. Therefore,
ferroelectrics has a spontaneous polarization. When the electric field is applied, the ferroelectric does not have a linear relationship with the electrical displacement, and has a hysteresis loop as shown in Figure 1.6. Initially, ferroelectric domains are randomly distributed. The ferroelectric domain aligns in the direction of the applied electric field. Therefore, the
12
initial polarization value is zero, and the polarization is saturated despite the increasing electric field which is called saturation polarization (Ps). Even if the external electric field is removed,
the polarization value has a certain polarization value caused by the remaining directional domain, which is called remanent polarization (Pr). The critical electric field is required to
switch the ferroelectric domain in the opposite direction which is called the coercive electric field (Ec).
Figure 1.6 A typical polarization-electric field hysteresis loop with characteristic domain
13 1.5 Outline of the thesis
In this chapter, the general concepts of piezoelectric energy harvesting, lead-free ceramics, ferroelectricity, and piezoelectricity were introduced. The experimental techniques including an introduction of synchrotron radiation X-ray sources, X-ray diffraction, Rietveld method, and maximum entropy method are presented in the Chapter 2.
In Chapter 3, the materials softening was ascertained with the accurate electrical properties in the BiFeO3-BaTiO3 lead-free ceramics which was prepared using heat treatment process.
The synchrotron X-ray diffraction (SR-XRD) seemed to be originated from the crystal structure with cubic-like symmetry in 0.70BiFeO3-0.30BaTiO3 (BF30BT) ceramics. Besides, the
maximum material softness was exhibited in the BF30BT. Therefore, the crystal structure was investigated from the SR-XRD by Rietveld method in the Chapter 4. The Bi off-centering was confirmed from the results in Chapter 4. The crystal structures of BF30BT ceramics investigated under the electric field are elaborated in Chapter 5.
The composition dependence of crystal structures at high temperature were investigated, which is discussed in Chapter 6. The material design direction using material softening by Bi off-center is proposed in the Chapter 7. Finally, the discussion of results are concluded in the Chapter 8.
References
1K.-I. Park, M. Lee, Y. Liu, S. Moon, G.-T. Hwang, G. Zhu, J. E. Kim, S. O. Kim, D. K. Kim,
Z. L. Wang, and K. J. Lee, Adv. Mater. 24, 2999 (2012).
2Y. Shimura, P. Pulpan, I. Fujii, K. Nakashima, and S. Wada, IOP Conf. Ser.: Mater. Sci. Eng. 18, 092060 (2011).
14
3Y. Saito, H. Takao, T. Tani, T. Nonoyama, K. Takatori, T. Homma, T. Nagaya, M. Nakamura,
Nature 432, 84 (2004)
4E. Hollenstein, M. Davis, D. Damjanovic, N. Setter, Appl. Phys. Lett. 87, 182905 (2005)
5Y. Saito, H. Takao, Ferroelectrics 338, 17 (2006)
6R. Wang, R. Xie, K. Hanada, K. Matsusaki, H. Bando, M. Itoh, Phys. Status Solidi, A Appl.
Res. 202, R57 (2005)
7R. Wang, R.J. Xie, K. Hanada, K. Matsusaki, H. Bando, T. Sekiya, M. Itoh, Ferroelectrics 336,
39 (2006)
8Y. Guo, K. Kakimoto, H9. Ohsato, Mater. Lett. 59, 241 (2005)
9Y. Guo, K. Kakimoto, H. Ohsato, Appl. Phys. Lett. 85, 4121 (2004)
10G.Z. Zang, J.F. Wang, H.C. Chen, W.B. Su, C.M. Wang, P. Qi, B. Q. Ming, J. Du, L.M. Zheng,
S.J. Zhang, T.R. Shrout, Appl. Phys. Lett. 88, 212908 (2006)
11Y. Yuan, S. Zhang, X. Zhou, J. Liu, Jpn. J. Appl. Phys. 45, 831 (2006)
12T. Takenaka, H. Nagata, J. Eur. Ceram. Soc. 25, 2693 (2005)
13J.S. Song, S.J. Jeong, I.S. Kim, D.S. Lee, E.C. Park, Ferroelectrics 338, 3 (2006)
14J. T. Zeng, K.W. Kwok, H.L.W. Chan, J. Am. Ceram. Soc. 89, 2828 (2006)
15S. Zhao, G. Li, A. Ding, T. Wang, Q. Yin, J. Phys. D: Appl. Phys. 39 2277 (2006)
16D. Berlincourt, in Ultrasonic Transducer Materials: Piezoelectric Crystals and Ceramics, ed.
By O.E. Mattiat (Plenum, London, 1971), Ch.2
15
18D. Schofield, R.F. Brown, Can. J. Phys. 35, 594 (1957)
19Y. Doshida, H. Kishi, Y. Hattori, A. Makiya, S. Tanaka, K. Uematsu, T. Kimura, in 12th US–
Japan Seminar on Dielectric and Piezoelectric Ceramics, ed. By C. Wu, H. Kishi, C. Randall, P. Pinceloup, H. Funakubo (Maryland, 2005), pp. 123–127
20R.E. Jaeger, L. Egerton, J. Am. Ceram. Soc. 45, 209 (1962)
21G.H. Haertling, J. Am. Ceram. Soc. 50, 329 (1967)
22L. Egerton, D.M. Dillon, J. Am. Ceram. Soc. 42, 438 (1959)
23W. Liu and X. Ren, Phys. Rev. Lett. 103, 257602 (2009)
24N. J. Donnelly, T. R. Shrout, and C. A. Randall, J. Am. Ceram. Soc. 90, 490 (2007)
25T. R. Shrout and S. J. Zhang, J. Electroceram. 19, 111 (2007).
26H.-S. Han, I.-K. Hong, Y.-M. Kong, J.-S. Lee, and W. Jo, J. Korean. Ceram. Soc. 53(2), 145
(2016).
27J. Hao, B. Shen, J. Zhai, C. Liu, and X. Li, J. Appl. Phys. 113, 114106 (2013).
28M. H. Lee, D. J. Kim, J. S. Park. S. W. Kim, T. K. Song, M.-H. Kim, W.-J. Kim, D. Do, and
I.-K. Jeong, Adv. Mater. 27, 6976 (2015).
29S. Sudevalayam and P. Kulkarni, IEEE Commun. Surv. Tutor. 13, 443 (2011).
30G. Ali, J. Wagner, D. Moline, and T. Schweisinger, Renewable Energy 74, 528 (2015).
31K. A. Cook-Chennault, N. Thambi, and A. M. Sastry, Smart Mater. Struct. 17, 043001 (2008).
32X. Bai, Y. Wen, J. Yang, P. Li, J. Qiu, and Y. Zhu, J. Appl. Phys. 111, 07A938 (2012).
16
34B. Jaffe, W. R. Cook, and H. Jaffe, Piezoelectric Ceramics (Academic, London, 1997).
35C. K. Jeong, J. Lee, S. Han, J. Ryu, G.-T. Hwang, D. Y. Park, J. H. Park, S. S. Lee, M. Byun,
S. H. Ko, and K. J. Lee, Adv. Mater. 27, 2866 (2015).
36Piezoelectric actuator and ultrasonic motors, edited by K. Uchino (Kluwer Academic
Publishers, Boston, 1997).
37S. Zhang, R. Xia, and T. R. Shrout, J. Electroceram. 19, 251 (2007).
38B. Jaffe, R. S. Roth, and S. Marzullo, J. Appl. Phys. 25, 809 (1954)
39J. Rödel, W. Jo, K. T. P. Seifert, E-M. Anton, and T. Granzow, J. Am. Ceram. Soc. 92 [6],
1153 (2009).
40J. Rödel, K. G. Webber, R. Dittmer, W. Jo, M. Kimura, and D. Damjanovic, J. Eur. Ceram.
Soc. 35, 1659 (2015).
41H. Takahashi, Y. Numamoto, J. Tani, and S. Tsurekawa, Jpn. J. Appl. Phys. 45, 7405 (2006).
42S. Shao, J. Zhang, Z. Zhang, P. Zheng, M. Zhao, J. Li, and C. Wang, J. Phys. D: Appl. Phys. 42, 189801 (2009).
43K. Sakayori, Y. Matsui, H. Abe, E. Nakamura, M. Kenmoku, T. Hara, D. Ishikawa, A.
Kokubu, K. Hirota, and T. Ikeda, Jpn. J. Appl. Phys. 34, 5443 (1995).
44K. Kinoshita and A. Yamaji, J. Appl. Phys. 47, 371 (1976).
45Y. S. Sung, J. M. Kim, J. H. Cho, T. K. Song, M. H. Kim, and T. G. Park, Appl. Phys. Lett. 96, 202901 (2010)
46W. Zeng, X. Zhou, J. Chen, J. Liao, C. Zhou, Z. Cen, T. Yang, H. Yang, Q. Zhou, G. Chen,
and C. Yuan, Appl. Phys. Lett. 104, 242910 (2014)
17
48S.-T. Zhang, A. B. Kounga, E. Aulbach, H. Ehrenberg, and J. Rödel, Appl. Phys. Lett. 91,
112906 (2007).
49J. Hao, B. Shen, J. Zhai, C. Liu, X. Li, and X. Gao, J. Appl. Phys. 113, 114106 (2013). 50W. Jo, R. Dittmer, M. Acosta, J. Zang, C. Groh, E. Sapper, K. Wang, and J. Rödel, J.
Electroceram. 29, 71 (2012).
51R. Zuo, J. Rödel, R. Chen, and L. Li, J. Am. Ceram. Soc. 89 [6], 2010 (2006).
52J. B. Neaton, C. Ederer, U. V. Waghmare, N. A. Spaldin, and K. M. Rabe, Phys. Rev. B 71,
014113 (2005).
53J. Wang, J. B. Neaton, H. Zheng, V. Nagarajan, S. B. Ogale, B. Liu, D. Viehland, V.
Vaithyanathan, D. G. Schlom, U. V. Waghmare, N. A. Spaldin, K. M. Rabe, M. Wutting, R. Rameshi, Science 299, 1719 (2003).
54I. M. Sosnowska, J. Microscopy. 236, 109 (2009).
55Z. Dai and Y. Akishige, J. Phys. D: Appl. Phys. 43, 445403 (2010).
56Y. J. Lee, J. S. Kim, S. H. Han, H.-W. Kang, H.-G. Lee, C. I. Cheon, J. Kor. Phys. Soc. 61,
947 (2012).
57Y. Wei, X. Wang, J. Zhu, X. Wang, and J. Jia, J. Am. Ceram. Soc. 96, 3163 (2013). 58Y. Wie, X. Wang, J. Jia, and X. Wang, Ceramics International 38, 3499 (2012).
59C. Zhou, X. Liu, and W. Li, Mater. Sci. Eng. B. 153, 31 (2008).
60Y. Li, N. Jiang, K. H. Lam, Y. Guo, Q. Zheng, Q. Li, W. Zhou, Y. Wan, and D. Lin, J. Am.
18
Chapter 2 Experimental Techniques
2.1 Synchrotron radiation X-ray sources
The SPring-8 consists of a linear accelerator, a booster synchrotron, and a storage ring as shown in Figure 2.1. Electrons emitted from the electron gun are accelerated to 1 GeV by a high electric field using a linear accelerator. Electrons accelerated to 1 GeV are moved to the booster synchrotron where the electrons are accelerated to the total energy of 8 GeV. The electrons has an almost the speed of light in the booster synchrotron. Accelerated electrons are then injected into the storage ring. The SPring-8's storage ring is approximately 396 meters in diameter and the storage ring has 44 straight sections connected to the bend section. X-rays are emitted from bending magnets placed at circular arc or at magnetic insertion device such as a wigglers or undulators in a straight section. The X-rays generated in this way go to the experimental building. SPring-8 has various sectors according to the experimental type. Among them, we used the BL02B2 beamline for our research.
Figure 2.1 The SPring-8, a third generation synchrotron radiation source. The linear
accelerator, booster synchrotron, and storage ring are labelled in the figure (From www.Spring8.or.jp).
19 2.1.1 BL02B2 beam line
The BL02B2 beam line is a powder diffraction beam line which use high energy radiation. The BL02B2 beamline covers a wide range of fields from qualitative analysis of powder samples to studies of structural properties closely related to the manifestation of physical properties. The design of the diffractometer is a combination of a large-scale device using an imaging plate as a detector and a multi-stage diffractometer of a one-dimensional semiconductor detector. The energy range is 12 to 35 keV and the energy resolution is ΔE / E = ~ 2 × 10⁻⁴.
The measurement temperature can be changed over a wide range from 20 K to 1073 K. The low-temperature, high-temperature nitrogen injection system is permanent, and the sample temperature can be continuously controlled from 90 K to 1073 K. When cooling down to 90K or less, a He gas injection device is used to cool the sample. In addition, the stage of low-temperature and high-low-temperature nitrogen injection system is assimilated and it is not necessary to install and remove equipment when switching between low temperature and high temperature.
The BL02B2 experimental hatch is also equipped with a semiconductor detector multi-turn diffractometer, and a one-dimensional semiconductor detector (MYTHEN) manufactured by DECTRIS is placed on the 2θ-axis in multiple positions. The MYTHEN detector is capable of reading diffraction data directly at speeds of several tens of milliseconds or more.
2.2 X-ray diffraction
The initial collimated X-ray beam is scattered in all directions by the atoms. The intensity of scattered X-ray in most direction, however, is zero in the periodic structure. The enhanced beam is scattered in several directions, which is called diffraction. X-ray diffraction of
20
crystalline solids occurs because the wavelength of X-rays is approximately the same as the interatomic distance determined.
X-ray diffraction is the result of reinforcement/constructive or destructive interference due to the phase relationship between the beams of elastically scattered X-rays. The path difference between X-rays scattered from plane 1 and 2 is OA̅̅̅̅+OB̅̅̅̅=dsin + dsin as shown in Figure 2.2.
In order to have constructive interference of scattered X-rays, the distance of OA + OB must be equal to the constant wavelength of X-ray radiation. Thus, OA̅̅̅̅+OB̅̅̅̅=n (n=1,2,3,…). Since OA
̅̅̅̅+OB̅̅̅̅=dsin + dsin = n, 2d sin =n which is called Bragg's Law.
For example, it is possible to consider planes of unit cells rather than planes of atoms in more complex crystals. The incident X-ray are scattered by atoms of each unit cell. The intensity and phase of the X-rays scattered by a unit cell can be expressed using the structure factor, which is the sum of scattered X-rays from the all atoms of the unit cell.
21 2.3 Rietveld method
The Rietveld method was proposed by Rietveld in 1969 as a method of analyzing the crystal structure by comparing the diffraction pattern measured by the X-ray diffraction experiment or the neutron diffraction experiment with the calculated pattern.1 In particular, since the Rietveld method uses the entire profile of the diffraction pattern, it is possible to obtain a structural parameter with considerable precision even when the peak overlap is severe. Therefore, it has an advantage that it is very easy to analyze a powder sample or a sample having a complex diffraction image. The Rietveld method is characterized by theoretically calculating the total diffraction pattern and refinement of the given parameters into a least-squares method until an optimal match between the calculated pattern and the observed diffraction pattern occurs. The calculated pattern is based on a structural model constructed to fit the crystal structure, the diffraction optics effect, the instrumental factor, and the properties of the sample (lattice parameter, etc.). The actual refinement through the Rietveld method is the variables in the model built for structural analysis. An important feature is that feedback occurs between the improved knowledge of the structure obtained during the refinement process and the improved assignment of the observed intensity to each Bragg reflection where peak superposition occurs. The minimum quantities in the least squares refinement using the Rietveld method are residual,
Sy.2
𝑆𝑦 = ∑ 𝑤𝑖(𝑦𝑖 − 𝑦𝑐𝑖)2 𝑖
where wi is 1/yi, yi is the observed intensity at the i-th stage of the diffraction pattern, and yci is
the calculated intensity at the i-th stage. The calculated intensity yci is determined by the sum
of the Bragg reflection intensity yBi and the background intensity yib.
𝑦𝑐𝑖 = 𝑦𝐵𝑖+ 𝑦𝑖𝑏 = 𝑠 ∑ 𝐿(𝑄𝐾)|𝐹𝐾|2∅(2𝜃
𝑖 − 2𝜃𝐾)𝑃𝐾𝐴 + 𝑦𝑖𝑏 𝐾
22
where s is the scale factor and K is the Miller indices of the Bragg reflections (h, k, l). L(QK)
includes a Lorentz factor, a polarization factor, a multiplicity factor. FK is a structure factor,
and i and K are a reflection profile function. PK is a correction factor for preferred orientation,
and A is an absorption factor. The structural factor FK in Equation 3.2 is expressed as follows;
𝐹𝐾 = ∑ 𝑔𝑖𝑓𝑖𝑇𝑖𝑒𝑥𝑝[2𝜋𝑖(ℎ𝑥𝑗+ 𝑘𝑦𝑗+ 𝑙𝑧𝑗)]
where j is the original number in the unit cell, gi is the occupancy. fi is the atomic scattering
factor, and Ti is the temperature factor. The position 2 of the diffraction included in Equation
3.2 is related to the lattice constants a, b, c, , , and . Finally, the Rietveld method is used to refine the structural parameters (such as occupancy, atomic position and temperature factor) and lattice constants.
2.3.1 Principle of Rietveld refinement
Diffraction patterns and the shape of the profile are calculated using mathematical functions related to crystallographic data that are already known as an initial input structure model of Rietveld purification. After that, the observed pattern is compared with the calculated diffraction pattern to calculate Sy through the least squares method. The statistical error was
computed from the refined structural parameters, then the evaluated variables were entered into the initial structural model if the error value was above the tolerance level, and the recalculation was performed using the improved structural model. When the error was less than the allowable value, the calculation was terminated and the final refined structural parameters were taken as the information related to the decision structure.
23 2.4 Maximum entropy method
The maximum entropy method (MEM) is used to obtain the electron density distribution within the unit cell from the structural factor of the crystal through Fourier inversion transform. In principle, an infinite number of Fourier coefficients is required to perform an accurate Fourier inversion transform. However, it is practically difficult to satisfy such a condition. Therefore, the Fourier inversion transform have been performed using the finite number of Fourier coefficients obtained through experiments, and the experimental error has been ignored. This process implies that all missing Fourier coefficients are assumed to be zero. This is the highly biased assumption of missing information in terms of the maximum entropy method. Because of the difficulty of experimental measurements, there is no reason why all the missing structural parameters are set to zero.
The maximum entropy method (MEM) is used to obtain the electron density distribution within the unit cell from the structural factor of the crystal through Fourier inversion transform. The MEM is an approach that estimates the most objective model within the bounds of limited information by maximizing the information entropy under constraints that it must match the observed physical properties. The maximum entropy method estimates the three - dimensional electron density distribution by allowing the maximum deviation of the structural factor Fcal
within the error limits of the observed structural factor Fobs. Especially for high reflections
which have been excluded in the analysis of powder diffraction data, the termination effect is insufficient because it estimates a non-zero Fourier coefficient. These advantages make it possible to obtain a clearer electron density distribution than the electron density distribution obtained by the conventional Fourier synthesis.
24 2.4.1 Advantage of maximum entropy method
The maximum entropy method (MEM) is a method for extracting the maximum information from a probability distribution that maximizes entropy using partial information within a limited data limit. The MEM is a multipurpose method used in various fields.3-6 The MEM is based on a mathematical theory called Bayesian probability theory called information theory and the law of conditional probability. It was designed to reproduce the most probable and least biased probability distributions under underdetermined conditions. The maximum entropy method has been successfully applied in various fields such as radio astronomy and image reconstruction. Figure 2.3 shows an example of the maximum entropy method used to improve the image in the field of image restoration technology.3
Figure 2.3 The example of the maximum entropy method used to improve the image in the
25
The MEM has the advantage of providing a least biased reasoning from a limited amount of information without modeling. Therefore, many theoretical studies began to be applied to the field of crystallography in the 1980s.7 Such attempts have been successfully applied in the field
of crystallography by Sakata and Sato in 1990 by finding the exact electron density distribution of silicon single crystals through the maximum entropy method.8
The maximum entropy method has the following advantages. First, an accurate electron density map can be obtained. Even though forbidden reflections are not included in the analysis, the presence of bonding electrons is clearly visible within the maximum entropy. Second, it takes a long time to find a suitable model and eliminates the need to find a complex initial structural model. Third, the resolution of the electron density distribution map calculated by the MEM is much better than that of the electron density distribution map obtained from the general Fourier transform method.
2.4.2 Maximum entropy method applied in the crystallographic
The method of applying the maximum entropy method (MEM) in the field of crystallography continues to develop to the present. The MEM / Rietveld method was proposed by Takata et al., in 1995.9 This method is a combination of the Rietveld method and the maximum entropy method, which is one of the crystal structure analysis methods. From the X-ray powder diffraction data, the structure factor is determined through the Rietveld method, and the result is used as the input data of the maximum entropy method. However, this method has limitations in that the structural factor values obtained by the Rietveld method have an effect due to the structural model used in the initial Rietveld analysis. The effect of the structural model is to increase the degree of overlap of the reflections in the diffraction data. As a method to improve such a limit point, the value of the structural factor is calculated from the electron density data
26
obtained by using the maximum entropy method through the Fourier transformation, and this is again applied to the maximum entropy method. MPF Method (MEM-based pattern fitting) was developed.6
The distribution of the charge density using the maximum entropy method has been successfully applied to superconducting oxide,10,11 manganese compound,12 fullerene compound,13-15 zeolite, etc.16 And, it is also used to determine the distribution of binding
electrons associated with hybrid orbitals and to visualize them.17-23
The analysis of the electron density distribution using the maximum entropy method can confirm the change of the bonding characteristics between the atoms even if the structural phase transition does not occur. It is possible to experimentally observe the presence of covalent bonds associated with orbital hybridization, especially in ferroelectric materials.
2.4.3 Principle of maximum entropy method
The process of calculating the maximum entropy is as follows. First, the structural factor
F(hj) obtained from X-ray diffraction is expressed as follows;
𝐹(ℎ𝑗) = ∫ 𝑞(𝑟) 𝑒𝑥𝑝(𝑖2𝜋ℎ𝑗𝑟)𝑑𝑟
where, hj and q(r) are jth of reflection index and electron density at r, respectively. The electron
density is discretized by dividing the unit cell into pixels and treated information as in MEM analysis. After that, a dimensionless electron density, rk is introduced, which is defined as;
𝜌𝑘 = 𝑞(𝑟𝑘)/𝑄𝑡𝑜𝑡
where, Qtot is total charge in the unit cell. The q(rk) is pixel average electron density in the pixel
27
𝑆(𝜌) = − ∑ 𝜌𝑘log 𝜌𝑘 𝑁𝑝𝑖𝑥
𝑘
where, Npix is number of pixel.
The maximum entropy method is based on the constraint that the structural factor FMEM(hj)
calculated from the MEM electron distribution coincides with the observed structural factor
Fobs(hj) within the limits of the standard deviation j. The k is estimated for the evaluation of
the density distribution maximum of the entropy. These constraints are expressed as follows;
𝐶(𝜌) = 1 𝑀𝑟𝑒𝑓 ∑ 1 𝜎𝑗2|𝐹𝑜𝑏𝑠(ℎ𝑗) − 𝐹𝑀𝐸𝑀(ℎ𝑗)| 2 < 1 𝑀𝑟𝑒𝑓 𝑗=1
where, Mref is number of structural factors used in the analysis. The structural factors calculated
from the MEM electron density are as follows;
𝐹𝑀𝐸𝑀(ℎ𝑗) = 𝑉𝑄𝑡𝑜𝑡∑ 𝜌𝑘𝑒𝑥𝑝(𝑖2𝜋ℎ𝑗𝑟𝑘) 𝑁𝑝𝑖𝑥
𝑘=1
where, V is volume of unit cell. The above equation can be solved as follows using the Lagrange undetermined coefficient method.
𝜌𝑘 = 𝜏𝑘𝑒𝑥𝑝 (−𝜆 𝜕𝐶 𝜕𝜌𝑘 ) 𝐶(𝜌) = 1 𝑀𝑟𝑒𝑓 ∑ 1 𝜎𝑗2|𝐹𝑜𝑏𝑠(ℎ𝑗) − 𝐹𝑀𝐸𝑀(ℎ𝑗)| 2 𝑀𝑟𝑒𝑓 𝑗=1
where, k is prior density distribution. MEM analysis is the process of repeating the above three
expressions repeatedly.
28
ratio of total number of electrons in the crystal to the volume of unit cell that is based on the assumption that electrons are uniformly distributed in the unit cell. A new electron density ρ(r) is obtained in the direction of increasing entropy from the preliminary electron density τ(r). And then, the newly calculated ρ(r) is used as the value of τ(r) and calculation is performed again. This process is repeated until a reasonable error between the observed structural factor (Fobs) and calculated structural factor, evaluated by Fourier transform, is obtained.24
References
1H. M. Rietveld, J. Appl. Cryst. 2, 65 (1969).
2R. A. Young, The Rietveld Method, Ed., Oxford University Press (1993).
3R. N. Silver, D. S. Sivia and J. E. Gubernatis, Phys. Rev. B 41, 2380 (1990).
4L. Palatinus and S. van Smaalen, Acta Crystallogr. Sect. A 61, 363 (2005).
5L. Palatinus and S. van Smaalen, Z. Kristallogr. 219, 719 (2004).
6F. Izumi, Solid State Ionics 172, 1 (2004).
7D. M. Collins, Nature (London) 298, 49 (1982).
8M. Sakata and M. Sato, Acta Cryst. A 46, 263 (1990).
9M. Takata, B. Umeda, E. Nishibori, M. Sakata, Y. Saito, M. Ohno and H. Shinohara, Nature 377, 46 (1995).
10M. Takata, E. Nishibori, T. Takayama, M. Sakata, K. Kodama, M. Sato and C. J. Howard,
Physica C 263, 176 (1996).
11M. Takata, T. Takayama, M. Sakata, S. Sasaki, K. Kodama and M. Sato, Physica C 263, 340
29
12M. Takata, E. Nishibori, K. Kato, M. Sakata and Y. Moritoma, J. Phys. Soc. Jpn 68, 2190
(1999).
13M. Takata, E. Nishibori, B. Umeda, M. Sakata, E. Yamamoto and H. Shinohara, Phys. Rev.
Lett. 78, 3330 (1997).
14E. Nishibori, M. Takata, M. Sakata, and H. Shinohara, J. Synchrotron Rad. 5, 977 (1998).
15M. Takata, E. Nishibori, M. Sakata, M. Inakuma, E. Yamamoto and H. Shinohara, Phys. Rev.
Lett. 83, 2214 (1999).
16K. Hasegawa, E. Nishibori, M. Takata, M. Safata, N. Togashi, J. H. Yu and O. Terasaki, Jpn
J. Appl. Phys. 38, 65 (1999).
17Y. Kuroiwa, S. Aoyagi, A. Sawada, J. Harada, E. Nishibori, M. Takata and M. Sakata, Phys.
Rev. Lett. 87, 217601 (2001).
18Y. Shimakawa, H. Imai, H. Kimura, S. Kimura, Y. Kubo, E. Nishibori, M. Takata, M. Sakata,
K. Kato and Z. Hiroi, Phys. Rev. B 66, 144110 (2002).
19K. Kato, M. Takata, E. Nishibori, M. Sakata, N. Hamada and Y. Moritomo, J. Phys. Soc. Jpn 74, 2137 (2005).
20K. Kato, Y. Ohishi, M. Takata, E. Nishibori, M. Sakata and Y. Moritomo, Phys. Rev. B 71,
012404 (2005).
21A. Ohno, S. Sasaki, E. Nishibori, S. Aoyagi, M. Sakata and B. B. Iversen, Phys. Rev. B 76,
064119 (2007).
22K. Takase, K. Sato, O. Shoji, Y. Takahashi, Y. Takano, K. Sekizawa, Y. Kuroiwa and M. Goto,
Appl. Phys. Lett. 90, 161916 (2007).
30 Miyayama, Appl. Phys. Lett. 91, 062913 (2007).
24T. Noritake, M. Aoki, S. Towata, Y. Seno and Y. Hirose, R & D Review of Toyota CRDL 38,
31
Chapter 3 Measurement of electrical properties in high quality samples,
and proposal of new phase diagram for BiFeO
3-BaTiO
3ceramics
3.1 Introduction
Lead-based piezoelectric ceramics, such as Pb(Zr,Ti)O3 (PZT), are the dominant
piezoelectric materials that are being used in various electromechanical devices owing to their extraordinary properties in the vicinity of morphotropic phase boundary (MPB)1-3, which is marked by the coexistence of two ferroelectric phases and the properties enhancement at a MPB is associated with easy paths for polarization rotation.4 However, because of the high toxicity of lead oxide, the use of the lead-based piezoelectric ceramics has caused serious lead pollution and environmental problems.5-7
Various lead-free piezoelectric ceramics have been extensively studied as a replacement for the existing lead-based ones. The explored (K,Na)NbO3 (KNN) and (Bi0.5Na0.5)TiO3 (BNT)
based lead-free piezoelectric ceramics with MPB composition are considered to be promising lead-free piezoelectric materials. The KNN-based piezoelectric system; (K0.44Na0.52)(Nb0.86Ta0.10)O3+0.04LiSbO3 and Sb-doped other forms with MPB and/or
polymorphic phase transition (PPT) has shown excellent electrical properties.8-11 However, the hygroscopic nature of Na has been the impediment for this system.12,13 Besides KNN-based materials, the BNT-based piezoelectric ceramics also exhibit superior piezoelectric properties near the MPB composition.14-17 Moreover, BNT-KNN system has a giant strain of 0.62% with
0.18% remanent strain.18 However, the presence of depolarization temperature (Td) in the case
of the BNT-based system may limit its usage at higher temperatures.19 In general, the operational temperature of piezoelectric ceramics is limited by their ferroelectric to non-ferroelectric transition temperature; the Curie temperature (TC) and usually it is limited to
32
temperature.20-22 The upper working temperature for Pb(Zr0.52Ti0.48)O3 (MPB composition) is
150 oC with a TC of 386 oC. Therefore, the search for piezoelectric ceramics, particularly
lead-free, aiming at high-temperature applications has always been crucial in the field of piezoelectric ceramics.
The BiFeO3-based lead-free piezoelectric thin films and bulk ceramics have been
studied.23,24 The BiFeO
3-based lead-free piezoelectric materials have shown a promising
potentiality as a likely successor to lead-based piezoelectric materials recently because of their prominent electrical properties and high operating temperature.25-27 Meanwhile, the piezoelectric charge constants; d33 are 324 and 420 pC/N in 0.97[0.67Bi1.05FeO3-0.33BaTiO3
]-0.03Bi1.05(Zn0.5Ti0.5)O3 and 0.67Bi1.05(Fe0.97Ga0.03)O3-0.33BaTiO3 ceramics with 466 and 454 oC Curie temperature, respectively.28
One of the major issues for BiFeO3-BaTiO3 lead-free system is structural phase transition.
M. M. Kumar et al. investigated the complete compositional range of (1-x)BiFeO3-xBaTiO3
solid solutions ceramics and reported three kinds of crystal structures such as rhombohedral (BiFeO3-rich, x = 0.00 ~ 0.33), cubic (intermediate, x = 0.33 ~ 0.92), and tetragonal (BaTiO3
-rich, x = 0.92 ~ 1.00).29 On the other hand, R. E. Eitel et al. reported the change of crystal structure from rhombohedral to pseudo-cubic (polar) structure at 0.75BiFeO3-0.25BaTiO3
composition.30 M. H. Lee et al. have recently reported that the MPB with rhombohedral and
tetragonal structure exists at 0.67BiFeO3-0.33BaTiO3 compound.28 The information of
BiFeO3-BaTiO3 system’s composition with structural phase transition is still unclear.
In this chapter, BiFeO3-BaTiO3 (BFBT) lead-free piezoelectric ceramics, with varying
concentrations of BaTiO3, were prepared by a solid-state reaction method. The speculation of
structural phase transition in BFBT piezoelectric system is made based on the study of temperature-dependent crystal structure investigated using high-resolution synchrotron X-ray
33
diffraction, and their dielectric, ferroelectric, and piezoelectric properties evaluation. In order to study the structural phase transition in BFBT system, the crystal structures as a function of temperature were investigated by synchrotron radiation X-ray diffraction.
3.2 Experimental details
The (1-x)BiFeO3-xBaTiO3 [ BFxBT, x = 0.10 (BF10BT), 0.20 (BF20BT), 0.25 (BF25BT),
0.30 (BF30BT), 0.33 (BF33BT), 0.35 (BF35BT), and 0.40 (BF40BT)] lead-free ceramics were fabricated by conventional solid-state reaction method using BiFeO3 (BF, Nippon Chemical
Industrial) and BaTiO3 (BT, Sakai Chemical Industry Co. Ltd.) powders. The mixed powders
were ball-milled with zirconia balls in ethanol medium for 24 h. The ball-milled powders with ethanol were dried in drying oven at 80 oC for 4 h and were calcined at 800 oC for 6 h followed by re-ball milling and oven-drying. A binder; polyvinyl butyral (PVB) was added to the dried powders for uniaxial pressing. The pellets were formed with 10 mm diameter and 1 mm thickness and the PVB binders were removed by heating at 700 oC for 10 h. The samples were sintered at 990 oC ~ 1010 oC for 4 h depending on their composition ratios. Both surfaces of the sintered pellets were polished and were processed to samples with two types of geometry for the measurement of electrical properties; [4 mm (length), 1.5 mm (width), and 0.4mm (thickness)] and piezoelectric property [1 mm (length), 1mm (width), and 4mm (thickness)]. The samples were annealed at 800 oC for 20 h and were quenched in water. The heat treatment was performed to enhance the ferroelectric and piezoelectric properties by de-pinning domain walls from defect dipole and mechanical stress relaxation.31-33
The ceramics densities are 93.14% (BF20BT), 93.16% (BF25BT), 94.11% (BF30BT), 92.46% (BF33BT), 92.42% (BF33BT), and 92.44% (BF40BT), which was investigated by an Archimedes method as shown in Figure 3.1. The crystal structures were investigated using
34
laboratory X-ray diffractometer (Ultima IV, Rigaku) and high-resolution synchrotron X-ray radiation. The gold (Au) electrodes were then coated on the both surfaces of the water-quenched samples by an ion sputtering for the measurement of electrical properties. The ferroelectric and piezoelectric properties were investigated from the polarization-electric field (P-E) hysteresis loops and strain-electric field (S-E) curves by ferroelectric and strain measuring system (JP005-SE, Kitamoto Denshi) and linear variable differential transformer (LVDT, Millitron 1202 IC, Mahr). The samples were poled under the DC electric field of 60 kV/cm and the piezoelectric charge constants (d33) were investigated by the resonance and
antiresonance method, which was measured by an impedance analyzer (HP4294, Agilent Technologies). The Curie temperature was investigated from temperature-dependent dielectric permittivity measurements by an LCR meter (Wayne Kerr Electronics 6440B).
Figure 3.1 The absolute and relative density of BiFeO3-BaTiO3 ceramics as a function BaTiO3