近畿大学学術情報リポジトリ
55
0
0
全文
(2) (~xJ!~). Molecular characterization of the Mg2+ stimulon of Escherichia coli.. Shu Minagawa. March, 2005. Graduate School, Kinki University Division of Agricultural Science Major: Applied Bioscience (Adviser: Prof. Ryutaro Utsumi). *Mh~. Mg2+ stimulon. i)i.*$*$~. O))t-T~fft. .$1iJf~#. J;t ffl1: 1frl1l:: $ ~J;Q: ~)II (m~. ~. : Ii'Jm. rmj(~B. ~~). Submitted to the Graduate school, Kinki University, to fulfill the requirement for the Doctorate Degree..
(3) ABBREVIATIONS. A. alanine. ATP. adenosine 5'-triphosphate. Apr. ampicillin resistant. bp. base pair. BPB. bromophenol blue. BSA. bovine serum albumin. cpm. counts per minute. D. aspartic acid. Da. dalton. DNA. deoxyribonucleic acid. DNase. deoxyribonuclease. DTT. di thiothrei tol. EDTA. ethylenediaminetetraaceta te. HEPES. N -2-Hydroxyethylpiperazine-N'-2-ethanesulfonic acid. H. histidiene. HK. histideine kinase. IPTG. isopropyl-l-thio- {3 -D-galactopyranoside. kb. kilobases. L. leucine. LB medium. Luria -Bertani medium. OD. optical density. ORF. open reading frame. PAGE. polyacrylamide gel electrophoresis.
(4) PBS. phospha te-buffered saline. PCR. polymerase chain reaction. PMSF. phenylmethylsulfonyl fluoride. RNA. ribonucleic acid. RNAP. RNA polymerase. RR. response regulator. SDS. sodium dodecyl sulfate. TCS. two-component system. Tris. Tris(hydroxymethyl) aminomethane. MG 1307/pHOU9. MG 1307 containing pH0119.
(5) CONTENTS CHAPTER I. Introduction. 1. CHAPTER II. Molecular mechanism of Mg2+ stimulon: PhoQ-PhoP two-component signal transduction system. 7. CHAPTER III. Molecular characterization of Mg2+ sensor PhoQ. 22. CHAPTER N. CONCLUSION. 38. ACKNOWLEGEMENTS. 41. REFFERENCES. 43. PUBLICATIONS. 49.
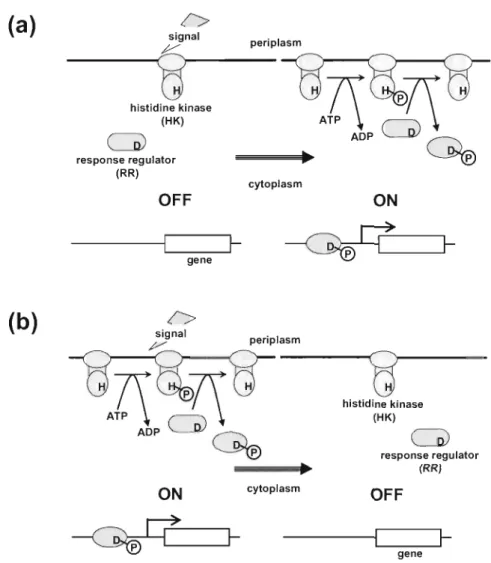
(6) CHAPTER I. Introduction The two-component signal transduction system is the major system in bacteria for sensing environmental stresses and transducing the information inside the cells [Hoch, J. A. and Silhavy, T. J. 1995). It was discovered by J. A. Hall and T. J. Silhavy [ Hall, M. N. and Silhavy, T. J. 1981] in Escherichia. coli; they found that the outer membrane protein genes (ompF and ompC) are regulated by two proteins-the cytoplasmic protein (OmpR), and the membrane protein (EnvZ)-in response to changes in osmolarity. This study suggested that environmental information must be relayed across a membrane protein, a process of signal transduction. Since then, many similar systems have been reported with thanks, in part, to the progress made in bacterial genomic analysis, and are termed two-component systems (TeSs) [Nixon, B. T. et aI., 1986). TCSs comprise a histidine kinase (HIO sensor residing in the inner membrane and a cognate response regulator (RR) in the cytoplasm. The HK sensor monitors a particular environmental signal using three enzymatic activities: (i) autophosphorylation at its histidine residue from ATP; (ii) transfer of the phosphoryl group to the conserved aspartate residue of its cognate RR; and (iii) dephosphorylation of the phosphorylated cognate RR [Stock, A. M. et aI., 2000). RRs are mostly DNA-binding transcription factors whose affinities for their target promoters are modulated by phosphorylation. Hence, alterations of the phosphorylated state of RRs result in different gene expression profiles. (Fig. 1). 1.
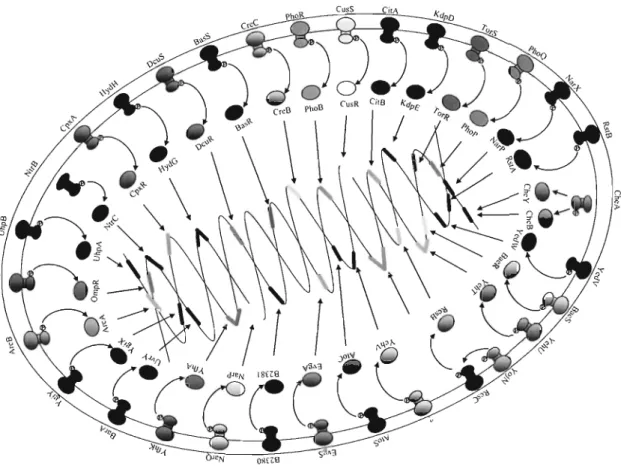
(7) (>. (a). signal. p eriplasm. 9. hi sti dine ki nase (HK). CD). ~. response regulato r (RR) cytoplasm. OFF. ON. lgene. ~. f-. (>. (b). s ignal. peripl asm. "v-:. g h istid ine ki nase (HK). CD) ~ cytop lasm. ON. ~. f-. response regulator (RR). OFF. gene. f-. Fig . 1 Bacterial Two-component s ignal transduction system , TCS . Wh en a suitable signal(s) is sensed, HK adopts a co nformatio n that is activated (a) or rep ressed (b) and changes the am ount of the cog nate phosph o-regulator to reg ulate the expression of target genes . H; phosphorylated histidine residue, D; phosphorylated aspartate resid ue.. A large number of TCSs have been identified in bacteria, indicating the widespread nature of these systems . In E. coh 29 HKs, 32 RRs and one HPt (histidine-containing phosphotransmitter) domain have been found by analyses of the E. coli K-12 genome [Mizu no, T. 1997] (Fig. 2). Using the DNA microarray technique, T. Oshima et al. performed a global analysis of TCS mutants of E. coli. As a result, they predicted that PhoQ- PhoP system should regulate the expression of over 20 genes directly or indirectly by extracellular Mg2+.. 2.
(8) Fig. 2. Genes encoding two-component system in E. coli.. PhoQ/PhoP is a TCS that governs virulence, mediates the adaptation to Mg2+-limited environments, and regulates numerous cellular activities in several Gram-negative species [Groisman, E. A. , 2001]. It consists of the inner membrane sensor PhoQ (HK) and the transcriptional regulator PhoP (RR) . PhoQ/PhoP is encoded by the phoP locus , which was first identified in. Salmonella enterica serovar Typhimurium as controlling the expression of a nonspecific acid phosphatase [Kier, L. D. , 1979]. Mg2+ is a membrane and ribosomal stabilizer, and is essential in reactions that require ATP. First, E.A.Groisman et aI. [Vescovi, E. G. et aI. , 1996] identified a signal transduction pathway that responds to extracellular Mg2+. They showed that. 3.
(9) in Salmonella typhimurium, extracellular Mg2+ is a stimulus that affects the PhoQ/PhoP system which responds to the levels of Mg2+ and Ca 2+, but not to phosphate. PhoQ/PhoP should not be confused with PhoR/PhoB and PhoR/PhoP, which are TCSs governing the adaptation to phosphate-limiting conditions in E coli [Wanner, B.L., 1995] and Bacillus subtilis [Hulett, F.M., 1996], respectively. Homologues of the 8.typhimurium PhoQ/PhoP TCS have been isolated from E coli [Groisman, E.A., et aI, 1992, Kasahara, M., et aI, 1992], and they are found in a number of other Gram-negative bacterial species, both pathogenic and non-pathogenic. To confirm that the primary function of PhoQ/PhoP is the adaptation to Mg2+-limited environments, the E coli PhoQ/PhoP system was investigated [Kato, A., et aI, 1999] Mg2+ -responsive genes (PhoPQ, mgrB, mgrC and mgtA) of E coli were identified using a AplacMu55 phage that was inserted into a bacterial chromosome to fuse a transposon -born lacZ reporter gene to the promoter of a target [Kato, A., et aI, 1999]. phoPQ, mgrB, mgrCand mgtA were localized at 26, 41, 72 and 96 min on the E coli chromosome, respectively. Their expressions were induced only when extracellular Mg2+ was limited and were abolished by disruption of phoQ and phoP. Asp51 of PhoP and His277 of PhoQ, phosphorylated amino acid residues, were found to be essential for the signaling system [Kato, A., et aI, 1999]. These results suggest that PhoP is phosphorylated by PhoQ under Mg2+ -limited conditions and then activates the expression of the Mg2+ responsive genes including the phoPQ themselves, meaning that the signal transfer through the PhoQ/PhoP system stimulates its own expression (Mg2+ regulon) (Fig.3).. 4.
(10) High Mg2+. Low Mg2+. >-<. PhoQ. ATP. PhoP. C® \. ... .. '.. ..::::::: . ... ,::::........ P. ~p). ATP. ~. P~. ~. ADP. ~:f.i.:!~. ~:: ......... .~. -----il. phoPQ. ~. mgrA. ~. mgrB. ~. ................ Fig. 3. Mg2+ regulon.. A direct repeat (T/G)GTTTA (PhoP box) was conserved at 35 bp upstream of the transcriptional start site of phoPQ, mgtA and m grB [Kato, A., et aI, 1999J. This direct repeat is also found in the phoPQ, mgtA, m gtBC and pagA promoters of S. typhimurium [Kato, A. , et aI, 1999J. In fact, a footprinting and gel shift assay showed that PhoP binds to this direct repeat (PhoP box) [Minagawa, S. , et alJ. This PhoP box was identified as the Mg2+ -responsive sequence for the first time. In addition, mgtA encoding the magnesium transporter [Smith, R.L. , et aI, 1998] was found to be specifically transcribed during the logarithmic growth phase, but repressed within 15 min after the addition of 30 mM MgCb [Kato, A. , et alL These results indicate that the Mg2+ regulon of E . coiiis controlled by PhoQ/PhoP, and that the PhoP-activated genes are required for growth in both solid and liquid Mg2+-limited environments (Fig3) . To search for the member genes of the Mg2+ stimulon. 5. In. E. coli,.
(11) wild-type strain W3110 was grown in Luria-Bertani (LB) medium in the presence or absence of 30 mM MgCb, and genomic-wide transcription profiles were analyzed using DNA micro array. Furthermore, 81 nuclease, DNaseI footprinting, and in vitro transcription assays were performed to clarify the molecular mechanism of Mg2+ stimulon in Escherichia coli K-12 (Chapter II). These results suggested a model in which Mg2+ binding to the periplasmic domain of PhoQ regulates autokinase, resulted in regulating phosphorylated-PhoP concentration and Mg2+ stimulon genes expression in. Escherichia coli. To prove such a model, many mutants of the periplasmic domain of PhoQ were isolated and characterized in Chapter III.. 6.
(12) CHAPTER II. Molecular mechanism of Mg2+ stimulon: PhoQ-PhoP two-component signal transduction system. Introduction The two-component system is the most prevalent signal transduction mechanism that mediates bacterial responses to environmental stimuli. The two-component system typically consists of a sensor protein and a regulatory protein. Each sensor monitors a particular environmental signal and responds by modifying the phosphorylated state of its response regulator. Mfinity. of the. response. regulator. to. promoters. is. controlled. by. phosphorylation, ultimately leading to transcription activation of a distinct set of the stress response genes. Eubacterial species, such as Escherichia coli and Bacillus subtilis, harbor over 30 two-component systems, each of which responds to a different signal in environment [Fabret, C., et aI., 1999, Mizuno, T., 1997]. At present, however, the specific ligand that is recognized by each sensor protein remains largely unidentified. The PhoQ/PhoP two-component system was first recognized in Salmonella typhimurium as a regulatory system that monitors the availability of extracellular Mg2+ [Vescovi, E. G., et aI., 1996, Groisman, E. A., 2001]. PhoQ protein functions as a Mg2+sensor [Vescovi, E. G., et aI., 1996]. and, in the presence of micromolar concentrations of Mg2+, phosphorylates the PhoP regulator. The phosphorylated PhoP activates transcription of some 30 different genes [Soncini, F. C., et aI., 1996]. The PhoQ/PhoP system is. 7.
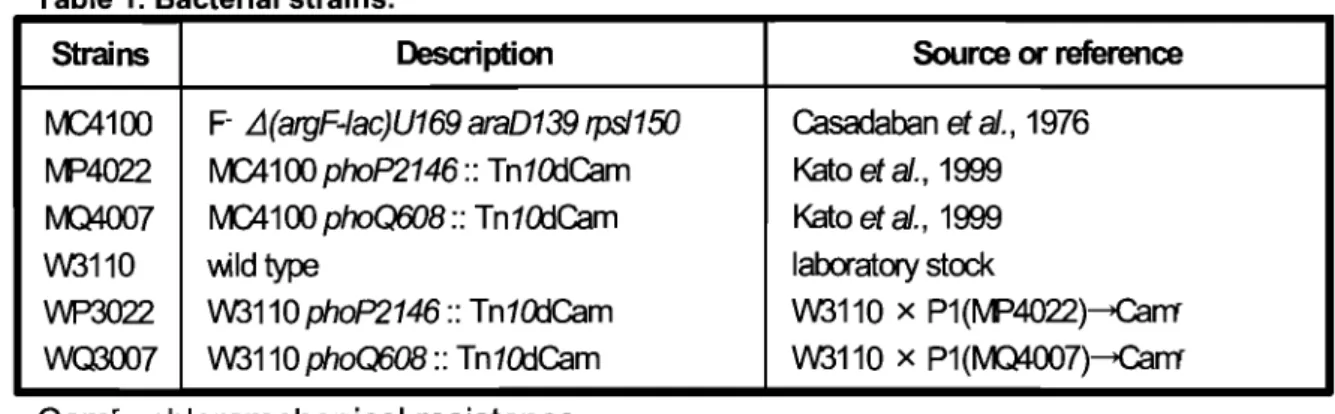
(13) present in many non-pathogenic, Gram-negative bacteria, suggesting that it plays a fundamental physiological role in response to Mg2+ starvation [Groisman,. E. A., 2001]. However, the mechanism how the PhoP. transcription factor regulates the Mg2+-response genes remains poorly understood. Previously, we identified the tandem direct repeats of the sequence (T/G)GTTTA, which we designated as PhoP box, in promoters of the Mg2+-responsive phoPQ, mgtA, and mgrB genes of E. coli K-12 [Kato, A., 1999].. A. search. of. the. entire. E.. coli. genome. sequence. for. (T/G)GTTTA-5bp-(T/G)GTTTA or TAGTTA- 5bp-(T/G) GTTTA motif detected. four additional genes, vboR, ydcD, fimDhomolog, and yrbL [Kato, A., 1999].. In order to identify the member genes of Mg2+ stimulon in E.coli, we carried out in this study a genome-wide transcription profile analysis in the presence or absence of MgCb using a DNA microarray. The dependency on the PhoQ/PhoP two-component system was also examined using E.coli mutants lacking phoP or phoQ. The sequence-activity relationship was analyzed for all the Mg2+-response promoters herein identified.. MATERIALS AND METHODS. Bacterial strains and growth conditions. The strains used in this work were E. coli K-12 derivatives (Tablel). WP3022. (W3110,. phoP214fj.: TnlalCam). and. WQ3007. (W3110,. phoQ608: TnlalCam) were constructed with PI transduction from the donors MP4022 and MQ4007 [Kato, A., 1999] to the recipient W3110, respectively. They were cultured at 37°C in Luria -Bertani (LB) medium in. 8.
(14) the presence or absence of 30 mM MgCb.. Table 1 Bacterial strains.. Strains rvG4100 rvP4022 rv04007 W3110 VVP3022 Wa3007. Source or reference. Description. Casadaban et aI., 1976 Kato et aI., 1999 Kato et aI., 1999 laboratory stock W3110 x P1(MP4022)~rrr W3110 x P1(rv04007)~rrr. F- L1(argF-lac)U169 ara0139 rpsI1txJ rv1CA100 phoP2146:: Tn1lklCam rv1CA 100 phoQ60B :: Tn 1lklCam wid type W3110 phoP2146:: Tn1lklCam W3110 phoCX508 :: Tn1lklCam. Cam r : chloramphenicol resistance.. RNA isolation, eDNA labeling, and hybridization to DNA mieroarrays. To prepare total RNA for DNA microarray analysis, overnight cultures were diluted 1/100 fold in 30 ml of LB medium in the presence or absence of 30 mM MgCb and were grown to an OD600 of 0.3 to 0.4 (approximately 8xl0 7 cells/mn at 37°C. Subsequent purification steps were carried out as described previously [Kato, A., 1999]. The resulting total RNA preparations were treated with RNase-free DNaseI (Takara Co., Japan) according to the manufacturer's protocol. The RNA preparations from each sample were used as the template for cDNA preparations were labeled with Cy3-dUTP or Cy5-dUTP (Amersham. Pharmachia). and. hybridized to. Reoli DNA. microarrays (IntelliGeneTM Reoli CHIP Version beta, Takara Shuzo Company, Ohtsu, Japan). The corrected intensities of duplicated spots were averaged as described previously [Oshima, T., et.al., 2002, (a, b)].. 9.
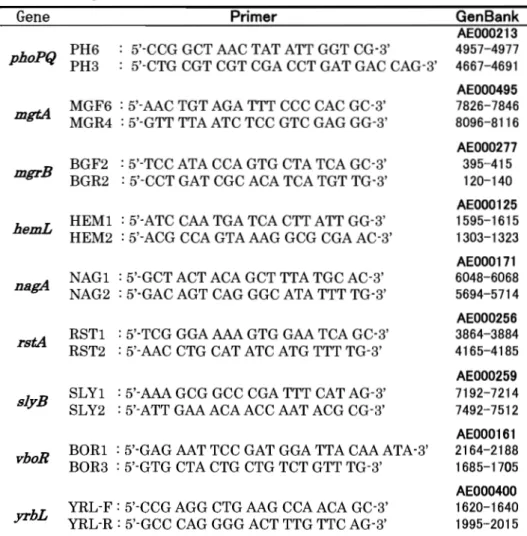
(15) Preparation of the labeled promoter fragments for 81 nuclease and gel shift assays. The [ 'Y -32P]-labeled probes were generated by PCR amplification using the primer pairs shown in TABLE 2. The primers PH3, MGR4, BGR2, HEM2, NAG2, R8T2, 8LY2, YRL-R, and BOR3 were labeled with 10 ~Ci [ 'Y -32p] ATP (5000 Ci/mmol) by T4 polynucleotide kinase (Toyobo, Japan). Reoli W3110 genome DNA (100 ng) was used as the template for Ex Taq DNA polymerase (Takara, Japan). The PCR product with 32p at its termini was recovered from a polyacrylamide gel and then used for 81 nuclease and gel shift assays.. Table 2 peR primers. Gene. Primer. phoPQ PH6 PH3. : 5'-CCG GCT AAC TAT ATT GGT CG-3' : 5'-CTG CGT CGT CGA CCT GAT GAC CAG-3'. GenBank AE000213 4957-4977 4667-4691. MGF6 : 5'-AAC TGT AGA TTT CCC CAC GC-3' MGR4: 5'-GTT TTA ATC TCC GTC GAG GG-3'. AE000495 7826-7846 8096-8116. mgrB. BGF2 : 5'-TCC ATA CCA GTG CTA TCA GC-3' BGR2 : 5'-CCT GAT CGC ACA TCA TGT TG-3'. AE000277 395-415 120-140. hemL. HEMl: 5'-ATC CAA TGA TCA CTT ATT GG-3' HEM2 : 5'-ACG CCA GTA AAG GCG CGA AC-3'. AE000125 1595-1615 1303-1323. nagA. NAG 1 : 5'-GCT ACT ACA GCT TTA TGC AC-3' NAG2 : 5'-GAC AGT CAG GGC ATA TTT TG-3'. AE000171 6048-6068 5694-5714. rstA. RSTl : 5'-TCG GGA AAA GTG GAA TCA GC-3' RST2 : 5'-AAC CTG CAT ATC ATG TTT TG-3'. AE000256 3864-3884 4165-4185. sJyB. SLYl : 5'-AAA GCG GCC CGA TTT CAT AG-3' SLY2 : 5'-ATT GAAACAACC AAT ACG CG-3'. AE000259 7192-7214 7492-7512. vboR. BORl : 5'-GAG AAT TCC GAT GGA TTA CAA ATA-3' BOR3 : 5'-GTG CTA CTG CTG TCT GTT TG-3'. AE000161 2164-2188 1685-1705. YRL-F : 5'-CCG AGG CTG AAG CCA ACA GC-3' YRL-R : 5'-GCC CAG GGG ACT TTG TTC AG-3'. AE000400 1620-1640 1995-2015. mgtA. yrbL. 10.
(16) 81 nuclease assay. RNA was prepared as described previously [Kato, A., 1999]. The labeled promoter fragment was incubated with 100 Ilg of total RNA in hybridization buffer (80% formamide, 0.4 M NaCl, 20 mM HEPE8 (pH 6.4» at 75°C for 10 min, followed by further incubation at 37°C overnight, and then digested with 81 nuclease. The undigested DNA was precipitated by ethanol and dissolved in formamide dye solution (95% formamide, 0.05% bromophenol blue and 0.05% xylene cyano!), and analyzed by electrophoresis on a 6% polyacrylamide gel containing 8 M urea.. Purification ofPhoP. His-tagged PhoP for Gel shift and DNA footprinting assays was purified as described previously [Yamamoto, K., 2002].. Gel shift assay. The 32P-labeled probes for the 81 nuclease assay were also used in the gel shift assay. The probe was incubated at 37°C for 10 min with the purified His-tagged PhoP (0 to 20 pmo!) and B8A (100 pmo!) in binding buffer (5 mM CaCh, 3 mM MgCh). Mter addition of the DNA dye solution (40% glycerol, 0.025% bromophenol blue and 0.025% xylene cyano!), the mixtures were directly subjected to 6% polyacrylamide gel electrophoresis (pH 6.0).. DNase! footprinting assay. 32P-Iabeled probe was incubated at 37°C for 10 min with the purified His-tagged PhoP in 25 III of 50 mM Tris-HCI (pH 7.8), 50mM NaCl, 3 mM. 11.
(17) magnecium acetate, 5 mM CaCb, 0.1 mM EDTA, 0.1 mM dithiothreitol and 25. ~g/ml. BSA. Mter incubation for 10 min, DNA digestion was initiated by. the addition of 5 ng DNaseI (Takara, Japan). Mter digestion for 30 sec at 25°C, the reaction was terminated by the addition of 45. ~l. of DNaseI stop. solution (20 mM EDTA, 200 mM NaCl, 1% SDS, and 250 ~g/ml yeast tRNA). Digested products were precipitated by ethanol, dissolved in formamide dye solution, and analyzed by electrophoresis on a 6% polyacrylamide gel containing 8 M urea.. In vitro transcription assay. mgtA, rstA, and lacUV5 promoter region were used as the template DNA. Single-round transcription by the reconstituted holoenzymes was carried out as described previously [Yamamoto, K., 2002]. In brief, 0.1 pmol of template was incubated with 0, 100, 200, 400 and 800 pmol of PhoP for 10 min at 37°C. Into this reaction mixture, 0.5 pmol of RNA polymerase was added and incubated for 20 min at 37°C to form an open complex. Then a substrate-heparin mixture containing [ex -32p]UTP was added and further incubated for 10 min at 37°C. The transcripts were subjected to a 6% polyacrylamide gel containing 8 M urea.. Computer search for PhoP box. The DNA sequences 500 bp upstream of the initiation codon of 232 genes, which were estimated with DNA microarray, were obtained from GenoBase. (http://ecoli.aist-nara.ac.jp).. PhoP. box. (TGTTTANNNNN. TGTTTA) within their sequences was searched using GENETYX-MAC. 12.
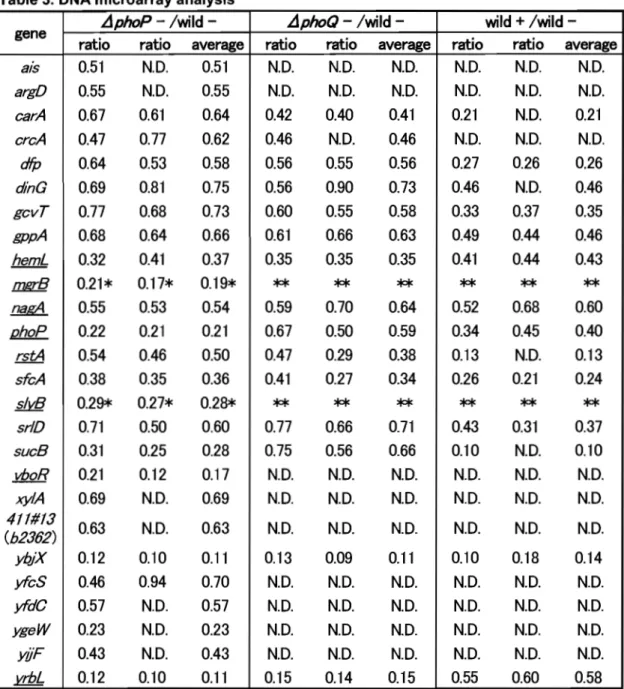
(18) (SOFTWARE DEVELOPMEMT CO., LTD. Japan) when set up with 2 bp mismatch. RESULTS AND DISCUSSION. DNA microarray-based identification of Mg2+-responsive genes controlled by the PhoP/PhoQ two-component system. To search for the member genes of Mg2+ stimulon in E.coli, wild-type strain W3110 was grown in Luria-Bertani (LB) medium in the presence or absence of 30 mM MgCb, and genome-wide transcription profiles were analyzed using DNA microarrays. By the addition of external Mg2+, mRNA level was markedly reduced for a number of genes. To identify whether these genes are under the control of PhoQ/PhoP two-component system, the micro array assay was also performed for both WP3022 (phoPdisruptant) and WQ3007 (phoQ-disruptant) in the absence of MgCb, and the transcription profiles were compared with that ofW3110. A total of 232 genes, whose expression ratios were under 0.75, were found to be repressed by the addition of external MgCb and in PhoQ/PhoP-dependent manner (for details see the supplemental data shown in http://www.nara.kindai.ac.jp/nogei Iseiken I array. html). Mter sequence analysis of 500 bp-Iong promoter regions upstream from the ATG initiation codon of all these genes, a total of 26 genes including the previously identified phoPQ, mgtA, and mgrB genes [Kato, A., 1999] were found to possess the PhoP box with the consensus sequence of (T/G)GTTTA-N5-(T/G)GTTTA (Table 3).. 13.
(19) Table 3. DNA microarray analysis gene. ais argD earA ereA dfp. dinG gevT gppA hemL mgrB. &KA phoP rstA sfeA slvB srlD sueB vboR. xy£4 411#13 (b2362) ybjX yfeS yfdC ygeW yiJF vrbL. .i1phoP - lwild -. wild + lwild -. .i1phoQ - lwild -. ratio. ratio. average. ratio. ratio. average. ratio. ratio. average. 0.51 0.55 0.67 0.47 0.64 0.69 0.77 0.68 0.32 0.21* 0.55 0.22 0.54 0.38 0.29* 0.71 0.31 0.21 0.69. N.D.. N.D. N.D.. N.D.. N.D.. N.D.. N.D.. N.D.. N.D.. 0.42 0.46 0.56 0.56 0.60 0.61 0.35. 0.40 N.D. 0.55 0.90 0.55 0.66 0.35. N.D. 0.41. N.D. N.D.. 0.61 0.77 0.53 0.81 0.68 0.64 0.41 0.17* 0.53 0.21 0.46 0.35 0.27* 0.50 0.25 0.12 N.D.. 0.51 0.55 0.64 0.62 0.58 0.75 0.73 0.66 0.37 0.19* 0.54 0.21 0.50 0.36 0.28* 0.60 0.28 0.17 0.69. N.D.. N.D. 0.21. N.D.. N.D.. 0.26 N.D. 0.37 0.44 0.44. 0.26 0.46 0.35 0.46 0.43. 0.63. N.D.. 0.12 0.46 0.57 0.23 0.43 0.12. 0.10 0.94 N.D. N.D. N.D. 0.10. N.D.. **. **. 0.59 0.67 0.47 0.41. 0.70 0.50 0.29 0.27. **. **. 0.46 0.56 0.73 0.58 0.63 0.35. **. 0.64 0.59 0.38 0.34. **. 0.21 N.D. 0.27 0.46 0.33 0.49 0.41. **. 0.52 0.34 0.13 0.26. **. **. 0.68 0.45 N.D. 0.21. **. **. 0.60 0.40 0.13 0.24. **. 0.77 0.75 N.D. N.D.. 0.66 0.56 N.D. N.D.. 0.71 0.66 N.D. N.D.. 0.43 0.10 N.D. N.D.. 0.31 N.D. N.D. N.D.. 0.37 0.10 N.D. N.D.. 0.63. N.D.. N.D.. N.D.. N.D.. N.D.. N.D.. 0.11 0.70 0.57 0.23 0.43 0.11. 0.13 N.D. N.D. N.D. N.D. 0.15. 0.09 N.D. N.D. N.D. N.D. 0.14. 0.11 N.D. N.D. N.D. N.D. 0.15. 0.10 N.D. N.D. N.D. N.D. 0.55. 0.18 N.D. N.D. N.D. N.D. 0.60. 0.14 N.D. N.D. N.D. N.D. 0.58. mgtA was not spotted on DNA microarray used in this experiment. + and - mean presence and absence of MgCI 2, respectably . .fjphoP, WP3022 ; .fjphoQ, WQ300? ; wild, W311 O. The underlined genes were identified as Mg2+ stimulon. * The data were obtained using E. coli DNA microarray fabricated by Mori et al., in which Nminimal medium(3) was used. ** No experiments were done. N. D. : Fluorescent signal too weak for detection.. To validate these putative Mg2+-responsive genes regulated by PhoQ/PhoP, 81 nuclease assay was performed for all 26 genes. In addition to the previously identified phoPQ, mgtA, and mgrB genes [Kato, A., 1999], six. 14.
(20) G T A. T T. ,." .... PIPhoP. A. G C G C. *A A T. GJ. ( c)mgrB. (b )mgtA. (a )phoPQ. = "'" .... II. ~l**fG G. ....PmgtA. ... C T. -. iii. A. •. A. --. T C. -_. TI-=. .... PmgrB. C. A. (f) rstA. (e) nagA. (d) hemL. ..... *T. ,. .,. G l ~'.-~. t;. T A. ~l:. A. !'!. T. -. *~. •. C. A T C G --". *~. G. ~. ~G. ::. ~. I_. -. ... ~ l:I. A. G. A f ~ ~. *T. .... (i )yrhL. (h) vhoR. (g)slyB. A. .... PnagA. C. r-=. ~l. m.. TflSI T. .... P~lyB. G A. _. C. :. G C. •. .... PvboR. *~J~ • A. :. A. -. G. ~l". C *T C. .. ~. •. .... PyrbL. T. gf= A. •. G. •. I. Fig. 1. 51 nuclease assays. E.col; W311 0 (wild type), WP3022 (phoP-defective) , and WQ3007 (phoQ-defective) were grown in LB medium to early-exponential phase (OD600 0.3 to 0.4) in the presence (+) or absence (-) of 30 mM MgCI2. S1 nuclease mapping was carried out to determine the transcription start sites of phoPQ (a), mgtA (b), mgrB (c). hemL (d). nagA (e) , rstAB (f) , slyB (g), yrbL (h), and vboR(i) . Electrophoresis was performed with a 6% acrylamide sequencing gel. Lanes A+G represent Maxam-Gilbert sequence reactions. The arrows show the transcripts protected from nuclease digestion. Transcription start sites are marked with asterisks.. 15.
(21) genes, hemL, nagA, rstAB, slyB, vboR, and yrbL, were found to be repressed in the. presence of high concentrations of extracellular Mg2+ (Fig. 1).. mRNAs for these genes were detected in W3110, but not in WP3022, and WQ3007. In each case, Mg2+-dependent repression required the presence of both PhoP and PhoQ (Fig. 1). In the promoter regions of all these Mg2+-responsive genes, the consensus PhoP box was identified (Fig. 2). The corresponding genes, phoPQ, mgtA, STM1839, hemL, nagA, rstAB, slyB and. STM3504, of Salmonella typhimurium also carry the PhoP box sequence in the respective promoter regions (Fig. 2). r+ P2. -35. r. -10. p. 1. EcoJi. phoP(J. tcccctccccg-ctGGTTTAtttaa TGTTTAcccccataaccaCATAA Tc-gcgttAcactat~ ATG. Salmonella. phoP(J. gtgactatttgtctGGTTTAttaacTGTTT Atccccaaagcac~ caacgctAgactgt------w;-- ATG. ---+. ---+. 4P1. EcoJi. mgtA. r p atgggtaaagtctGGTTT AtcgttGGTTTAgttgtcagcagg TATTAT atcgcca Tagatgc. Salmonella. mgtA. atgggcaaagtctGGTTT AtcgttGGTTTAattacgtaacggtatgataccgccataattgc. EcoJi. Salmonella. -35. mgrB. ---+. ---+. -35. P. mgtA 255b -_P-. -10. ~. ATG ATG. rPmgrB 19b. -10. P - ATG acgaatatcgaca TAGTT Aggcgc TGTTTAactaacgcatgc TAGTTT aatgacAtaaggt--. ---+. ---+. STM1839 tataatgccgctaCAGTT ActcctGGTTTAagtaactcatgataatttagcgacataagat ~ ATG -35. r. -10. P1. 32b. EcoJi. henl. acaagcagcctga TGTTTGacgag TATTTAacttgttatgAATAACatagaa Tagcagc - _ P- ATG. Salmonella. henl. a--ttgtttcaaa TGCGT Aaaact TTCA TAaccttctctgaataacttagaatagcggg ~ ATG. EcoJi. nagA. ggaaaaattcatc TGTTT AtgggcGGTGTAggtaacgacggtCATA TT gcat Ttaacga ~ ATG. Salmonella. nagA. ggtaaaatccatc TGTTT AtgggcGGCGTCggcaacgacggtcacatcgcctttaacga ~ ATG. ---+. ---+. -35. r. -10. ---+. p nagA. ---+. ~. ~P rstA 9b P. P. ~o. Reoli. rstA. Salmonella. rstA. ccgctctCGTTTAgaaaaGATTTAt-ggaagggaaaacagaggcggtgtatgttggcg-tttt--,--:c-- ATG. styB. rratcatgaatgttt TGTTTAtaattGGTTGAtcctactttcat TATGAT ttgctcA-tattt-g. styB. ttgcttccgacttCGTTTAagattGGTTAAttaacttctgattatgattttcacattctttcg. Rcoli Salmonella Reoli Salmonella. yrbL. gaaaactTGTTTAgaaacGATTGAtagtaagtaaaaacag-cgcggtgTATTGTgacgtt tt. ---+. P2. -35. ---+. P1. -10. ---+. -. rccttaagaggcatTGTTTAggtttTGTTTAagttaatcGAGCATactggAgat-cg -35. P yrbL. -1Q. ---+. 25b. ---+. 18bp. 92bp --'=.!:..-. 91bp. ATG ATG. p ATG. STY3504 ccttaaaaaatttCGTTTAggtttTATTTAagttctttgtccatactaaatttatg --25-b-p- ATG -35. Reoli. ATG. ---+. vboR. consensus sequence. -10. r-. P vboR 21bp. aatttcaactcatTGTTTAgggttTGTTTAattttctacacaTACGATtctgcgAacttca. ---+. ---+. .. ATG. (T/G)GTTTAnnnnn(T/G)GTTTA. ------~.~. Fig. 2. Mg2+-responsive promoters. The E.coli Mg2+-responsive promoters, identified in FIG. 1, are aligned in parallel with the corresponding promoters from Salmonella typhimurium. DNA sequences of E.coli and S.typhimurium are from GenBank: phoPQ, AE000213 and AE008753 (PhoP, 89% and PhoQ, 79%); mgtA, AE000495 and AE008909 (MgtA, 87%); mgrB, AE000277 and AE008782 (MgrB, 63%); hemL, AE000125 and AE008704 (HemL, 93%); nagA, AE000171 and AE008727 (NagA, 92%); rstAB, AE000256 and AE008764 (RstA, 80% and RstB, 78%); slyB, AE000259 and AE008762 (SlyB, 63%); yrbL, AE000400, STY3504, and AE008853 (YrbL, 72%); vboR, AE000161. The numbers (%) in parentheses indicate the homology of each protein. Thin and bold arrows indicate starts and directions of transcription and direct repeats (PhoP box), respectively. The -10 region of each promoter is underlined. In S.typhimurium, no promoters except phoPQ have been clarified. -10 hexamer, start site, and the direct repeats are all capitalized.. 16.
(22) Recently, T. Oshima et al. [Oshima, T., 2002 (a)] published the transcription profile for an E. coli mutant defective in the PhoQ/PhoP two-component system as analyzed by the DNA microarray. The expression of at least 28 genes including rstAB, slyB, vboR, and yrbL was decreased in the phoQlphoP mutant, but it remained to be determined whether these genes respond to the availability of Mg2+ in external environments. In S 1 nuclease assay, mRNA levels of three genes, sfcA, gppA, and srlD decreased in the presence of Mg2+, but this reduction was not observed even with phoP and phoQ-defective mutants (data not shown). These genes are not under the direct control of PhoQ/PhoP system. In fact, the PhoP-box sequence is not present in these promoters. These results altogether indicate that the existence of PhoP-box is important for PhoQ/PhoP-dependent transcription of the Mg2+ stimulon genes.. Gel shift assay of PhoP binding activity for the Mg2+-responsive gene promoters. Recently, we found that the purified PhoP protein specifically binds in vitro to the PhoP box located within the mgtA promoter region [Yamamoto, K., 2002]. To check whether the PhoP protein can also bind to the PhoP box associated with the newly identified Mg2+-responsive genes, we carried out gel shift assays using DNA fragments from the promoters from these nine genes, phoPQ, mgtA, mgrB, hemL, nagA, rstA, slyB, vboR, and yrbL. All the nine DNA probes used were retarded to form a single band of the probe DNA-PhoP protein complex (Fig. 3). The minimum concentration of PhoP protein required to convert all input probes to PhoP complexes was, however,. 17.
(23) different between the nine promoters, suggesting difference in their affinity to PhoP. We quantified PhoP needed to bind half of the probe amount used in gel shift assay (Table 4). PhoP binds the promoters of two genes mgtA and. vboR with the highest affinity. Among the remaining six promoters, probes of hemL and nagA showed the lowest affinity.. (e) mgrB. (b) mgtA. (a) phoPQ. ... ... --------::-:J. ilSA. (d) hemL. 1234567. 1234567. 1234567. V. ... .._... 1 2 3 4 5 6 7. -. ~ IlSA PhoP. Phol'. (f) rstAB. (g) s/yB. (h) vboR. 1 2 3 4 567. 1234567. 1234567. ... (e) nagA. 1234567. (i) yrbL 1234567. ... ~ 8SA Pho!>. ... Fig. 3. Gel shift assays. The probes used in FIG. 1 were incubated at 3r C for 10 min with the purified PhoP (lane 1, 0 pmol ; lane 2, 1.25 pmol ; lane 3, 2.5 pmol ; lane 4, 5 pmol ; lane 5, 10 pmol ; lane 6, 20 pmol; and lane 7, BSA 100 pmol). The mixtures were directly subjected to PAGE. The sequences of DNA probes are as described in FIG . 1. BSA: bovine serum albumine. Table 4. Differential affinity of PhoP to bind Mg2+ stimulon genes. PhoP (pmol). phoPQ. mgtA. mgrB. hemL. nagA. rstAB. s/yB. vboR. yrbL. 1.54. 0.88. 2.25. 9.66. 4.32. 2.37. 2.30. 0.94. 1.0. The data were estimated by measuring density of the probe band ( lanes 1 to 6 ) in Fig.3. The arrow indicates the probe band .. DNase! footprinting of Ph oP-bin ding site within the Mg2+ -responsive gene promoters. Next, we tried to identify the preCIse site of PhoP binding by usmg DNaseI footprinting assay. As expected, the purified PhoP protein was found. 18.
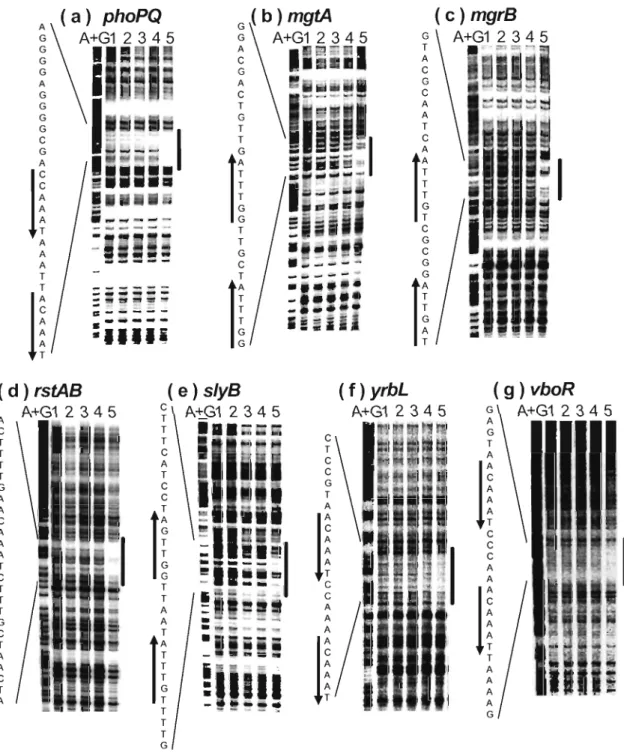
(24) A. G G G G. (a) phoPQ A+G1 23 4 5. G A. (b) mgtA A+G1 2 34 5. c. G A C T G T T. A G G G G C G A. l~. T T. A A A. G C. T. -_. ::---.... --. ••. l~. -- --- -. •. -. Ii. ~I. C G C G. l~ (g) vboR. (f) yrbL. (d) rstAB A. G T A C. G C A A T C. l~. I!. Ij. G. A+G1 2 3 4 5. A+G1 2 34 5. C T T T T G. A. A+G1 23 4 5. T A. I!c c c. I!. 11. A. G. A. C T T T G. G. T A A A. A A. l~. ·'1. A A. I!. .... T. I! j. T T T. A A A A. G. G. Fig . 4. DNasel f oot printing assa ys. The coding (b , mgtA; c, mgrB; e, slyB) or non-coding (a , phoPQ; d, rstAB ; f, yrbL ; g, vboR) strands contain ing the PhoP box region were labeled with 32P at 5' ends, incubated with various amounts (lanes 1, 2, 3, 4, and 5 co ntai n 0, 10, 20 , 40 , and 80 pmol , respectively) of the purified PhoP , and subjected to DNasel footprinting assays. The same DNA probes were used as those in FI G. 1 except that MGF6 , BG F2, and SLY1 were labeled with [r -32P]ATP. La nes A+G represents the Maxam-Gilbert seq uence reaction. DNA sequences from bottom (5') to top(3') are shown . Black box and bold arrows indicate PhoP bind ing reg ion and PhoP box, respectively.. 19.
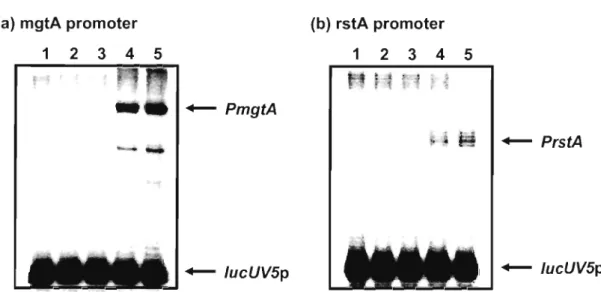
(25) to bind the PhoP-box region of phoPQ, mgtA, mgrB, rstAB, slyB, vboR, and. yrbL (Fig. 4). In the case of the nagA, phoPQ, mgtA, mgrB, rstAB, slyB, and vboR promoters, PhoP also bound to the PhoP box in the simultaneous presence of RNA polymerase (data not shown). However, we failed to detect PhoP binding to the PhoP box of the hemL promoter. The lack of stable binding of PhoP alone to the PhoP box of hemL and nagA promoters coincides with the results of the gel shift assays, and supports the assumption that the affinity of PhoP differs between the nine promoters tested. Furthermore, we carried out in vitro transcription assay to confirm the role of PhoP in the transcription of Mg2+ responsive gene. We performed in vitro transcription assay using reconstituted RNA polymerase holoenzyme E. (J. 70 and truncated DNA fragments containing the promoter region of. mgtA and rstA. Addition of PhoP caused activation of mgtA and rstA transcription, while it did not affect the expression from the lacUV5 promoter (Fig.5). Taking all these observations together we concluded that PhoP is a global transcriptional activator that directly binds to the PhoP box in the promoters of the Mg2+-stimulon of E. coli (Fig. 6). (a) mgtA promoter. 1. 234. (b) rstA promoter. 5. 1. -. 234. 5. + - PrstA. + - lucUV5p. + - lucUV5p. Fig. 5. In vitro transcription assay. Single-round transcription in vitro of 0.1 pmol mgtA (a) or rstA (b) template or lacUV5 template was performed with several concentration of PhoP (lane1 , 2, 3, 4 and 5 contain 0, 100, 200, 400 and 800 pmol). Electrophoresis was performed with 6% polyacrylamide sequencing gel.. 20.
(26) The PhoP- PhoQ system responds to the change in external Ca 2+ level as well as Mg2+ [Vescovi, E. G., et.al. 1996]. In fact, we found that the phoPQP1 promoter. responds. to. ch anges. m. extracellular. Ca 2+ level. m. a. PhoQ/PhoP-dependent manner (data not shown) . The response of E. coli to changes in extracellular Fe 3+, Cu 2+, Ag+, and Ni 2+ was found to be under the control of two-component system, PmrB/PmrA [Aguirre, A., et.al., 2000, Wosten, M. M., et.al., 2000], CusS/CusR [Munson, G. P. , et.al., 2000], SilS/SilR [Gupta, A., et.al. , 1999], and NrsS/NrsR [Lopez-Maury, L., et.al., 2002], respectively. These metal-responsive promoters also contain inverted or direct repeat sequences encompassing 5 bp. The binding of the respective regulatory proteins to these sequences is currently being examined. The signal transduction systems triggered by extracellular metal ions should be good models for obtaining insights into the global network of bacterial gene expressIOn.. Mg2+ Low concentration. ~ ~~ ~ yrbL. ~ ~. /TFB ~. ) ----. ~I. PhoP. ..---. /. ~. ~I. ~ s/yB fFIG. 6. Proposed Mg2+- stimulon of E.coli.. 21. heni. vbof~. f-.
(27) CHAPTER III. Molecular characterization of Mg2+ sensor PhoQ. Introduction The PhoQ/PhoP two-component system (TCS) governs the adaptation to low-Mg2+ environments and virulence in several Gram-negative species [Groisman, E.A., 2001]. PhoQ is a transmembrane histidine kinase that responds. to. low. extracellular concentration. of Mg2+ by. activating. PhoP-mediated transcriptional regulation of a set of genes. Growth. III. millimolar. of. concentrations. of. Mg2+. represses. the. transcription. PhoP-activated genes containing mgrB and mgtA genes, while the growth in micromolar concentrations of this divalent cation results in the transcription of PhoP-activated genes. This system has been studied extensively in. Salmonella enterica serovar Typhimurium (S.enterica), in which more than 40 different genes are directly or indirectly regulated [Miller, S. 1., and Mekalanos, J.J., 1990]. In Escherichia coli, PhoQ/PhoP TCS also regulates many genes to respond to extracellular Mg2+ concentration. Among them, nine genes (Mg2+ stimulon: phop, mgtA, mgrB, hemL, nagA, rstA, slyB, vhoR and yrhL) regulated directly by PhoQ/PhoP TCS were identified in chapter IT [Minagawa, S., et al., 2003, Kato, A., et al., 1999]. Such a regulatory effect of Mg2+ resulted from conformation changes in the periplasmic domain of the PhoQ protein, which features two transmembrane regions, a cytoplasmic tail and a periplasmic domain [Vescovi, E. G., et al., 1996]. In fact, the purified periplasmic domains (amino acid residue 45-190) of the PhoQ proteins from. 22.
(28) S. enterica and E. coli specifically bind Mg2+ in vitro [Vescovi, E.G., et aI. 1997, Waldburger, C.D., and Sauer, R.T., 1996]. For functional analysis of PhoQ, many mutants of the periplasmic domain of PhoQ have previously been isolated and characterized. The S.. enterica strain expressing a PhoQ mutant harboring the T481 substitution in the periplasmic domain is less sensitive to repression by Ca2+ but responds to Mg2+ in the same way as wild-type S. enterica, consistent with the assumption that the PhoQ protein has distinct binding sites for Mg2+ and Ca 2+ [Vescovi, E.G., et aI. 1997, Vescovi, E.G., et aI.1996]. S. enterica membranes containing the T481 PhoQ mutant protein promoted more PhoP phosphorylation than those harboring wild-type PhoQ [Gunn, J.S., et. aI., 1996]. On the other hand, the equivalent mutation in the E. coli PhoQ protein resulted in a strain that responded to both Ca 2+ and Mg2+ [Regelmann, A.G., et aI., 2002]. The PhoQ protein harbors an acidic amino acid cluster in its periplasmic region (residue 148-154), which includes a stretch of five consecutive negatively charged residues (E. coiJ~ EDDDDAE; S.. enterica: EDDDDAE). An E. coli strain harboring a mutant PhoQ protein with isosteric substitutions in the acidic cluster exhibited limited repression by Mg2+ [Waldburger, C.D., and Sauer, R.T., 1996]. However, in S. enterica, the residues within the acidic cluster contribute to a normal response to Mg2+, but they do not appear to be as critical as conserved residues G93, W97, H120 and T156, which are required for a wild-type response to Mg2+ [Chamnongpol, S., et. aI., 2003]. The known periplasmic mutants of PhoQ still responded to Mg2+ to some extent, and no mutation was found to become fully constitutive [Vescovi,. 23.
(29) E.G., et aI. 1997, Vescovi, E.G., et aI.1996, Gunn, J.S., et. aI., 1996 Chamnongpol, S., et. aI., 2003]. In this study, we describe isolation and phenotypic. characterization. of. 9. mutants. with. single-amino-acid. substitutions in the periplasmic region (PhoQT47, T48, N68, D90, D149, D150, D151, D152, D179) in Escherichia coli, finding that PhoQD179L(A) does not respond at all to either Mg2+ or Ca 2+.. Materials and Methods. Strains and Growth condition.. E. coli MG1307 (MC4100 phoQ608:TnlOdCam, mgrB:"AplacMu55 [mgrB:lacZI) [Kato, A., et. aI. 1999] was used for assaying mgrB-lacZ expression. An Sl nuclease assay was performed with E. coli W3110 (wild type) and WQ3007 (W3110, phoQ608: Tn10dCam) [Minagawa, S., et aI., 2003]. Cells were cultured at 37°C in a Luria-Bertani (LB) medium.. Plasmids. Plasmid pR0119 {pMW119 (replication origin derived from pSC101), 3.6-kb SalI- EcoRI fragment containing pho?- phoQ+ from A phage clone}, containing the E. coli phoPQ operon gene with a native phoPQ promoter [Kato, A., et. aI., 1999], was used to generate the series of PhoQ mutants. After the phoQ gene was amplified with pR0119 and the primers KM028T (5'- CCG GGA TCC CGG ATG AAA AAA TTA CTG CGT-3') and KM028S (5'-TAT GGG GCG GCC GCT TCA TCT TTC GGC GC-3') by PCR and digested with BamRI and NotI, it was ligated at the corresponding sites of. 24.
(30) pET-21(a) (Novagen) to generate plasmid pMHK028. After the fragment encoding the full-length of CusS was amplified by PCR using W3110 genomic DNA and primers KM026S (5'- TCG GGA TCC CGG ATG GTC AGT AAG CCA TTT-3') and KM026T (5'- CGT TTG CTG GCG GCC GCA GCG GGT AAT GTG-3'), it was digested with BamHI and NotI and ligated at the corresponding sites of pET-21(a) to obtain pMHK026. Then, pMPhoQD179L and pMPhoQD179A (Tablel) were constructed with D179L-F, R or D179A-F, R primers (Table2) and pMHK028 by the QuickChange™ Site-directed Mutagenesis Kit (STRATAGENE). Furthermore, the periplasmic region (T47L, T48A, N68L, D90A, D149A, D150I, D151I, D152F, D179L or D179A) of PhoQ was also mutagenized with the primers in Table 1 and pH0119 to construct pH047L, pH048A, pH068L, pH090A, pHOQ149A, pHOQ150I, pH0151I, pH0152F, pH0179L and pH0179A, respectively.. Table 1. Plasm ids Plasmids. Description. pMW119, 3.6-kbp Sall-EcoRI fragment containing phoP+Q+ from Aphage clone (Kohara clone 239) pHOT47L pH0119, PhoQ T47L pH0119, PhoQ T48A pHOT48A pHON68L pH0119, PhoQ N68L pH0119, PhoQ D90A pHOD90A pHOD149A pH0119, PhoQ D149A pHOD1501 pH0119, PhoQ 01501 pHOD1511 pH0119, PhoQ 01511 pHOD152F pH0119, PhoQ D152F pHOD179L pH0119, PhoQ D179L pHOD179A pH0119, PhoQ D179A pET21 (a) protein overexpression vector pMHK028 pET21(a), BamHI-Notl fragment containing PhoQ (full length) pMPhoQD179L pMHK028, PhoQD179L pMPhoQD179A pMHK028, PhoQD179A pET21 (a), BamHI-Notl fragment containing cytoplasmic pPhoQ domain of PhoQ pPhoP pET21 (a), BamHI-Notl fragment containing PhoP (full length) pMHK026 pET21 (a), BamHI-Notl fragment containing CusS (full length) pH0119. 25. Reference Kato, A. et al. (1999). This work This work This work This work This work This work This work This work This work This work Novagen This work This work This work Yamamoto, K. et al. (2002). This work.
(31) Table 2. Primers used for Site Direct Mutagenesis Primer T47L-F T47L-R T48A-F T48A-R N68L-F N68L-R D90A-F D90A-R D149A-F D149A-R : D1501-F D1501-R D1511-F D1511-R D152F-F D152F-R D179L-F D179L-R D179A-F D179A-R :. Sequence 5'-GCG TCA GTT TCG ATA AGC TTA CGT TTC GGC-3' 5'-GCC GM ACG TM GCT TAT CGA MC TGA CGC-3' 5'-GCG TCA GTT TCG ATC GM CTG CGT TTC GGC-3' 5'-GCC GM ACG CAG TTC GAT CGA MC TGA CGC-3' 5'-CCC TTG CGA AGT GGG M T TCA ATA AGT TGC-3' 5'-GCA ACT TAT TGA ATT CCC ACT TCG CM GGG-3' 5'-GAC GCT MT TTA TGC TGA GM CGG GCA GC-3' 5'-GCT GCC CGT TCT CAG CAT AM TTA GCG TC-3' 5'-GGA AGA TGA TGA CGC TGC AGA GAT GAC CCA-3' 5'-TGG GTC ATC TCT GCA GCG TCA TCA TCT TCC-3' 5'-TGC GGG MG ATG ATA TCG ACG CGG AGA TGA-3' 5'-TCA TCT CCG CGT CGA TAT CAT CTT CCC GCA-3' 5'-AGT GCG GGA AGA TAT CGA CGA CGC GGA GA-3' 5'-TCT CCG CGT CGT CGA TAT CTT CCC GCA CT-3' 5'-GGA AGT GCG GGA ATT CGA TGA CGA CGC GGA-3' 5'-TCC GCG TCG TCA TCG M T TCC CGC ACT TCC-3' 5'-CCA TTG TGG TGG TGT TM CCA TTC CGG TGG-3' 5'-CCA CCG GM TGG TTA ACA CCA CCA CM TGG-3' 5'-CAT TGT GGT GGT GGA GAC CAT TCC GGT GGA-3' 5'-TCC ACC GGA ATG GTC TCC ACC ACC ACA ATG-3'. Preparation ofmembranes. When E. coli BL21 (DE3), containing pMHK028, pMPhoQD179L,. pMPhoQD179Aor pMHK026 were grown at 30°C in 200 ml ofLB (ampicilin, 100 Jlg/ml) to OD600 of 0.5, isopropyl- {3 -D- thiogalactopyranoside (IPTG) was added at a final concentration of 0.5 mM, further incubated at 30°C for 3h, and harvested for membrane preparations by centrifugation [Moual, H.L., et aI., 1998]. The cell pellets were resuspended in 5 ml oflow-salt buffer (100 mM sodium phosphate, pH 7.0, 10% glycerol, 5 mM EDTA, 10 mM DTT, 1 mM PMSF and 5 mM 1,10-phenanthroline) and lysed by sonication. Mter unbroken cells and debris were removed by centrifugation (6,000 g, 10 min., 4°C, Hitachi himac CS120), the supernatant was ultracentrifuged (142,000 g, 60 min., 4°C, Hitachi himac CS120) and the membrane pellets were resuspended in 4 ml of high-salt buffer (20 mM sodium phosphate, pH7.0, 2. 26.
(32) M. KCl,. 10%. glycerol,. 1. mM. DTT,. 1. mM. PMSF. and. 5. mM. 1,10-phenanthroline) and ultracentrifuged (488,000 g, 10 min., 4°C, Hitachi himac CS120). Then, the membrane pellets were resuspended in 2 ml of final buffer (20 mM Tris-HCl, pH 7.5,10% glycerol, 1 mM DTT, 1 mM PMSF and 1 mM 1,10-phenanthroline) and ultracentrifuged (488,000 g, 10 min., 4°C, Hitachi himac CS120). The membrane pellet was resuspended in 1 ml of final buffer without DTT, PMSF or 1,10-phenanthroline and stored at -80°C. Membrane protein was quantified by a Protein Assay kit (Bio-Rad) and analyzed by sodium dodecyl sulfate-polyacrylamide gel electrophoresis (SDS-PAGE).. In vitro autophosphorylation activity. Membrane-bound PhoQ, PhoQD179L, PhoQD179A and CusS (1.6 Ilg of total membrane protein) or PhoQ-C containing only the cytoplasmic region (217 aa to 486 aa) [Yamamoto, K., 2002] was incubated for 5 min at 37°C in 10 III of kinase buffer (50 mM Tris-HCl [pH 7.5], 50 mM KCl and 0.01 mM MgCh) with [y -32P]ATP (37 kBq) and 2.5 11M of cold ATP. The reaction was stopped by the addition of 5xSDS sample buffer (0.3 M Tris-HCl (pH 6.8), 50% glycerol, 5% SDS, 25%. /3 -mercaptoethanol, 0.01% BPB). Mter. SDS-PAGE was performed, autophosphorylation activity was quantified with BAS1000 (Fuji Film Co. Japan).. In vitro phosphotransfer from PhoQ to PhoP. Membrane-bound. PhoQ,. PhoQD179L or. PhoQD179A was. first. autophosphorylated for 30 min. at 37°C in the kinase buffer as mentioned. 27.
(33) above, followed by addition of PhoP mixture (10 /ll of kinase buffer containing 1 pM of purified PhoP, 0.05 to 10 mM of MgCb and 4.5 mM of cold ATP) and incubated for 1 min at 37°C for phosphotransfer. The reaction was terminated by the addition of 5 X SDS sample buffer, and the proteins were separated by SDS-PAGE.. 81 nuclease assay.. RNA was prepared as described previously [Minagawa, S., et. aI., 2003]. The 32P-labeled promoter fragment was incubated with 100 /lg of total RNA in hybridization buffer (80% formamide, 0.4 M NaCl, 20 mM HEPES [pH 6.4]) at 75°C for 10 min, followed by further incubation at 37°C, and then digested with Sl nuclease. The undigested DNA was precipitated with ethanol, dissolved in formamide dye solution (95% formamide, 0.05% bromophenol blue, 0.05% xylene cyanol), and analyzed by electrophoresis in a 6% polyacrylamide gel containing 8 M urea. The 32P-labeled probes were generated by PCR amplification with the primer pairs PH6-PH3 (for phoPQ promoter), MGF6-MGR4 (for mgtA promoter), and BGF2-BGR2 (for mgrB promoter) [Minagawa, S., et. aI., 2003]. The primers PH3, MGR4 and BGR2 were labeled with 10 /lCi of ['Y -32P]ATP (5,000 Ci/mmol) and T4 polynucleotide kinase (ToYoBo). E. coli W3110 genome DNA (100 n g) was used as the template for ExTaq DNA polymerase (TaKaRa). The PCR product with 32p labeled at the 5' terminus was recovered from a polyacrylamide gel and then used for the Sl nuclease assay [Minagawa, S., et aI., 2003].. 28.
(34) Results and Discussion. Isolation and characterization ofPhoQD179 mutant We aligned the amino acid sequences of the PhoQ periplasmic domain from E. coli, S. enterica, Erwinia cartovora, and Yersinia pestis and then found TIVVVD174-179 of E. coliPhoQ, which is also conserved in three other species (Fig. 1). Expression of mgrB-lacZwas repressed by Mg2+ (30 mM) in. E. coliMG1307/pH0119, pH047L, pH048A, pH068L, pH090A, pH0149A, pH0150I, pH0151I or pH0152F but not in E. coli MG 1307 I pH0179L or pH0179A (Fig. 1). In MG1307/pH0179L (A), mgrB expression was not repressed by Ca 2+ as well as Mg2+ (Fig. 2). Furthermore, 81 nuclease assay was performed to investigate the effects of PhoQD179L on phoPQ, mgtA an d. mgrB transcription. In the wild-type W3110, each phoPQ, mgtA and mgrB transcription was repressed by Mg2+ (30 mM) (Fig. 3, lanes 1 and 2) and was dependent on PhoPQ (Fig. 3, lanes 3 and 4). pH0119 containing PhoP and PhoQ complemented the phoQ deletion and phoPQ, mgtA and mgrB transcription became dependent on Mg2+ concentration (Fig. 3, lanes 7 and 8); however, their transcription was not repressed by Mg2+ (30 mM) in WQ3007 IpH0179L or pH0179 A (Fig. 3, lanes 9-12). These results indicate that PhoQD179L (A) did not respond to high concentrations of Mg2+ to regulate phoPQ, mgtA and mgrB gene expression.. 29.
(35) (a). ~:~~~~rica :~ aD~4~m:~:=. E.carotovora 43 DK Y.pestis 43 DK E.coli S.enterica E.carotovora Y.pestis E.coli S.enterica. 104 104 103 102. 68. LLR H-R ESN. Y L F L. LNIV P DVDIN LSIS P ELELN. L LIY L LIYD 149. I. EKH P QRH P. iiP§SNGF~IEADVNDTSLLLSGDHSIQQmEVREDDD IK I P KTNGF IETNVDATSTLLSEDHSAQE L EVREDDD A I S I. i. P K. 164 I T 164 Y T. E.caro~ovora 162. Y.pestls. F F. ~tiLt ~~~~iP :~~~~i: ~~~:o li~:~iP. 161. T H T R. KTAY QKPGF. 163 163 161 160. LDTDSDTSSAVLTGNTLLLS L LNGTQN LDTGTHISRMMMGDNPKAQD L KYDDTDD. 179. TIVVV TIVVV TIVVV TIVVV. KSSYij KRSY QQED QRTDL. 103 103 102 101. 192 192 190 189. (b) 1200. ~. .~. 1000. ~. m. c. ..3 .~. >. 800. r'E. ~. rf. rr. rf. -. ~. r-. '". ~. ~. rf. ~. 200. o. rf. rr n L....:!:J. ~. ~. ~. ~. ~. ~ ~. L....:!:J. L....:!:J. L....:!:J. L....:!:J. L....:!:J. L....!J. L....:!:J. L....:!:J. L....:!:J. T47L. T48A. N68L. 090A. 0149A. 01501. 01511. 0152F. 0179L. 0179A. ~. r¥l . Fli9 . L....:!:J. L....:!:J. ~ . L....:!:J. MG1307 pMW119 pH0119. ~. Fig. 1. Effect of the mutations within the peri plasmic region of PhoQ on mgrB-lacZ expression . (a) Amino acid sequence alignment of the periplasmic domain from PhoQ protein . The amino acid sequences were identified with the Swiss-Prot database (http://kr.expasy.org). E coli, Escherichia coli (Swiss-Prot 10 : P23837); S. typhimurium , Salmonella enterica serovar Typhimurium (P14147); E carotovora, Erwinia carotovara (Q8GC78); Y. pestis, Yersinia pestis (Q93TP8). Alignments were performed using the GENETYX software (GENETYX CORPORATION , Japan). Boxed residues are conserved among these species. Amino acid residues indicated by dots were mutated in this study. (b) After Ecoli MG1307 (phoQ608: :Tn10dcam , mgrB:: lacZ)/ pMW119, pH0119 , pH047L, pH048A, pH068L, pH090A, pH0149A, pH0150l, pH01511 , pH0152F, pH0179L or pH0179A was grown to 00600=0.3-0.4 in LB (-) or LB containing 30 mM MgCI 2 (+), {3 -galactosidase activity was measured. Oata are mean values with SO .. -. 1000. t il. ~. s:::: ~. .-. 800. >.. .s;. co 600. () Q). til. co. "0 til. -. 400. 0. (). co co 200. Cl I. c:t:l.. 0. 1 234 5. 1 2 3 4 5. 1 2 345. 1 2 345. pMW119. pH0119. pH0179L. pH0179A. Fig. 2. Effect of the PhoQD179 mutations on mgrB-lacZ expression in the presence of Mg2+ or Ca 2+. After E coli MG1307 (phoQ608 :: Tn10dcam , mgrB::lacZ)/ pMW119, pH0119, pH0179L or pH0179A were grown to 00600 of 0.3 to 0.4 in LB (-) (bar1) or LB containing 5mM (bar2) or 30 mM (bar3) MgCI 2 (+) and 5 mM (bar4) or 30 mM (bar5) CaCI 2 , {3galactosidase activity was measured . Oata are mean values with SO.. 30.
(36) A+G 1. 2. 3. 4. 5. 6. 7. 8. 9. 10. 11. 12. phoPQ. 1 mgtA. 1 mgrB. 1=. Fig. 3. 5 1 nuc lease assay. Total RNAs were prepared from W311 0 (lanes 1 and 2), WQ3007 (lanes 3 and 4) , WQ3007/pMW 119 (lanes 5 and 6) WQ3007/pH0119 (lanes 7 and 8) , WQ3007/pH0179L (lanes 9 and 10) and. WQ3007/pH 0 179A (lanes 11 and 12) that were cultured in LB (lanes 1, 3, 5, 7,9 and 11) or LB containing 30 mM MgCI2 (lanes 2, 4, 6, 8, 10 and 12). A+G indicates Maxam-Gilbert sequence reaction. S1 nuclease assay was performed as descri bed in the text.. PhoQ T48 mutant is a constitutive mutant in S. enterica [Gunn, J.S ., et al. , 1996]. The equivalent mutation in the E. coli PhoQ protein resulted in a strain that responded to Mg2+ [Regelmann, A.G., et al., 2002], which is consistent with our results (Fig. 1). In S. enterica, Chamnongpol et al. (2003) evaluated how a D150, D151 and D152 acidic cluster of the PhoQ periplasmic region could be involved in regulation of the target genes by extracellular Mg2+. In their study, they concluded that the three residues within the acidic cluster (D150, 151 and 152) do not appear to be as critical as the conserved G93, W97, H120 and T156 . In E. coli, we also investigated the effects ofD149, D150, D151 and D152 on mgrB expression regulated by extracellular Mg2+. In E coli MG1307 /pH0149, pH0150, pH0151 or pH0152, mgrB-lacZ expression was repressed by Mg2+ (30 mM) (Fig. 1).. 31.
(37) (kDa). 1. 200. 2. 4. 3. 5. 6. 116 61. ~ PhoQ. 45. 31. 21. 14. Fig. 4. Isolation of membrane-bound PhoQ. The membrane was prepared as described in the text: BL21 (DE3)/pMHK028 grown in the presence (lanes 2, 4, 5 and 6) or absence (lane 3) of IPTG was sonicated and the ceillysates (lanes 2 and 3) were obtained . The ceillysates (lane 2) were centrifuged to obtain the supernatant (lane 4), which was ultracentrifuged to obtain another supernatant (lane 5). After obtaining ultracentrifugats of the supernatant (lane 5), the membrane (lane 6) was purified as a pellet. Lane 1 represents the molecular weight marker (200 , 116.3, 66.2,45, 31 , 21 .5, 14.4 kDa).. Effects of PhoQD179 mutant in isolated membrane on autophosphorylation and phosphotransfer to PhoP For autophosphorylation, histidine protein kinases reqmre certain divalent cations, mostly Mg2+, present in their cytoplasmic catalytic domain [Stock, A.M., 2000]. In the case of PhoQ sensor kinase, it was shown that Mg 2+ also binds to the periplasmic sensory domain and transmits inhibitory signals to the cytoplasmic catalytic domain [Vescovi , E. G. , 1996, 1997]. Based. on. this. model,. we. investigated. membrane-bound. PhoQ. autophosphorylation for 30 mm, as previously described, using E. coli membranes that were highly enriched in Salmonella enterica [Montagne, M. ,. 32.
(38) 2001]. E. coli BL21(DE3)/pMHK028 (PhoQ expression strain) was grown at. 37°C in an LB medium and induced with IPTG. Membrane-bound PhoQ was prepared as described in Materials and Methods. The phoQ gene product (about 55 kDa) was detected in the membrane fraction of cells that were induced by IPTG (FIg. 4, lane 6). This protein was not detected in soluble cell fractions of induced cells aside from the membrane fraction (Fig. 4, lane 5). Other membrane-bound proteins were prepared as well as membrane-bound PhoQ. We carried out autophosphorylation assay using the prepared membrane-bound PhoQ for 30 min (Fig. 5). Consequently, at 10 mM of Mg2+ concentration, in vitro autophosphorylation in a membrane-bound PhoQ (wild-type His kinase) was biphasic with a rapid autophosphorylation phase followed by a dephosphorylation phase as described previously [Montagne, M., 2001], but a PhoQD179L(A)-containing membrane showed a slower dephosphorylation. phase.. In. the. presence. of. 0.01. mM. Mg2+,. autophosphorylation of membrane-bound PhoQ of both wild type and D179L (A) mutant gradually increased for 30 min. On the other hand, the PhoQ-C lacking the periplasmic domain maintained its autokinase activity but could not be dephosphorylated when Mg2+ was present at either high or low concenration. Furthermore, autophosphorylation of membrane-bound CusS (one of the E. coli two-component sensors) was not observed in the presence of 0.01 mM Mg2+, but it gradually increased in the presence of 10 mM Mg2+ for 30 min. These results indicated that intrinsic dephosphorylation of autophosphorylated PhoQ is caused by Mg2+-binding on the periplasmic domain, but autophosphorylated PhoQD179L (A) was dephosphorylated more loosely than that of the wild-type PhoQ.. 33.
(39) Mg2+ (10 mM). o. 0.5. 1 2. Mg2+ (0.01 mM). 5 15 30 (min.). 0 0.5 1 2. 5 15 30 (min.). membrane PhoQ. •- I. PhoQ-C membrane CusS membrane PhoQD179L membrane PhoQD179A. -. f 16-. m-;lSI. .. ~. Fig . 5. Effect of Mg2+ concentrati on on membrane PhoQ autophosphorylation. Autophoshorylation assay of membrane PhoQ, PhoQ-C, membrane PhoQ01 79L, mem bra ne PhoQ01 79A or membrane CusS was initiated by the addition of [ y -32P1ATP in ki nase buffer containi ng 0.01 mM or 10 mM of MgCI2 co nce ntration. After adding 5 x SOS sample buffer each time, SOS-PAG E was performed and analyzed with BAS1000 .. Next, we investigated the effects of Mg2+ concentration on the autophosphorylation of Ph oQD 179L (A) (Fig. 6) . In the reaction buffer containing. 10. mM. Mg 2+ ,. autophosphorylation. activity. of. the. membrane-bound PhoQ decreased to a level ten times lower th an that in the presence of 0.05 mM Mg2+, but that of membrane-bound Ph oQD1 79L (A) was retained at a higher concentration of 0.5 to 10 mM (Fig. 6) . On the other hand, th e cytoplasmic domain of PhoQ showed high autophosph orylation activity in the presence of 0.05 to 10 mM of Mg2+ concentration and autoph osphorylation of membrane-bound CusS gradually increased to 10 mM Mg2+ concentration.. 34.
(40) (a). 2. membrane PhoQ membrane PhoQD179L. 1. I. ... 3. 4. It. 5. If. 6. -I. -. --- •. 1 1. PhoQ-C. membrane CusS. 1. (b) 1.5. 0.5. o. 1 23 45 6. membrane PhoQ. membrane membrane PhoQD179L PhoQD179A. PhoQ-C. Fig . 6. Effect of Mg2+ concent rat ions on autophosphorylati on of membrane PhoQD179 mutants. Membrane PhoQ, membrane PhoQ0 179L, membrane PhoQ0 179A, PhoQ-C or membrane CusS was incubated in kinase buffer containing 0.05 (lane 1), 0.1 (lane2) , 0.5 (lane3), 1 (lane4) , 5 (lane5) and 10 (lane6) mM MgCI 2 . Afte r SOS-PAGE (a), the density of each band was quantified with BAS 1000, and the autophosphorylation activity was shown as a ratio based on that of the phosphorylated band in the presence of 0.05 mM MgCI2 (lane 1) (b).. Furthermore, we examined the effects of PhoQD179L (A) mutation in an isolated membrane on phosphotransfer to PhoP. The phosphotransfer from membrane-bound PhoQ in the presence of 10 mM MgCb was five times lower than that in the presence of 0.05 mM MgCb (Fig. 7 a , d); however, in using membrane-bound PhoQD179L (A) , such a significant repression was not observed (Fig. 7 b, c, e and f) .. 35.
(41) (d). (a). 1 234 5 6 7 ~~• •~itt.,~ ...... membrane. r---------.. 2. PhoQ. o. 1.5. :; ... 1. o (e). (b). 1 2 345 6 7. 2,...------,. membrane ...... PhoQD179L. 1.5 o :; ... 1. 0.5. ...... PhoP. o (f). (c). 1 2 345 6 7. 234567. membrane ...... PhoQD179A. 2. 234567. r---------.. 1.5 o. .... :; 1. 0.5. ...... PhoP. o. 234567. Fig . 7. Effect of Mg2+ concentration on phosphotransfer. Phosphotransfer from Phosphorylated membrane PhoQ, membrane PhoQ0179L or membrane PhoQ0179A mutant to PhoP was performed in the presence of 0.05 (lane 2), 0.1 (lane 3), 0.5 (lane 4) , 1 (lane 5), 5 (lane 6) and 10 (lane 7) mM MgCI 2 as described in the text. In lane1 , the reaction was carried out in the absence of PhoP. After SOS-PAGE (a, b, c), the density of the PhoP band was quantified with BAS 1000, and the relative intensity based on that of PhoP in the presence of 0.05 mM MgCI 2 (lane 2) was shown as phosphotransfer activity (d , e, f) .. Accordingly, these results (Fig. 5-7) suggest that the periplasmic domain of PhoQ played an important role in repressing autophosphorylation by intrinsic dephosphorylation in the presence of higher Mg2+ concentration. However, the PhoQD179L (A) mutant was loosely dephosphorylated to maintain higher autophosphorylation activity and generate PhoP-phosphate, constitutively expressing PhoP-regulon genes expression (Fig. 8) .. 36.
(42) (a) wild type PhoQ ~ High Mg2+. ~ Low Mg2+. ~ ~. ~. PhoQ. p. >--<;0; ; ~ .. ~). ATP. PhoP. p ~. cytopl asm. activation of the target genes expression. ®. /. ~. p. repression of the target genes expression. (b) PhoQ D179L mutant ~ High Mg2+. ~ Low Mg2+ ~--------------. ~--------------. PhoQD179L. PhoP. constitutive of the target genes expression. constitutive expression of the target genes. Fig. 8. A model of extracellular Mg2+-sensing of E. coli PhoQ.. 37.
(43) Chapter N. Summary. Chapterll Transcription profile mIcro array analysis in Escherichia coli was performed to identify the member genes of the Mg2+ stimulon that respond to the. availability. of external. Mg2+. in. a. PhoQ/PhoP two-component. system-dependent manner. The mRNA levels of W3110 in the presence of 30 mM MgCb, WP3022 (phoP defective), and WQ3007 (PhoQ defective) were compared with those ofW3110 in the absence of MgCb. The expression ratios of a total of 232 genes were <0.75 in all three strains (the supplemental data are. shown. at. http://www.nara.kindai.ac.jp/nogei/seiken/array.html).. suggesting that the PhoQ/PhoP system is involved directly or indirectly in the transcription of these genes. Of those, 26 contained the PhoP box-like sequences with the direct repeats of (T/G)GTTTA within 500 bp upstream of the initiation codon. Furthermore, Sl nuclease assays of 26 promoters were performed to verify six new Mg2+ stimulon genes, hemL, nagA, rstAB, slyB,. vboR and yrbL, in addition to the phoPQ, mgrB and mgtA genes reported previously. In gel shift and DNase I footprinting assays, all of these genes were found to be regulated directly by PhoP. Thus, we concluded that the. phoPQ, mgrB, mgtA, hemL, nagA, rstAB, slyB, vboR and yrbL genes make up the Mg2+ stimulon in E. coli (Fig. 1).. 38.
(44) Chapter ill An Mg2+ sensor PhoQ179L(A) mutant was isolated and characterized in. Escherichia. coli.. Mg2+. stimulon. genes,. phoPQ,. mgtA. and. mgrB. transcriptions were repressed at high Mg2+ concentrations in WQ3007. {phoQ-defective strain)/pH0119 (pMW119 containing phoP, phoQ+-), but not in WQ3007/pH0179L (A) (pMW119 containing phoP phoQD179L or A). At 10. mM of Mg2+ concentration,. in. vitro autophosphorylation in a. membrane-bound PhoQ (wild type His kinase) was biphasic with a rapid autophosphorylation phase followed by a dephosphorylation phase, but a PhoQD179L(A)-containing membrane showed a slower dephosphorylation phase. On the other hand, the truncated PhoQ lacking the periplasmic domain. maintained. its. autokinase. activity. but. could. not. be. dephosphorylated when Mg2+ was present at higher concentrations. Furthermore, phosphotransfer of phosphorylated PhoQ to PhoP was repressed at high Mg2+ concentrations, but that of PhoQD179L (A) was not. These results support a model (Fig. 1) in which Mg2+ binding to the periplasmic domain of PhoQ regulates autokinase, resulting in adjusting the phosphor-PhoP concentration and Mg2+ stimulon gene expression in E. coli (Fig. 1).. 39.
(45) ~Mg2+. (a). ~ Q. Q : U >-< Ltv). PhoQ. ATP. --------. periplasm. --------. cytoplasm. ADP. r-. PhoP. ~ ~ rr::L ~ ~ ry:R ~. ~. (b). High Mg2+. ~. --------. periplasm p. PhoQ. cytoplasm. "--<. ®. PhoP. ~. mgtA. ~. mgrS. ~. ~. ® hemL. ~. yrbL. ~. ~. p~. ~. ~. ~. rstAS. ~. slyS. ~. ~. vboR. ~. ~. ~ nagA. ~. I phoPQ f-. Fig. 1 A model of PhoQ-PhoP two-component signal transduction system (M g2+ stimulon) in E. coli. In lower concentration of Mg2+, PhoQ is autophosphorylated , followed by phosphotransfer from P-PhoQ to PhoP and P-PhoP binds to the promoters of the target genes to activite Mg2+ stimulon . In higher concentration of Mg2+, P-PhoQ is intrinsically dephosphorylated and PhoQ also possesses phosphatase activity to P-PhoP, resulting in repressing Mg2+ stimulon.. 40.
(46) ACKNOWLEDGMENTS. I wish to express my sincerest gratitude to Professor Dr. Ryutaro Utsumi, Department of Bioscience and Biotechnology, Graduate School of Agriculture, Kinki University, for kind guidance, valuable suggestion and discussions, and continuous encouragement throughout the course of this work and critical reading of the manuscript. Special thanks are due to Drs. Tadashi Okamoto and Tamo Fukamizo, Professor of Department of Bioscience and Biotechnology, Graduate School of Agriculture, Kinki University, for reading the entire text in its original form. I also wish to express my sincerest acknowledgment to Associate Professor Dr. Hiroyuki Tanabe, Department of Agricultural Chemistry, Kinki University, and Assistant Professor Dr. Kaneyoshi Yamamoto, Department of Agricultural Chemistry, Kinki University, for their useful discussions and technical advices. I am also deeply indebted to Dr. Taku Oshima and Dr. Hirotada Mori, Research and Education Center for Genetic Information, Nara Institute of Science and Technology, for their valuable suggestions, discussions, and technical advices throughout the work of DNA microarray analysis. I would also like to thanks to Dr. Akira Ishihama, Department of Molecular Genetics, National Institute of Genetics, for their valuable suggestions, discussions, and technical advices throughout the work of PhoP binding reagion.. Finally, I am great indebted to Mr. Hiroshi Ogasawara, Mr. Eiji. 41.
(47) Furuta, Mr. Ryouta Okura, Mr. Hiroki Tuchitani, Mr. Hiroaki Morishita and other members of Department of Bioscience and Biotechnology, Graduate School of Agriculture and Department of Agriculture Chemistry, Kinki University.. 42.
(48) References. Aguirre, A., Lejona, S., Vescovi, E. G. and Soncini, F.. C. (2000). Phosphorylated PmrA interacts with the promoter region of ugd in. Salmonella. enterica serovar typhimurium. J.. Bacteriol.. 182:. 3874-3876.. Chamnongpol, S., Cromie, M. and Groisman, E. A. (2003) Mg2+ sensing by the Mg2+ sensor PhoQ of Salmonella enterica. J. Mol. BioI. 325: 795-807.. Fabret, C., Feher, V. A. and Hoch, J. A. (1999) Two-component signal transduction in Bacillus subtilis: how one organism sees its world. J. Bacteriol. 181:1975-1983.. Groisman, E. A. (2001) The pleiotropic two-component regulatory system PhoP-PhoQ. J. Bacteriol. 183:1835-1842.. Groisman, E. A., Heffron, F. and Solomon, F. (1992) Molecular genetic analysis of the Escherichia coli phoPlocus. J. Bacteriol. 174: 486-491.. Gunn, J. S., Hohmann, E. L. and Miller, S. 1. (1996) Transcriptional Regulation of Salmonella Virulence: a PhoQ Periplasmic Domain Mutation Results in Increased Net Phosphotransfer to PhoP. J.Bacteriol. 178: 6369-6373.. 43.
(49) Gupta, A., Matsui, K., Lo, J. F. and Silver, S. (1999) Molecular basis for resistance to silver cations in Salmonella. Nat. Med. 5:183-188.. Hall, M. N. and Shilhavy, T. J. (1985) Genetic analysis of the ompB locus in. Escherichia coliK-12. J. Mol. BioI. 151: 1-15. Hoch, J. A. and Silhavy, T. J. (1995) Two-component signal transduction. ASM press, Washington, D. C.. Hulett, F. M. (1996) The signal-transduction network for Pho regulation in Bacillus subtilis. Mol. Microbiol. 19: 933-939. Kadner, R. J. (1996) Cytoplasmic membrane. In Escherichia coli and. Salmonella: Cellular and Molecular Biology. (Neidhardt, F. C. ed) ASM press, Washington, D. C. pp58-87.. Kasahara, M., Nakata, A. and Shinagawa, H. (1992) Molecular analysis of the Escherichia coli phoP phoQ operon. J. Bacteriol. 174: 492-8.. Kato, A., Tanabe, H. and Utsumi, R. (1999) Molecular characterization of the PhoP-PhoQ. two-component. system. in. Escherichia. coli K-12:. identification of extracellular Mg2+ -responsive promoters. J.Bacteriol.. 181: 5516-5520.. 44.
(50) Kier, L. D., Weppeiman, R. M. and Ames, B. N. (1979) Regulation of non-specific and phosphatase in Salmonella: phoN and phoPgenes. J. Bacteriol. 138: 155-161. Lopez-Maury, L., Garcia-Dominguez, M., Florencio, F. J. and Reyes, J. C. (2002) A two-component signal transduction system involved. III. nickel sensing in the cyanobacterium Synechocystis sp. PCC 6803. Mol. Microbiol. 43: 247-256.. Miller, S. 1. and Mekalanos, J. J. (1990) Constitutive expression of the phoP regulon attenuates Salmonella virulence and survival within macrophages. J. Bacteriol. 172: 2485-2490.. Minagawa, S. Ogasawara,H., Kato, A., Yamamoto, K., Eguchi, Y., Oshima, T., Mori, H., Ishihama, A. and Utsumi, R. (2003) Identification and Molecular Characterization of the Mg2+ Stimulon of Escherichia coli.. J. Bacteriol. 185: 3696-3702.. Mizuno, T. (1997) Compilation of all genes encoding two-component phosphotransfer signal transducers in the genome of Escherichia coli. DNA Res. 4:161-168.. Montagne, M., Martel, A. and Le Moual, H. (2001) Characterization of the catalytic activities of the PhoQ histidine protein kinase of Salmonella. enterica serovar Typhimurium. J. Bacteriol. 183: 1787-1791. 45.
(51) Moual, L. H, Quang, T. and Koshland, D. E. Jr. (1998) Conformational changes in the cytoplasmic domain of the Escherichia coli aspartate receptor upon adaptive methylation. Biochemistry. 37: 14852-14859.. Munson, G. P., Lam, D. L., Outten, F. W. and O'Halloran, T. V. (2000) Identification of a copper-responsive two-component system on the chromosome of Escherichia coliK-12. J. Bacteriol. 182: 5864-5871.. Nixon, B. T., Ronson, C. W. and Ausubel, F. M. (1986) Two-component regulatory systems responsive to environmental stimuli share strongly. conserved. domains. with. the. nitrogen. assimilation. regulatory genes ntrB and ntrG. Proc. Natl. Acad. Sci. USA 83: 7850-7854. (a) Oshima, T., Aiba, H., Masuda, Y., Kanaya, S., Sugiura, M., Wanner, B. L., Mori, H. and Mizuno, T. (2002) Transcriptome analysis of all two-component regulatory system mutants of Escherichia coli K-12. Mol. Microbiol. 46: 281-291. (b) Oshima, T., Wada, C., Kawagoe, Y., Ara, T., Maeda, M., Masuda, Y., Hiraga,. S.. and. deoxyadenosine. Mori,. H.. (2002). Genome-wide. methyltransferase-mediated. analysis. control. of. of. gene. expression in Escherichia coli. Mol. Microbiol. 45: 673-695.. Regelmann, A. G., Lesley, J. A., Mott, C., Stokes, L. and Waldburger, C. D.. 46.
(52) (2002) Mutational Analysis of the Escherichia coli PhoQ Sensor Kinase:. Differences. with. the. Salmonella. enterica. Serovar. Typhimurium PhoQ Protein and in the Mechanism of Mg2+ and Ca2+ Sensing. J.Bacteriol., 184: 5468-5478.. Smith, R. L. and Maguire, M. E. (1998) Microbial magnesium transport: unusual transportes searching for identity. Mol. Microbiol. 28: 217-226.. Soncini, F. C. and Groisman, E. A. (1996) Transcriptional autoregulation of the Salmonella typhimurium phoPQ operon. J. Bacteriol. 177: 4364-4371.. Stock, A. M., Robinson, V. L. and Goudrean, P. N. (2000) Two-component signal transduction. Annu. Rev. Biochem. 69: 183-215. Vescovi, E. G., Ayala, Y. M., Cera, E. D. and Groisman, E. A., (1997) Characterization of the Bacterial Sensor Protein PhoQ. J.Biol.Chem., 272: 1440-1443.. Vescovi, E. G., Soncini, F. C. and Groisman, E. A. (1996) Mg2+ as an Extracellular Signal: Environmental Regulation of Salmonella virulence. Cell, 84: 165-174.. Waldburger, C. D. and Sauer, R. T. (1996) Signal detection by the PhoQ. 47.
(53) sensor-transmitter. J. BioI. Chern., 271: 26630-26636.. Wanner, B. L. (1995) Signal transduction and cross regulation in the. Escherichia. coli. phosphate. regulon. by. PhoR,. CreC,. and. acetylphosphate. (Hoch, J. A. and Shilhavy, T. J. ed.) Two-component signal transduction. ASM press, Washington, D. C. pp203-221.. Wosten, M. M., Kox, L. F., Chamnongpol, S., Soncini, F. C. and Groisman, E. A. (2000) A signal transduction system that responds to extracellular iron. Cell. 103: 113-125.. Yamamoto, K., Ogasawara, H., Fujita, N., Utsumi, R. and Ishihama, A. (2002) Novel mode of transcription regulation of divergently overlapping promoters by PhoP, the regulator of two-component system sensing external magnesium availability. Mol. Microbiol. 45: 423-438.. 48.
(54) PUBLICATIONS. Minagawa, S., Ogasawara, H., Kato, A., Yamamoto, K., Eguchi, Y., Oshima, T., Mori, H., Ishihama, A., and Utsumi, R, (2003) Identification and Molecular Characterization of the Mg2+ Stimulon of Escherichia coli. J.Bacteriol., 185: 3696-3702.. Minagawa, S., Okura, R, Tsuchitani, H., Hirao, K., Yamamoto, K., and Utsumi, R, Effect of PhoQD179 mutation on autophosphorylation of Mg2+ sensor PhoQ and the phosphotransfer to PhoP in Escherichia. coli. Submitted to Biosci. Biotrchnol. Biochem.. Eguchi, Y., Okada, T., Minagawa, S., Oshima, T., Mori, H., Yamamoto, K., Ishihama, A. and Utsumi, R (2004) Signal Transduction Cascade between EvgAlEvgS and PhoP/PhoQ Two-Component Systems of Escherichia coli. J Bacteriol., 186: 3006-3014.. Kitayama, T., Iwabuchi, R, Minagawa, S., Shiomi, F., Cappiello, J., Sawada, S.,. Utsumi,. R. olefin-dependent. and. Okamoto,. histidine. kinase. T.. (2004). inhibitory. Unprecedented of. zerumbone. ring-opening material. Bioorg. Med. Chern. Lett., 14: 5943-5946.. Yamamoto, K., Kitayama, T., Minagawa, S., Watanabe, T., Okamoto, T. and Utsumi, R (2001) Inhibitors of histidine protein kinase YycG. : Antibacterial agents that inhibit histidine protein kinase YycG of. 49.
(55) Bacillus subtilis. Biosci.Biotechnol.Bioshem. 65: 2306-2310.. ilft~*5t:, -,&)11$1- ~lpts:~EI=L N#jfff~*~~, J~Jij'[ t~ ~;b 0 '~Fl¥IHiiJi ~ ~li ~-t 0. 285-287.. 50. (2003). *alMij /. VtMl'llJ 0) 1m5B,. A~Ij~O)-t-t6') : 1~~. C: 1:~,. 41:.
(56)
図
+7


関連したドキュメント
A wave bifurcation is a supercritical Hopf bifurcation from a stable steady constant solution to a stable periodic and nonconstant solution.. The bifurcating solution in the case
n , 1) maps the space of all homogeneous elements of degree n of an arbitrary free associative algebra onto its subspace of homogeneous Lie elements of degree n. A second
By considering the p-laplacian operator, we show the existence of a solution to the exterior (resp interior) free boundary problem with non constant Bernoulli free boundary
The main problem upon which most of the geometric topology is based is that of classifying and comparing the various supplementary structures that can be imposed on a
Section 4 will be devoted to approximation results which allow us to overcome the difficulties which arise on time derivatives while in Section 5, we look at, as an application of
This paper presents an investigation into the mechanics of this specific problem and develops an analytical approach that accounts for the effects of geometrical and material data on
The object of this paper is the uniqueness for a d -dimensional Fokker-Planck type equation with inhomogeneous (possibly degenerated) measurable not necessarily bounded
In the paper we derive rational solutions for the lattice potential modified Korteweg–de Vries equation, and Q2, Q1(δ), H3(δ), H2 and H1 in the Adler–Bobenko–Suris list.. B¨
