Introduction
The toner used in printers and photocopiers for print-ing is an organic powder of approximately 5–10 μm in diameter and contains carbon black as a coloring agent. Toner safety has been attracting increasing at-tention since siderosilicosis caused by toner exposure was reported in the Lancet in 1994 [1], and respira-tory diseases such as granulomatous pneumonia have occasionally been reported [2-5]. The International Agency for Research on Cancer has changed the speci-fication of carbon black from Not classifiable as to its carcinogenicity to humans (group 3) to Possibly
car-cinogenic to humans (group 2B) [6]. We commenced a 10-year cohort study to examine the health effects in toner-handling workers in order to perform epidemio-logical research with sufficient factors such as incuba-tion and exposure periods.
We reported in an interim 4-year report that the ef-fect of toner exposure on respiratory function could not be confirmed [7]. In this 10-year report, we pres-ent the effects of toner exposure on respiratory func-tion, evaluated by determining biomarkers of respira-tory function and personal exposure to toner, among toner-handling workers.
[Original]
A 10-year Follow-up Cohort Study of the Health Effects in Toner-handling
Workers
Nobuaki Yanagi, Hajime Ando*, Kazunori Ikegami, Satoshi Michii, Tetsuro Uchiyama, Hiroaki Kuga, Tetsuhiro Matsushita, Shizuka Kurosaki, Akira Ogami and Toshiaki Higashi
Department of Work Systems and Health, Institute of Industrial Ecological Sciences, University of Occupational and Environmental Health, Japan. Yahatanishi-ku, Kitakyushu 807-8555, Japan
Abstract : In this study, we compare the results of a cross-sectional survey and secular changes between
toner-handling workers and non-toner-toner-handling workers, focusing on blood tests, urinalysis, respiratory function tests, and chest imaging results as indices of health effects. Of 116 employees who participated in the survey conducted at an office equipment manufacturer in Japan, 65 male employees who could be followed up for 10 years were in-cluded in the analysis. Thirty-eight workers engaged in toner-handling operations were considered toner-handling workers, and 27 not engaged in these operations were considered non-toner-handling workers. The blood tests (WBC, CRP, IgE, KL-6, and SP-D), urinalysis (8-OHdG), respiratory function tests (PEFR, VC, %VC, FEV1.0, and
FEV1.0%), chest radiography, and chest CT results were compared between both groups. Non-toner-handling workers
had significantly higher 8-OHdG/Cre at baseline and KL-6 at year 10 than did toner-handling workers. There were no significant differences between the results of the cross-sectional survey and a longitudinal survey of respiratory function test results. We conclude that there were no adverse health effects due to toner exposure.
Keywords : cohort study, printing, pulmonary disease, allergy.
(Received December 3, 2020, accepted March 1, 2021)
*Corresponding Author: Hajime Ando, Department of Work Systems and Health, Institute of Industrial Ecological Sciences, University of Occupa-tional and Environmental Health, Japan. 1-1 Iseigaoka Yahatanishi-ku, Kitakyushu 807-8555, Japan, Tel: +81-93-691-7470, Fax: +81-93-601-2667, E-mail: h-ando@med.uoeh-u.ac.jp
Materials and Methods
The study was commenced in November 2006 with the cooperation of an office equipment manufacturer that had workplaces in Japan. The survey was con-ducted annually for 10 years.
Participants
Among the participants, workers aged <50 years at baseline who engaged in toner cartridge manufactur-ing, research and development of toner, and research and development of laser printers/multifunction devic-es were considered toner-handling workers, and those not engaged in these operations were considered non-toner handling workers. Workers whose operations changed during the survey period from the latter to the former category were also considered toner-handling workers. The particle size of the toner targeted in the study was approximately 10 μm. The main compo-nent was polyester or styrene acrylic resin, with black toner containing carbon black. Among the 116 male and female employees who participated in the survey, 90 male employees were selected as participants to control the confounding factor of sex. Among those 90 male employees, 65 who participated in the survey in the first year (baseline) and the 10th year were in-cluded in the analysis. No participants withdrew from this study during the survey period because of health problems.
Determining personal exposure
Personal exposure to toner was determined by the light scattering method using a portable digital dust meter, PDS-2 model, or a newer meter, the LD-6N model (Sibata Scientific Technology LTD., Japan), in all the toner-handling workers annually at baseline and in the second year and then twice a year thereafter. The detector of the digital dust meter was placed on the collar of the workers, and the operation device and suction pump were placed on their waist. Dust expo-sure was meaexpo-sured continuously from the beginning to the end of the work day. A surveyor conducted the wearing, removal, and operation of the digital dust me-ters, and the workers were instructed not to touch the digital dust meter while working. The mass concen-tration conversion factor (K value) for the calculation
of mass concentration from the relative concentration measured with the digital dust meter was obtained by conducting concomitant measurements at each work-place at baseline and in the fifth year. The workers recorded their behavior during work according to the surveyor s instructions. The following items were recorded: workplace and work details of each time measurement, use of personal protective equipment, type of personal protective equipment, and behavior during break times, including smoking. The data of non-toner-handling work were excluded based on the records. If ≥5 samples were available, the upper 95% value of the logarithmic normal distribution (X95) was
calculated from the geometric mean (GM) and geo-metric standard deviation (GSD) using the following equation:
LogX95% = LogGM + 1.645 * LogGSD
If <5 samples were available, a value 3 times as large as the arithmetic mean (AM) was considered as X95.
The exposure limit value, which served as the benchmark for evaluating the results, was 3.0 (mg/m3),
a standard value of the time-weighted average for 8 h (TWA8h) in the Particles (insoluble or poorly solu-ble) not otherwise specified proposed by the Ameri-can Conference of Governmental Industrial Hygienists (ACGIH).
Survey of work history
Toner-handling workers were asked to use the self-recording questionnaire to record their toner-handling work time. The toner-handling work time was re-corded as days, weeks, and months, and details of the descriptions were confirmed by the occupational physician of the office equipment manufacturer and a surveyor from the University of Occupational and En-vironmental Health, Japan.
Measurement of the amount of toner exposure
In the design of this cohort study, participants en-gaged in operations related to toner were designated as toner-handling workers, but the work environment and the toner-handling work of the participants may have changed during the 10-year follow-up period. To evaluate the actual situation in such cases, the status of toner exposure for 10 years was relatively quantified from the results of the personal exposure measurement
and the work history survey conducted every year: the arithmetical mean (mg/dl) of the work environment value in each workplace calculated from the personal exposure of toner-handling workers was multiplied by the total annual work time (h) of each worker and ac-cumulated for 10 years. This value is referred to as the total exposure index (TEI). The total annual work time was estimated by multiplying the work time con-firmed in the work history survey according to 20 days a month for 12 months.
TEI = Σ (estimated personal exposure)*(estimated total toner-handling hours)
Blood tests
We compared the inflammation biomarkers white blood cells (WBC) and C-reactive protein (CRP); the allergy biomarker immunoglobulin E (IgE); and the pulmonary fibrosis biomarkers sialylated carbohydrate antigen KL-6 and surfactant protein D (SP-D). Test samples were collected at a hospital affiliated with the office equipment manufacturer and analyzed by LSI Medience Corporation. The high-sensitive CRP levels were used in the 10th year analysis.
Urinalysis
We measured the oxidative stress biomarker 8- hydroxy-2 -deoxyguanosine (8-OHdG) in the urine, and compared the value corrected for creatinine. Test samples were collected at a hospital affiliated with the office equipment manufacturer and analyzed by OHG Institute, a venture company of the Department of En-vironmental Oncology, University of Occupational and Environmental Health, Japan. The 8-OHdG lev-els were measured by the HPLC-ECD (high-perfor-mance liquid chromatographic-electrochemical detec-tor) method, based on a study by Kasai et al [8, 9]. Respiratory function test
The respiratory function test was conducted using an electronic spirometer, HI-801 (Chest M.I., Inc., Japan), in the pneumotachographic mode. Since the results of the respiratory function test change depending on the skill and proficiency of the technicians, it was con-ducted three times under the supervision of a labora-tory technician and the representative value was used. The test items were as follows: 1) peak flow (PEFR), 2)
vital capacity (VC), 3) predicted vital capacity (%VC), 4) forced expiratory volume in 1 s (FEV1.0), and 5)
per-centage forced expiratory volume in 1 s (FEV1.0%). The
predicted vital capacity was determined using the nor-mal prediction formula of vital capacity proposed by the Japanese Respiratory Society in 2001, which was based on the data of Japanese people [10]. The predic-tion formula for men proposed by the Japanese Respi-ratory Society is given below.
Normal prediction formula of vital capacity: 0.045 × height (cm) − 0.023 × age − 2.258 (l )
Chest X-ray
X-rays of the entire thoracic region by direct radi-ography were performed according to the photograph-ing method for health checkups of pneumoconiosis in Japan. The image was read twice by a pair of trained doctors from the University of Occupational and En-vironmental Health, Japan, based on the International Labour Office (ILO) International Classification of Radiographs of Pneumoconiosis. Chest X-ray exami-nations were conducted annually in this survey, but the results at baseline and the 10th year were compared in this report.
Chest computed tomography
Chest computed tomography (CT) examinations were performed, and the image was read twice by a pair of doctors from the University of Occupational and Environmental Health, Japan. Findings read by a radiologist of the implementing institution were also referenced. Chest CT examinations were performed at baseline, the fifth year, and the 10th year in this sur-vey, but the results at baseline and the 10th year were compared in this report.
Statistical analysis
Secular changes in the respiratory function were calculated by subtracting the results of the respiratory function test at the 10th year from the results of the test at baseline. The normality of the distribution of age, physical constitution (height, weight, and Body mass index; BMI), blood test results, urinalysis results, and respiratory function test results were evaluated by the Shapiro–Wilk test. There was not a normal distribu-tion in the data for the age at baseline, results of the
blood and urine tests at baseline and the 10th year, the FEV1.0% at the 10th year, and the annual changes in
PEFR, %VC, FEV1.0 and FEV1.0%. Therefore, the
sta-tistical differences in both indices between toner-han-dling workers and non-toner-hantoner-han-dling workers were tested by the Mann–Whitney U test. Other indices that showed normal distribution were tested by Student s t-test. Secular changes in the respiratory function due to toner exposure were estimated by multiple linear regression analysis with a stepwise method. The de-creases in PEFR, VC, %VC, FEV1.0, and FEV1.0% per
year were considered dependent variables, while TEI, age, smoking status at the 10th year, and BMI were considered independent variables. IBM SPSS Statis-tics 24 (IBM Corp.) was used to conduct all statistical analyses, and the differences were considered signifi-cant if the P-value was <0.05.
Ethical considerations
The following items were examined in advance: the guarantee of the participant s free choice, measures for securing the participant s privacy, the method of ob-taining the participant s understanding and consent, the announcement of the study results to the participants, the handling of biological samples collected from par-ticipants (such as storage, and disposal), the prohibi-tion of unintended use of biological samples collected from the participants, the destruction of information on the surveys after the end of the study, the possible risks and disadvantages to the participants, and coun-termeasures for the occurrence thereof. These items were reviewed and approved by a third party, the Eth-ics Committee of Medical Research of the University of Occupational and Environmental Health, Japan (re-ceipt number 03-32, December 10, 2003).
Results
Characteristics of participants
This study included 27 non-toner-handling workers and 38 toner-handling workers. Five toner-handling workers had periods during which they were not en-gaged in toner-handling work. The characteristics of age and body constitution that could influence the base-line respiratory function of the participants are shown in Table 1. The median age of the non-toner-handling and
toner-handling workers was 38.0 years (24–47 years, quartile deviation 6.0) and 30.5 years (25–43 years, quartile deviation 4.0), respectively. There was a sta-tistically significant difference between the groups in terms of age, but not in terms of height, weight, or BMI. The questionnaire confirmed that 10 (two non-ton-er-handling workers and eight toner handling workers) of 20 current smokers at baseline had quit smoking by the 10th year.
Work environment evaluation and TEI
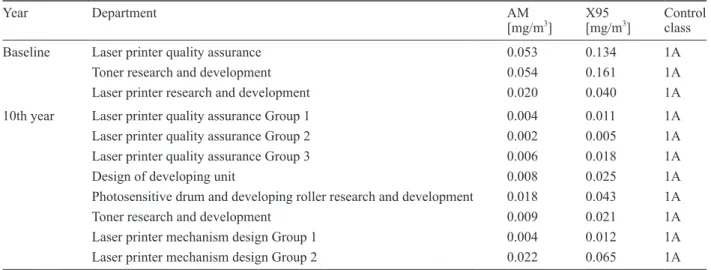
The results of the evaluation of the work environ-ment in the toner-handling workplace at baseline and in the 10th year based on the personal exposure mea-surement are shown in Table 2. The exposure limit value was 3.0 (mg/m3), a standard value of TWA8h in
the Particles (insoluble or poorly soluble) not other-wise specified proposed by the ACGIH. The evalu-ation criteria adopted from the Guideline for deter-mination of personal exposure to chemical substance released by the Japan Society for Occupational Health in January 2015 are shown in Table 3. All toner-han-dling workplaces provided a good work environment. The workers in the Department of Quality Assurance of Laser Printers who evaluated the printing of laser printers that operated for a long time came close to the Table 1. Baseline characteristics of participants
Non-toner-handling workers (n = 27) Toner-handling workers (n = 38) P-value Age [years] 38.0 (6.0) 30.5 (4.0) 0.003‡ Physical indices Height [cm] 169.8 (6.2) 170.6 (5.4) 0.57† Weight [kg] 67.1 (7.4) 64.4 (8.5) 0.18† BMI [kg/m2] 23.3 (2.5) 22.1 (2.8) 0.08† Smoking* Current smokers 9 (33.3) 11 (28.9) Former smokers 7 (25.9) 6 (15.8) Non-smokers 11 (40.7) 21 (55.3)
The results are expressed as the mean value (standard devia-tion), except the result for age. which is expressed as the median value (quartile deviation). *Values are presented as percentages. † Student s t-test: not significant. ‡ Mann–Whitney U test: sig-nificant difference. BMI: body mass index.
operating printer as frequently as needed, but they did not wear personal protective equipment. Local venti-lation was used in the Department of Research and De-velopment of Toner, and the amount of toner powder handled in these rooms was small. All of the workers wore 1/4-hedron dust respirators at all times.
Workers in the Department of Developing Unit De-sign and the Department of Research and Develop-ment of Photosensitive Drum and Developing Roller filled cartridges with toner before testing the units and parts. During the filling work, local ventilation was used and all workers wore 1/4-hedron dust respirators at all times. In other work, however, local ventilation and personal protective equipment were not used, as workers only handled the cartridges filled with toner. Workers in the Department of Laser Printer
Mecha-nism Design only handled the cartridges; therefore, lo-cal ventilation and personal protective equipment were not used.
The TEI data followed a normal distribution, and its mean value was 293.66 (standard deviation 150.25). Comparison of blood tests and results of urinalysis The results of the blood tests and urinalysis at base-line and the 10th year are shown in Table 4. The me-dian 8-OHdG/Cre values at baseline in the non-toner-handling and toner-non-toner-handling workers were 4.82 ng/mg (quartile deviation 1.20) and 3.84 ng/mg (quartile de-viation 1.05), respectively. There were no statistically significant differences between the two groups in terms of WBC, CRP, IgE, KL-6, and SP-D, but 8-OHdG/ Cre was significantly higher in the non-toner-handling Table 2. Work environment evaluation of each workplace
Year Department AM
[mg/m3] X95[mg/m3] Control class
Baseline Laser printer quality assurance 0.053 0.134 1A
Toner research and development 0.054 0.161 1A
Laser printer research and development 0.020 0.040 1A
10th year Laser printer quality assurance Group 1 0.004 0.011 1A
Laser printer quality assurance Group 2 0.002 0.005 1A
Laser printer quality assurance Group 3 0.006 0.018 1A
Design of developing unit 0.008 0.025 1A
Photosensitive drum and developing roller research and development 0.018 0.043 1A
Toner research and development 0.009 0.021 1A
Laser printer mechanism design Group 1 0.004 0.012 1A
Laser printer mechanism design Group 2 0.022 0.065 1A
AM: arithmetical mean, X95: 95% upper limit value for logarithmic normal distribution. Table 3. Evaluation criteria for the work environment
Control class Definition Evaluation
1A X95 < OELV and X95 < (OELV*10%) Very good
1B X95 < OELV and AM < (OELV*10%) Sufficiently good
1C X95 < OELV and (OELV*10%) ≤ AM Good
2A AM ≤ OELV ≤ X95 and AM ≤ (OELV*50%) Examine the effectiveness of the present procedure in detail
Efforts to reduce the exposure are necessary
2B AM ≤ OELV ≤ X95 and (OELV*50%) < AM Take risk-reduction measures
3 OELV < AM Take risk-reduction measures immediately
Evaluated based on the Guidelines for determination of personal exposure to chemical substances released by the Japan Society for Oc-cupational Health in January 2015 [26]. AM: arithmetical mean, OELV: ocOc-cupational exposure limit value, X95: 95% upper limit value for logarithmic normal distribution.
workers than in the toner-handling workers. The me-dian KL-6 and the meme-dian 8-OHdG/Cre values at the 10th year were 239.00 U/ml (quartile deviation 55.00) and 3.47 ng/mg (quartile deviation 0.90), respectively, in the non-toner handling workers, and 211.00 U/ml (quartile deviation 47.50) and 3.01 ng/mg (quartile de-viation 0.89), respectively, in the toner handling work-ers. There were no statistically significant differences between the groups in terms of WBC, CRP, IgE, SP-D, and 8-OHdG/Cre, but KL-6 was significantly higher in the non-handling workers than in the toner-handling workers.
Comparison of results of respiratory function test The results of the respiratory function test at base-line and the 10th year are shown in Table 5. There were no statistically significant differences between the two groups at baseline and the 10th year.
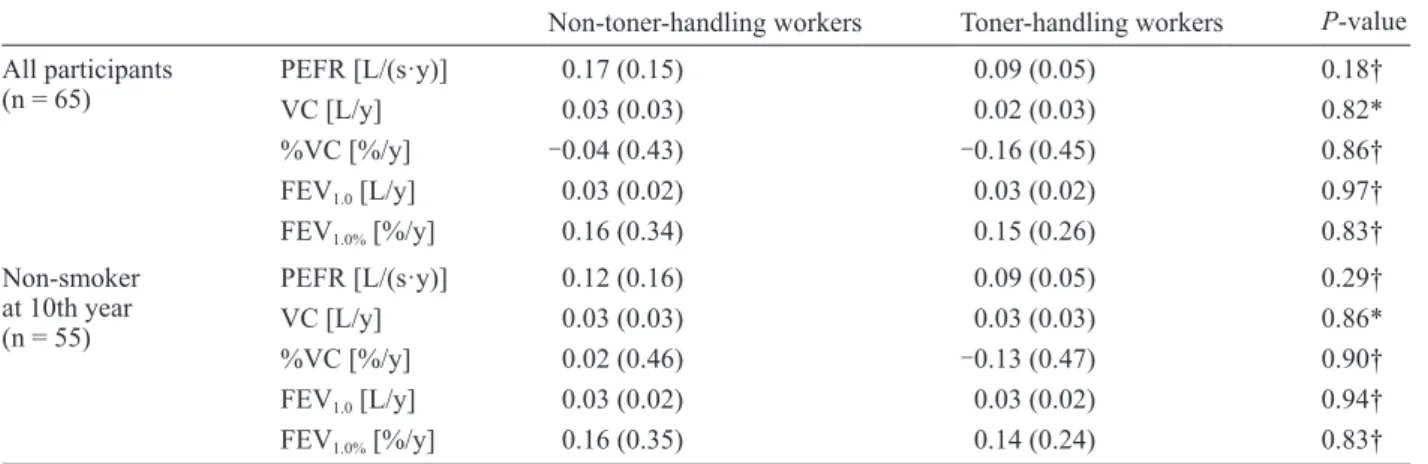
The difference in the annual decrease in respiratory function was compared for all the participants and non-smokers at the 10th year, to examine secular changes in the respiratory function with or without toner expo-sure. The results are shown in Table 6. There were no statistically significant differences between the two groups. A similar analysis was conducted in 55 non-Table 4. Results of biochemical indices at baseline and 10th year
Non-toner-handling workers Toner-handling workers P-value
Baseline n = 65 WBC [/μl]CRP [mg/dl] 5500.00 (1050.00)0.03 (0.04) 5600.00 (1025.00)0.03 (0.02) 0.46*0.14* IgE [IU/ml] 92.00 (134.50) 89.00 (95.50) 0.47* KL-6 [U/ml] 222.00 (44.50) 210.50 (56.50) 0.59* SP-D [ng/ml] 35.20 (13.00) 51.35 (24.39) 0.11* 8-OHdG/Cre [ng/mg] 4.82 (1.20) 3.84 (1.05) 0.047† 10th year n = 65 WBC [/μl]CRP [mg/dl] 5600.00 (800.00)0.03 (0.02) 6050.00 (1200.00)0.03 (0.02) 0.17*0.45* IgE [IU/ml] 120.00 (92.00) 65.00 (71.00) 0.08* KL-6 [U/ml] 239.00 (55.00) 211.00 (47.50) 0.02† SP-D [ng/ml] 41.60 (11.10) 51.30 (23.88) 0.49* 8-OHdG/Cre [ng/mg] 3.47 (0.90) 3.01 (0.89) 0.07*
The result is expressed as the median value (quartile deviation). * Mann–Whitney U test: not significant. † Mann–Whitney U test: significant difference. WBC: white blood cell, CRP: C-reactive protein, IgE: immunoglobulin E, KL-6: the sialylated carbohydrate antigen, SP-D: Surfactant Protein-D, 8-OHdG/Cre: 8-hydroxy-2 -deoxyguanosine per creatinine.
Table 5. Results of respiratory function test at baseline and 10th year
Non-toner-handling workers Toner-handling workers P-value
Baseline PEFR [L/s] 10.05 (1.52) 9.91 (1.50) 0.71* VC [L] 4.68 (0.56) 4.60 (0.64) 0.59* %VC [%] 103.51 (9.81) 98.48 (11.09) 0.06* FEV1.0 [L] 3.91 (0.42) 3.88 (0.54) 0.78* FEV1.0% [%] 85.80 (5.57) 86.92 (6.35) 0.46* 10th year PEFR [L/s] 8.50 (1.70) 9.13 (1.56) 0.13* VC [L] 4.46 (0.53) 4.39 (0.64) 0.66* %VC [%] 103.53 (10.06) 98.95 (12.29) 0.12* FEV1.0 [L] 3.57 (0.49) 3.61 (0.55) 0.78* FEV1.0 % [%] 83.59 (2.59) 84.87 (2.44) 0.46†
The result is expressed as the mean value (standard deviation), except the result for FEV1.0% at the 10th year, which is expressed as the
medi-an value (quartile deviation). * Student s t-test: not significmedi-ant. † Mmedi-ann–Whitney U test: not significmedi-ant. PEFR: peak flow, VC: Vital capac-ity, %VC: predicted vital capaccapac-ity, FEV1.0: forced expiratory VC volume in 1s, FEV1.0%: forced expiratory volume in 1s as a percent of Forced
smoking participants (20 non-toner-handling workers and 35 toner-handling workers) at the time of the sur-vey at the 10th year, and there were no statistically sig-nificant differences between the two groups.
In the multiple linear regression analysis of secular changes in the respiratory function, the multiple lin-ear regression model could not be expressed for the annual decreases in PEFR, FEV1.0, and FEV1.0%. The
multiple linear regression model for annual decrease in VC was (F(2,35) = 7.612, P < 0.002), with an R2
of 0.303, and the multiple linear regression formula was 0.163 + 0.005 (BMI) + 0.002 (age). The multiple linear regression model for annual decrease in %VC
was (F(1,36) = 4.264, P < 0.046), with an R2 of 0.106,
and the multiple linear regression formula was -2.088 + 0.049 (age).
Results of imaging tests
The results of chest X-rays at baseline and the 10th year in non-toner-handling and toner-handling work-ers are shown in Table 7.
The findings in the non-toner-handling workers at baseline were shadows of masses, pleural thickenings without calcification, bullae, and blunt costophrenic angles. The findings in the toner-handling workers at baseline were pleural thickenings without calcifica-Table 6. Secular changes in respiratory function
Non-toner-handling workers Toner-handling workers P-value
All participants
(n = 65) PEFR [L/(s·y)]VC [L/y] 0.17 (0.15) 0.03 (0.03) 0.09 (0.05) 0.02 (0.03) 0.18†0.82*
%VC [%/y] -0.04 (0.43) -0.16 (0.45) 0.86† FEV1.0 [L/y] 0.03 (0.02) 0.03 (0.02) 0.97† FEV1.0% [%/y] 0.16 (0.34) 0.15 (0.26) 0.83† Non-smoker at 10th year (n = 55) PEFR [L/(s·y)] 0.12 (0.16) 0.09 (0.05) 0.29† VC [L/y] 0.03 (0.03) 0.03 (0.03) 0.86* %VC [%/y] 0.02 (0.46) -0.13 (0.47) 0.90† FEV1.0 [L/y] 0.03 (0.02) 0.03 (0.02) 0.94† FEV1.0% [%/y] 0.16 (0.35) 0.14 (0.24) 0.83†
The decrease was calculated by subtracting the value at the 10th year from baseline value and by dividing the obtained value by the num-ber of years (9 years). VC is expressed as mean value (standard deviation), and PEFR, %VC, FEV1.0, and FEV1.0% are expressed as median
value (quartile deviation). Of the 55 non-smokers at the 10th year, 20 were non-toner-handling workers and 35 were toner-handling workers. * Student s t-test: not significant. † Mann–Whitney U test: not significant. PEFR: peak flow, VC: Vital capacity, %VC: predicted vital capac-ity, FEV1.0: forced expiratory VC volume in 1s, FEV1.0%: forced expiratory volume in 1s as a percent of Forced vital capacity (FVC). Table 7. Results of chest X-ray at baseline and 10th year
Non-toner-handling workers Toner-handling workers
Baseline Finding present 3 (11.11) 1 (2.70)
Profusion rate
0/0 27 (100.00) 36 (97.30)
0/1 0 1 (2.70)
1/0 0 0
10th year Finding present 4 (14.81) 3 (7.89)
Profusion rate
0/0 27 (100.00) 38 (100.00)
0/1 0 0
1/0 0 0
Results are expressed as the number (%) of workers. Profusion rate was the classification of small opacities based on the ILO International Classification of Radiographs of Pneumoconiosis. Among toner-handling workers, only one worker could not undergo chest X-ray at baseline. Findings of pneumoconiosis of 1/0 or worse were not observed.
tion. The findings in the non-toner handling work-ers at the 10th year were nodular shadows, pleural thickenings without calcification, bullae, and blunt costophrenic angles; three of the four participants with these findings were the same as those at baseline. The findings in the toner-handling workers at the 10th year were pleural thickenings without calcification and pleurodesis; one of the three participants was the same as at baseline. There were no findings of pneu-moconiosis with a profusion rate of ≥1/0 at baseline and the 10th year. Among the toner-handling workers, the participant evaluated with a profusion rate of 0/1 at baseline was evaluated with a profusion rate of 0/0 at the 10th year.
The results of chest CT at baseline and the 10th year in the non-toner-handling and toner-handling workers are shown in Table 8. There were no findings sug-gestive of granulomatous pneumonia or malignant tu-mors.
Discussion
The biomarkers in the blood and urine at baseline and the 10th year were compared between non-toner-handling and toner-non-toner-handling workers to estimate the effects of toner exposure on the respiratory function. WBC counts and CRP levels increase in association with acute inflammation in the body, including in the respiratory organs, and the levels of high-sensitive CRP increase with increasing concentrations of PM2.5
[11], suggesting that it is a useful marker for airway inflammation [12]. Moreover, the IgE antibody titer increases in patients with allergic diseases such as bronchial asthma.
In this study, there were no significant differences in WBC, CRP, and IgE antibody titer between the
non-toner-handling and toner-handling workers, sug-gesting that toner exposure does not induce inflamma-tory responses or allergic reactions. KL-6 and SP-D increase in patients with idiopathic pulmonary fibrosis [13]; these have been used in daily medical practice. Measuring serum KL-6 and SP-D every 6 months is obligatory by law in Japan for business operators for the healthcare of workers handling indium compounds [14]. KL-6 and SP-D are used as interstitial pneumo-nia biomarkers in daily medical practice and occupa-tional health. In this study, the results did not show significantly high values in toner-handling workers, suggesting that toner exposure does not induce inter-stitial pneumonia.
8-OHdG is a marker of oxidative DNA damage, and has been widely used as an oxidative stress marker. Takahashi et al reported that the 8-OHdG level in the DNA of white blood cells in the peripheral blood in-creased in asbestos-handling workers [15], and Kim et al reported that the 8-OHdG level in the urine in-creased with an increase in the concentration of PM2.5
in boiler workers [16]. 8-OHdG was also used as an index of acute exposure in welding in a previous study [17]. These results suggest that 8-OHdG is useful as a respiratory disorder biomarker [12].
There is no common reference value for 8-OHdG/ Cre. In a previous survey of 372 workers, the mean value (SE) of 8-OHdG/Cre in 286 male workers was 4.17 (0.10) ng/mg [18]. According to the same survey, the mean value (SE) of 8-OHdG/Cre was significantly higher in smokers than in non-smokers (smokers [n = 195], mean (SE) 4.38 [0.13] ng/mg, and nonsmokers [n = 167], 3.48 [0.13]). They also noted that 8-OHdG/ Cre is affected by fruit intake, physical activity, alco-hol consumption, and smoking [19].
In the present study, 8-OHdG/Cre was significantly higher in the non-toner-handling workers than in the toner-handling workers at baseline. The proportion of smokers was higher among the non-toner-handling workers than among the toner-handling workers, which may have affected the results. The median value of 8-OHdG/Cre in the toner-handling workers was 3.84 ng/mg, which is not high compared to that reported in previous studies, making it unlikely that 8-OHdG/ Cre is increased by toner exposure. The significant difference between both groups at baseline may have Table 8. Number of participants with chest CT findings
at baseline and 10th year
Non-toner handling
workers Toner handling workers
Baseline 15 (55.56) 12 (31.58)
10th year 8 (29.63) 10 (26.32)
Results are expressed as the number (%) of workers. There were no findings suggestive of granulomatous interstitial pneumonia or lung cancer.
been due to lifestyle factors other than toner exposure, including smoking.
KL-6, whose reference value is <500 U/ml, was significantly higher in the non-toner-handling workers than in the toner-handling workers, and was below the reference value in both groups. KL-6 increases with age and chronic smoking [20]. The mean age of the non-toner-handling workers was significantly higher than that of the toner-handling workers, and the smok-ing rate was higher, which may have affected the KL-6 value. Nonetheless, the changes were within the nor-mal range and had little clinical significance.
It was difficult to evaluate the change in respiratory function using only biomarkers in the blood and urine. Therefore, the respiratory function test results of the non-toner-handling and toner-handling workers were compared between baseline and the 10th year; how-ever, no significant differences were observed. The decrease in respiratory function per year, obtained by subtracting the respiratory function test value at the 10th year from that at baseline and dividing by 9 years, was also compared to examine the rate of change in respiratory function in the non-toner-handling and toner-handling workers, but no significant differences were observed. As smoking affects the respiratory function, a similar comparison was conducted in the non-smoking participants at the 10th year to control for the smoking factor, but there were no significant differences between the non-handling and toner-handling workers. A previous study showed a similar result [7], and the results after 5 years also showed a similar tendency.
Many epidemiological studies on the health effects of toner exposure in toner-handling workers have been conducted [7, 21-23], including a cross-sectional study by Nakadate that included a toner manufacturer [24]. A limitation of these surveys, however, was the good work environment. The office equipment manu-facturer that participated in the present study also pro-vided a good work environment by observing the laws and regulations concerning occupational health and voluntarily improving the work environment and work procedures. An index referred to as the TEI was newly established to evaluate the biological effects of toner exposure under such conditions. The TEI does not in-dicate the actual amount of exposure; it is a numerical
figure obtained by calculating the evaluation value of each department from the results of the personal expo-sure meaexpo-surement of all toner-handling workers and multiplying it by the time engaged in toner-handling work for 10 years, implying a cumulative exposure to toner particles. We examined the factors affecting re-spiratory function, such as TEI, age, body constitution, and smoking status at the 10th year, by multiple linear regression analysis, but toner exposure did not contrib-ute to a decrease in pulmonary function.
As cases of siderosilicosis and granulomatous pneu-monia due to toner exposure have been reported [1, 2], chest X-rays and chest CT images at baseline and the 10th year were compared in this study, but no findings of pneumoconiosis or findings suggestive of malignant tumors or active diseases were observed in the toner handling workers. There was a difference in finding ratios between chest X-ray and CT at both baseline and the 10th year, but this may have been be-cause a CT image can show more information than an X-ray. Moreover, the doctors who read the images at the 10th year were different from those who read the images at baseline.
Respiratory symptoms such as sneezing and cough-ing due to operatcough-ing printers and photocopiers have been reported, and volatile organic compounds (VOCs) are thought to be one of the causes. Office equipment such as photocopiers generates indoor pollutants, in-cluding VOCs [25], and VOC exposure may increase depending on the type and usage of office equipment. In this study, the work of evaluating the printing of laser printers operating for a long time was identified as toner-handling work, but environmental evaluation of VOCs was not conducted. A limitation of this study was that the health effects were evaluated by exposure to toner particles only, and not by mixed exposure, in-cluding VOCs. Another limitation is that this study included a small number of participants; a large-scale survey and a survey with combined factors including VOCs are required for more conclusive results.
Conclusion
Our results suggest that there is no health effect of exposure to toner particles. Although the number of participants was small, this study is significant as the
amount of toner exposure of all the toner-handling workers was included as a survey item.
Acknowledgments
We are grateful to Dr. Masamichi Uehara (Brother Industries, Ltd.) for assistance with data collection. We would like to thank DMC Corp. and Editage for editing and reviewing this manuscript for English lan-guage.
Conflict of Interest
The authors declare that they have no conflict of in-terest.
Funding
This study was funded by a grant from Brother In-dustries, Ltd. However, the research fund had no con-trol over the design, interpretation of data, writing, or publication of this study.
References
1 . Gallardo M, Romero P, Sanchez-Quevedo MC & Lopez-Caballero JJ (1994): Siderosilicosis due to photocopier toner dust. Lancet 344(8919): 412-413
2 . Armbruster C, Dekan G & Hovorka A (1996): Granulo-matous pneumonitis and mediastinal lymphadenopathy due to photocopier toner dust. Lancet 348(9028): 690 3 . Wieriks J (1996): Photocopier toner dust and lung
dis-ease. Lancet 348(9040): 1518-1519
4 . Rybicki BA, Amend KL, Maliarik MJ & Iannuzzi MC (2004): Photocopier exposure and risk of sarcoidosis in African-American sibs. Sarcoidosis Vasc Diffuse Lung Dis 21(1): 49-55
5 . Wittczak T, Walusiak J, Ruta U & Palczynski C (2003): Occupational asthma and allergic rhinitis due to xero-graphic toner. Allergy 58(9): 957
6 . International Agency for Research on Cancer (1996): Printing processes and printing inks, carbon black and some nitro compounds. Lyon, France, 10-17 October 1995. IARC Monogr Eval Carcinog Risks Hum 65: 33-495
7 . Yanagi N, Kitamura H, Mizuno M et al (2014): A 4-Year
Follow-up Cohort Study of the Respiratory Functions in Toner-handling Workers. Saf Health Work 5(4): 222-226
8 . Kasai H, Kawai K & Li Y-s (2008): Analysis of 8-OH-dG and 8-OH-Gua as Biomarkers of Oxidative Stress. Genes and Environment 30(2): 33-40
9 . Kasai H, Svoboda P, Yamasaki S & Kawai K (2005): Simultaneous Determination of 8-hydroxydeoxyguano-sine, a Marker of Oxidative Stress, and Creatinine, a Standardization Compound, in Urine. Industrial Health 43(2): 333-336
10 . Pulmonary physiology expert committee, The Japa-nese Respiratory Society (2001): The standard value of spirogram and arterial blood gas partial pressure in Japanese people. Journal of the Japanese Respiratory Society 39(5): S1-S17
11 . Delfino RJ, Sioutas C & Malik S (2005): Potential role of ultrafine particles in associations between air-borne particle mass and cardiovascular health. Environ Health Perspect 113(8): 934-946
12 . Morimoto Y, Kitamura H, Kuga H et al (2009): New Investigation of the Effect of Toner and Its By-Prod-ucts on Human Health and Occupational Health Man-agement of Toner 51(1): 1-10
13 . Raghu G, Collard HR, Egan JJ et al (2011): An Official ATS/ERS/JRS/ALAT Statement: Idiopathic Pulmo-nary Fibrosis: Evidence-based Guidelines for Diagno-sis and Management. American Journal of Respiratory and Critical Care Medicine 183(6): 788-824
14 . Ministry of Health, Labour and Welfare, Japan (1972 (revised 2018)): Ordinance on Prevention of Hazards Due to Specified Chemical Substances
15 . Takahashi K, Pan G, Kasai H et al (1997): Relationship between Asbestos Exposures and 8-Hydroxydeoxy-guanosine Levels in Leukocytic DNA of Workers at a Chinese Asbestos-material Plant. Int J Occup Environ Health 3(2): 111-119
16 . Kim JY, Mukherjee S, Ngo LC & Christiani DC (2004): Urinary 8-hydroxy-2 - deoxyguanosine as a biomarker of oxidative DNA damage in workers exposed to fine particulates. Environ Health Perspect 112(6): 666-671 17 . Nuernberg AM, Boyce PD, Cavallari JM, Fang SC,
Eisen EA & Christiani DC (2008): Urinary 8-isoprostane and 8-OHdG concentrations in boilermakers with weld-ing exposure. J Occup Environ Med 50(2): 182-189 18 . Irie M, Tamae K, Iwamoto-Tanaka N & Kasai H (2005):
Occupational and lifestyle factors and urinary 8-hy-droxydeoxyguanosine. Cancer Science 96(9): 600-606 19 . Tamae K, Kawai K, Yamasaki S et al (2009): Effect
of age, smoking and other lifestyle factors on uri-nary 7-methylguanine and 8-hydroxydeoxyguanosine 100(4): 715-721
20 . Ishikawa N, Mazur W, Toljamo T et al (2011): Ageing and long-term smoking affects KL-6 levels in the lung, induced sputum and plasma. BMC Pulmonary Medi-cine 11(1): 22
21 . Kitamura H, Terunuma N, Kurosaki S et al (2009): Cross-sectional study on respiratory effect of toner-ex-posed work in manufacturing plants, Japan: pulmonary function, blood cells, and biochemical markers. Hum Exp Toxicol 28(6-7): 331-338
22 . Terunuma N, Kurosaki S, Kitamura H et al (2009): Cross-sectional study on respiratory effect of toner ex-posure. Human & Experimental Toxicology 28(6-7): 325-330
23 . Ikegami K, Hasegawa M, Ando H et al (2016): A co-hort study of the acute and chronic respiratory effects of toner exposure among handlers: a longitudinal anal-yses from 2004 to 2013 54(5): 448-459
24 . Nakadate T (2006): A cross sectional study of the respira-tory health of workers handling printing toner dust. Oc-cupational and Environmental Medicine 63(4): 244-249 25 . Destaillats H, Maddalena RL, Singer BC, Hodgson AT &
McKone TE (2008): Indoor pollutants emitted by office equipment: A review of reported data and information needs. Atmospheric Environment 42(7): 1371-1388 26 . Expert Division of Occupational H, Ergonomics, The
Japan Society for Occupational Health The Committee for Personal Exposure Monitoring, Hashimoto H et al (2017): Guidelines for personal exposure monitoring of chemicals: Part II. J Occup Health 59(6): 471-476