Government-Sponsored Cooperative Research in Japan:
A Case Study ofthe Organization for Pharmaceutical Safety and Research (OPSR) Program
Yosuke Okada
†, Takahito Kushi
‡†Graduate School of Economics, Hitotsubashi University Office of Pharmaceutical Industry Research
‡Office of Pharmaceutical Industry Research OPIR Research Paper Series No.22
Government-Sponsored Cooperative Research in Japan:
A Case Study ofthe Organization for Pharmaceutical Safety and Research (OPSR) Program*
Abstract
On the basis of an independently conducted questionnaire survey, we examine an internal organization of the government-sponsored cooperative research of the Organization for Pharmaceutical Safety and Research (OPSR) program in Japan. We find that equity investment by OPSR is negatively correlated with the number of patent applications by the consortium. Nevertheless, the OPSR investment ratio and the ratio of dispatched researchers to total researchers at the consortium are positively associated with higher evaluation of the research results. These findings suggest that a co-investment scheme should be consistent with an ownership arrangement of patents, which may improve performance of research consortia where embryonic and generic inventions are the goals of cooperative research.
Key words: cooperative research, OPSR program, co-investment scheme, dispatched researchers, embryonic inventions, patents
JEL classification: L33, L52, O31, O32 Correspondence:
Yosuke Okada
Graduate School of Economics Hitotsubashi University
2-1 Naka, Kunitachi, Tokyo, 186-8601, Japan E-mail: [email protected]
* We are grateful to Tomofumi Anegawa, Hiroyuki Chuma, Kazuyuki Motohashi, Sadao Nagaoka, Tsuruhiko Nambu, Hiroyuki Odagiri, Yoshindo Takahashi and other seminar participants at Hitotsubashi University, the Healthcare Science Institute, and the Office of Pharmaceutical Industry Research for their helpful comments. We would also like to express our sincere thanks to Yasushi Okazaki, Junichi Ryokai, and other members of the R&D Committee of the Japan Pharmaceutical Manufacturers Association (JPMA) for their generous cooperation in conducting questionnaire surveys. Financial support from the JPMA and the 21st Century COE Program (Normative Evaluation and Social Choice in Contemporary Economic Systems) of the Ministry of Education, Culture, Sports, Science and Technology are strongly acknowledged. The views expressed herein are those of the authors and not necessarily those of the JPMA. Any errors and omissions are the sole responsibility of the authors.
1. Introduction
Should government play an active role in encouraging private R&D? Knowledge intrinsically bears a public-goods nature, and it is disseminated, to varying degrees, through mechanisms other than the market. This leads to a discrepancy between private and social rates of return on R&D, which may justify public support for private R&D (Griliches 1992, Jones and Williams 1998). However, while almost all advanced countries have implemented various policy measures to support private R&D, a solid consensus evaluation of such policy is lacking, as yet, in the literature.
This paper examines an internal organization of the government-sponsored cooperative research program of the Organization for Pharmaceutical Safety and Research (OPSR), which took place under the jurisdiction of the Ministry of Health, Labour and Welfare for the fiscal years 1987-2002 in Japan. As is shown by Aghion and Tirole (1994) among others, a variety of internal aspects of cooperative research activities, such as allocation of property rights, researchers’ employment contracts, and co-financing arrangements in research may have considerable impact on the frequency and scope of innovations. On the basis of an independently conducted questionnaire survey, we examine organizational features of the program which may affect the performance of cooperative research, looking particularly at a scheme for co-investment in equity as well as the configuration of researchers dispatched from participating firms.
Government-sponsored cooperative R&D in Japan began with the enactment of the Research Association for Mining and Manufacturing Technology Law in 1961. R&D consortia were then established with the approval of the competent minister in accordance with the law. Thereafter, numerous government ministries and agencies as well as foreign countries have implemented similar policies.1 Government-sponsored cooperative R&D in Japan initially focused on absorbing advanced technologies from Europe and the US, but since the late 1980s, in response to the growing prevalence of opinions emphasizing the importance of basic research, the cooperative R&D operations have taken up long-term, embryonic, and high-risk research. The nature of government-sponsored cooperative research programs has therefore changed significantly since the late 1980s.2 The OPSR-sponsored cooperative research program, most of which has taken place in the 1990s and later, strongly reflects this trend.
Under the OPSR program, a total of 15 research consortia (technology development firms) were established from 1988 to 2002. Of the 47 participating firms (making 75 project investments), 22 firms (making 47 project investments) were members of the Japan
1 However, the earliest example of government support of cooperative R&D was the research association (RA) in the UK. The association primarily targeted traditional small and medium-sized enterprises lacking technological capabilities. See Johnson (1971/1972). By contrast, the Japanese scheme mainly provided support to large companies. See Goto and Wakasugi (1984) and Goto (1997).
Pharmaceutical Manufacturers Association (JPMA).3 A distinctive feature of the program, therefore, was that over 60% of participating entities were pharmaceutical firms.
In terms of amount of investment in equities, the investment by OPSR of ¥27.2 billion combined with investment by private firms brought the total amount to ¥47.7 billion by the end of 2002. OPSR thereby controlled 57.1% of the equity on average. JPMA member firms invested ¥15.26 billion (32.0% of the equity on average) which means that 74% of private investment came from JPMA members, given the substantial share of the government.
We conducted a questionnaire survey in June 2003 to examine the organizational features and resulting performance of the OPSR-sponsored cooperative research program. Those surveyed included all the research project managers appointed since the inception of the program, participating JPMA member firms, and researchers dispatched from JPMA member firms. We received responses to the questionnaire survey from all 18 research project managers at the 15 research consortia and from all 21 participating firms. We also received responses from 79 of the approximately 100 dispatched researchers belonging to JPMA member firms. In preparation for the questionnaire survey, we also conducted field interviews with a total of 29 project managers and researchers participating in operations at 11 pharmaceutical firms and four research consortia (eight consortia if we include managers of four patent holding companies which succeeded the consortia). The questionnaire survey and interviews allowed collection of detailed information on the OPSR program.4
The questionnaire survey and related empirical findings using patent and R&D data demonstrate that the ratio of investment in equities by OPSR is negatively correlated with the number of patent filings by the consortium. Nevertheless, the OPSR investment ratio and the ratio of dispatched researchers to total researchers at the consortium are positively associated with higher evaluation of the research results. These findings suggest that a co-investment scheme should be consistent with an ownership arrangement of patents, which may improve performance of research consortia where embryonic and generic inventions are the goals of cooperative research.
Weak propensity to patent by the consortia may be partly due to the difficulty of securing exclusive use of research results by participating firms. Once a patent is received by a consortium, the government—controlling more than half of the equity—would most likely seek wide-ranging use of the research results. This indicates that a patent filing can be a
3 The total of participating companies was 21 at the time of the survey due to the merger of Chugai Pharmaceutical and Nippon Roche.
4 In fact, the OPSR was reorganized to establish the Pharmaceuticals and Medical Devices Agency as an independent administrative institution in April 2004. OPSR’s existing operations were transferred to the new organization. Concerning R&D promotion in the new organization, in light of the trend toward emphasizing the commercialization of new technologies, high-tech ventures are clearly targeted, and in place of the current investment and financing system, a commissioned research method in which patent rights belong to the commissioned party is being considered (commonly known as Bayh-Dole
double-edged sword in contexts where embryonic and generic inventions are the goals of cooperative research.
This paper is structured as follows. Section 2 gives an overview of policy measures to support private R&D. Section 3 provides a literature review and hypothesis formulations. Section 4 summarizes the questionnaire survey results. Section 5 describes a dataset and lays out empirical specifications. Section 6 presents estimation results. Section 7 concludes the paper.
2. Overview of Policy Measures to Support Private R&D
There are two approaches that a government can take to encourage R&D.5 The first is to promote public R&D directly through public research institutions and universities, and the second is to enhance private incentives through tax credits, subsidies, commissioned R&D, investment and financing. Hereafter, we mainly discuss the latter type of policy measures.6
2.1. Tax Credits and Subsidy
Tax credits and subsidies are widely used in Japan as well as in other countries.7 Tax credits directly reduce R&D cost, while subsidies boost private marginal returns on R&D. The qualitative difference between these measures is that tax credits allow firms to use their own discretion in selecting R&D projects, while subsidies are normally allocated for government-designated R&D projects. Moreover, subsidies are usually allocated as competitive grants that normally do not involve a commitment for future government procurement.
5 David et al. (2000) and Hall and Van Reenen (2000) give a broad survey of the empirical literature on public support for R&D. Klette et al (2000) and Jaffe (2002) concisely explain econometric methods for the evaluation of public support for private R&D. Hicks et al (2002) provide some recent information about the evaluation method adopted by the US government.
6 Public R&D is of course an important issue, but it is beyond the scope of the present study.
7 Japan’s R&D tax incentive system is called Tax Credits for Increasing Experiment and Research
Expenditures. Under this system, if a company’s R&D expenditures exceed the average amount of R&D
expenditures in the highest three of the past five years, the company receives a tax credit of 15% of the amount in excess. However, companies do not receive the benefits of tax reductions unless they increase R&D. Given the economic environment since the 1990s, few companies are consistently increasing R&D expenditures. The system was thereby relatively ineffective. Consequently, the government established a special tax credit system for the total amount of R&D in 2003. This system gives tax credits at a fixed percentage of total R&D (8%-10%, limited-time measures provide for an additional 2% for 10%-12%), and companies are able to choose either this system or the system based on increasing experiment and research expenditures. Moreover, the government also established a special tax credit system for industry-university cooperative research and commissioned research. With this system, a uniform tax credit rate of 12% (limited-time measures provide for 15%) can be applied to industry-university cooperative research and government contract research. Additionally, the technology infrastructure improvement tax system for small and medium-sized enterprises allows a uniform tax credit rate of 12% (limited-time measures provide for 15%) to be applied.
Compared to these policy tools, government-sponsored cooperative research gives a more active role to the government in selecting, revising and narrowing the focus of research fields. In this regard, government-sponsored cooperative research programs are more akin to commissioned research, as discussed below.
2.2. Commissioned R&D and Cooperative R&D
In commissioned R&D, a government agency uses public funds to procure R&D results from an outside source in order to achieve its own missions. The following three mechanisms can be identified as potential conduits for increasing private R&D (David et al. 2000).
1) Publicly supported R&D generates learning effects which enhance the ability of private firms to obtain the latest scientific and technological knowledge. (Absorptive capacity) 2) Using public funds to enable the use of experimental facilities and research facilities and
having the government assume the fixed costs for establishing specific R&D projects allows private firms to start projects with low additional costs. This increases the expected return on R&D investment. (Cost sharing)
3) Commissioned R&D signals future demand in the public sector and demand for goods and services diverted to the private sector. Accordingly, this increases the expected return on R&D investment8. (Pump-priming effect)
However, there are differences between commissioned R&D and government investment in equities when it comes to setting specific R&D targets. For commissioned R&D, targets are set mainly by the government, following policy objectives such as energy, environment, healthcare, and defense, while government-sponsored cooperative research enables participating firms to secure a certain degree of initiative, depending on the investment ratio9.
One of the important factors affecting R&D incentive is an ex ante agreement governing the ownership of innovative output. Because intellectual property rights belong to the research consortia in the OPSR program, this type of research is probably more accommodating of the government’s intention of disseminating research results widely. The government will most likely seek wide-ranging use of technologies as the return on its investment. This, however, could possibly weaken the incentive for participating firms to engage in cooperative R&D.
Accordingly, when examining the effects of public support for R&D, it is necessary to distinguish between different policy tools and consider the type of agreement governing the
8 Furthermore, Lerner (1999, 2002) argues that venture capital funds that receive public support have a
certification effect that facilitates venture capital fundraising. That is, government validation reduces
information asymmetry to enable desirable agreements.
9 In the political decision-making process, government may give subsidies to projects with a high probability of success. This appears to be the result of political pressure to demonstrate the success of government policies or the ease of lobbying activities in technological areas with a high likelihood of success. David et al (2000) and Lerner (2002) discuss this issue in detail.
ownership of intellectual properties.10 Kneller (2003) points out that uncertainty about intellectual property rights ownership has made industry-university-government cooperation and technology transfers difficult in Japan’s biotechnology sector. Hall et al (2001) indicate that similar circumstances have made industry-university-government cooperation difficult in the Advanced Technology Program in the US.
Furthermore, both commissioned R&D and publicly funded cooperative research may have the effect of reducing private R&D. For instance, in order to gain an advantage in a selection process, funds that should be directed toward another project may end up being reallocated by the firm to R&D investment in the said project. This is a so-called crowding-out effect. Moreover, commissioned R&D and government-sponsored cooperative research programs may in effect undermine the incentive to conduct R&D in certain fields, because firms may tend to avoid fields targeted by the commission or cooperative research due to the perception that their predecessors in the field already have the first mover advantages.
Additionally, as an important point not dependent upon the form of government support, in the case of inelastic supply of the inputs for R&D (especially researchers), a government support program would perhaps have a crowding-out effect on private R&D.11 In the bio-pharmaceutical industry, the supply of top-notch researchers is extremely limited in Japan, and it is not reasonable to expect that simply reflecting this fact in the form of higher wages for researchers engaged in public R&D would result in a real increase in R&D. This represents an indirect crowding-out effect.
3. Literature Survey and Hypothesis Formulations
3.1. Theoretical BackgroundThe advantages of cooperative R&D can be summarized as: (1) achieving economies of scale in R&D; (2) avoiding duplicative investment by assigning complementary research among members; and (3) preventing spillover effects resulting from diffusion and imitation due to insufficient appropriability. The industrial organization literature providing a theoretical basis for cooperative research includes Spence (1984), Katz (1986), D’Aspremont and Jacquemin (1988), Suzumura (1992), and Kamien et al (2000), among others. A common thread in the theoretical literature is that spillover effects strongly affect the social returns of cooperative
10 However, we should note that these points do not necessarily imply straightforwardly a need to strengthen patent protection. Cohen et al (2002) showed in a questionnaire-based comparative analysis of Japan and the US that most companies do not emphasize patents as an important appropriation tool. In the pharmaceutical sector, however, they show that patents are greatly emphasized as a means to secure appropriability. It is therefore necessary to give careful consideration to the industrial as well as technological characteristics.
R&D. If there are no spillover effects, it is unlikely that cooperative R&D is socially more desirable than non-cooperative R&D.
Moreover, as indicated in the literature, cooperative R&D leading to fierce product market competition ex post would have weak R&D incentives ex ante. As noted earlier, many firms participating in OPSR-sponsored cooperative research are JPMA member firms, and it is very likely that they will compete in the product market. Consequently, as discussed below, such circumstances may provide an explanation for the adoption of basic research fields that complement the drug discovery research of participating firms as research objectives for consortia.
In terms of the internal organization of cooperative research, there is a series of studies belonging to the Penrosian tradition which contends that organizational capabilities dictate the boundaries of firms.12 According to this view, firms engaging in high-cost, risky, and complicated research projects would be inclined toward cooperative research. On the other hand, transaction cost economics and the contract theory of firms maintain that the characteristics of the target technology and ease of licensing are important determinants of cooperative R&D.13 Aghion and Tirole (1994) analyze R&D management in a framework of incomplete contract theory. They examine a variety of aspects of research activities, such as allocation of property rights, researchers’ employment contracts, and co-financing arrangements in research. They convincingly argue that these characteristics have considerable impact on the frequency and scope of innovations. These studies strongly suggest that organizational features of cooperative research would affect research results.
3.2. Empirical Background
Georghiou and Roessner (2000), Hagedoorn et al (2000), and Martin and Scott (2000) conduct interdisciplinary studies of the relationship between government support and cooperative R&D from institutional and policy perspectives. Salter and Martin (2001) look at policy evaluation of public support for basic research. These studies emphasize that, in policy evaluation of publicly supported programs, sufficient consideration should be given to the long-term nature of the various forms of the benefits.
Most empirical studies on cooperative research are based on case studies: SEMATECH in the US semiconductor industry (Irwin & Klenow, 1996; Link et al, 1996); the VLSI Cooperative R&D Association in Japan (Sakakibara, 1981; Otaki, 1983); the Fifth Generation Computer Project in Japan (Odagiri et al, 1997); the Next Generation Projects such as the Exploratory Research for Advanced Technology (ERATO) in Japan (Hayashi, 2003); the Advanced
12 For examples, see Penrose (1959), Teece (1980), Teece et al (1997), Mowery et al (1998), Dosi et al (2000) and Miotti and Sachwald (2003).
Technology Program (ATP) in the US (Jaffe, 1998; Link, 1998; Hagedoorn et al. 2000; Hall et al, 2001); the Small Business Innovation Research (SBIR) in the US (Lerner, 1999; Wallsten, 2000); the Alvey Programme for Advanced Information Technology in the UK (Quintas & Guy, 1995); the Societa di Ricerca in Italy (Tripsas et al, 1995); the Office of the Chief Scientist Program (OCS) in Israel (Lach, 2002; Trajtenberg, 2002); the EUREKA and EU Framework Programmes (Benfratello & Sembenelli, 2002) and the SESI-TSER Project (Carayol, 2003) in Europe.14 These case studies, except Wallsten (2000), indicate that government support programs increase private R&D to a greater or lesser degree depending on the organizational features of consortia.
In a similar vein, there is also a large body of empirical literature on the bio-pharmaceutical industry. Recent examples include Arora and Gambardella (1990, 1994), Gompers and Lerner (1995), Narin et al. (1997), Argyre and Liebeskind (1998), Zucker et al (1998), Lerner and Merges (1998), Henderson et al (1999), McMillan et al (2000), Cockburn and Henderson (2001), Hicks et al (2001), Rothaermel (2001), Nicholson et al (2002), Owen et al (2002), and Odagiri (2003). These studies show that industry-university-government cooperation plays an extremely important role in cutting-edge research fields such as biotechnology. However, for it to be effective, careful consideration must be given to technological characteristics, legal and institutional systems, and especially the handling of patent ownership.
Concerning cooperative R&D associations receiving investment, financing, or subsidies from the Japanese government, Sakakibara (1997) and Branstetter and Sakakibara (1998, 2002) used a large data set comprised of 145 cooperative R&D associations established between 1980 and 1994. Their analyses show that government-supported cooperative R&D in Japan produces desirable social returns. Specifically, government support serves to increase private R&D or increase patent applications by participating firms in related technological fields.
There are several studies which have examined explicitly the governance of cooperative R&D. Oxley (1997) argues that barriers to the appropriation of intellectual property (appropriability hazards) result in research joint ventures that are legally distinct from participating firms. Mowery et al. (1998) examine alliances in light of technological overlap between firms, and suggest that firms that are too similar or too dissimilar gain little from alliances. Azoulay (2003) argues that the structure of the constituent firms’ internal labor markets powerfully shapes and constrains the scope of inter-organizational networks. Adams and Marcu (2004) discuss the limits of the firm in R&D and indicate that R&D sourcing has little effect on innovation, but that research joint ventures and internal research increase
14 David et al (2000) and Hall and Van Reenen (2000) provide a broad literature survey on econometric studies on this issue. Goto and Wakasugi (1984), Goto (1993), and Goto (1997) review the historical background, function, and evaluation of cooperative R&D associations in Japan.
innovation. Research joint ventures are instrumental in jointly commercializing the research of different firms.
3.3. Hypotheses Formulation
In light of the theoretical and empirical literatures, there are several hypotheses well suited for examining OPSR-sponsored cooperative research. In order to look at the social welfare effects of cooperative R&D, it is necessary to examine a variety of factors, including the number of firms engaged in R&D competition, presence of outsiders, substitutability or complementarity of R&D, technological position of firms, technology lifecycle, and governance structure of research associations. However, a comprehensive empirical specification is extremely difficult, due partly to data limitations.
We offer a hypothesis on whether the governance structure of OPSR-sponsored cooperative research has an impact on its performance. In cooperative research, research results would be shared among participants. In particular, when the ratio of government investment in equities is high, without careful contractual consideration of intellectual properties ex ante, the government would likely demand to share results widely to obtain investment returns. This leads to our first hypothesis:
Hypothesis 1: In OPSR-sponsored cooperative research, a higher level of government commitment (ratio of government investment in equities) makes it more difficult to secure exclusive use of research results by participating firms. Accordingly, the incentive to file patent applications at consortia made up of researchers dispatched from participating firms is weak.
That is, we hypothesize that a higher ratio of government investment in equities is negatively correlated with the number of patent filings by the consortia. As noted by Branstetter and Sakakibara (2002), in government-supported cooperative R&D in Japan, there tends to be an increase in the number of patent applications by participating firms in the same technological field after the end of corresponding programs. This is most likely due primarily to firms deciding to continue the research after programs end in order to secure exclusive use of subsequent research results. Our first hypothesis is consistent with their findings.15
Next, we examine the determinants of ex post evaluation of the consortia by participating firms. Because of the cumulative nature of innovation, improvement in ex post R&D
15 When directly examining the impact of cooperative research on the performance of participating firms, previous studies such as Branstetter and Sakakibara (1998, 2002) and others usually adopt the number of patents by participants as a dependent variable. However, because the research fields of the OPSR programs cover a wide range of basic and advanced research, it is extremely difficult to define the related patent classes. Accordingly, we were not able to examine the impact of cooperative research on the patent applications of investing firms in the present study.
efficiency—e.g., increasing absorptive capacity and decreasing R&D costs—would be realized dynamically. Therefore, when seeking to internalize these dynamic externalities, it is necessary to decrease contractual uncertainties through mutual commitments. In government-sponsored cooperative R&D, co-investment in equity may confirm the mutual commitment of participants. Furthermore, government investment in equities may have a certification effect, which facilitates the procurement of additional risk money as well as cooperative research with outside parties such as national research institutes and universities.16 This argument leads to the second hypothesis.
Hypothesis 2: Higher participant commitment, in terms of the ratio of government investment in equities and the ratio of researchers dispatched from participating firms to total researchers at the consortia, enhances the evaluation of the OPSR cooperative research by participating firms.
It should be noted that managers at research consortia may place more emphasis on social benefits than managers at participating firms. Thus, evaluations of respondents who are actually involved with research consortia are likely to be more positive. On the other hand, it is less likely that evaluations by managers at participating firms take these social benefits into consideration, as is shown by the survey data which are summarized in the next section. Accordingly we will focus on the evaluation by participating firms, not by managers at consortia, in Hypothesis 2.
We do not investigate the commitment process in detail, as this issue is beyond the scope of the present study. However, it is arguable that participating firms with lower commitments would not offer higher evaluations of research consortia. The second hypothesis thereby may be partly self-evident. However, considering the first and the second hypotheses together reveals an important policy implication. If both of these hypotheses hold, it would suggest that the co-investment scheme and ownership control of patents have some intertwined effects upon the performance of the OPSR program where embryonic and generic inventions are the goals of cooperative research.
4. OPSR-sponsored Cooperative Research Program
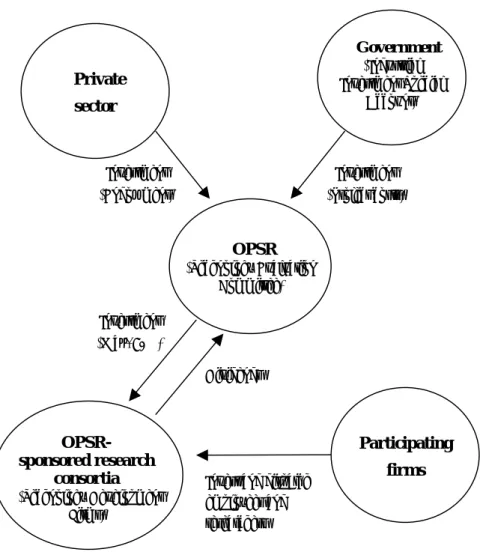
4.1. Overview of the OPSR ProgramIn the OPSR-sponsored cooperative research program, the research consortia were established by two or more companies or by a company engaged in cooperative research with universities or public research institutes. They received capital funds from the Industrial Investment Special
16 See Lerner (1999, 2002).
Account (see Figure 1) 17. The OPSR-sponsored cooperative research program was launched in 1987, and projects mainly targeted basic research. The OPSR investment was limited to at most 70% of total project costs (50% in the case of a single company). The duration of the programs was in principle limited to seven years.
In order to evaluate the consortia, the Technology Evaluation Committee was established within the OPSR, which was comprised of academic experts in bio-pharmaceutical technologies and other related fields. The committee convened at least twice a year. In the initial evaluation stage, the committee selected certain projects and modified, if necessary, research plans. During ongoing and mid-term evaluation stages, the committee was able to adjust the disbursement allocation and direction of research.
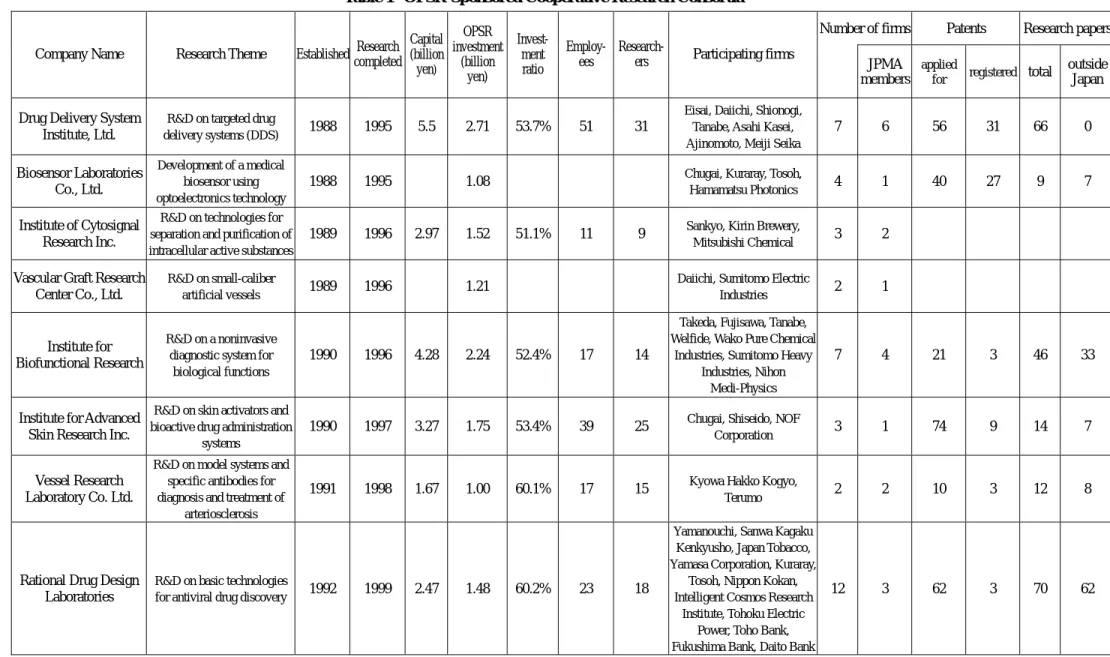
A total of 15 OPSR-sponsored research consortia were established (see Table 1). Two consortia were established each year between 1988 and 1990, one in 1991, two in 1992, and one each year between 1993 and 1998. The durations of the programs are three years for one consortium, six years for one consortium, seven years for 12 consortia (one is ongoing), and nine years for one consortium (ongoing). The number of employees averaged about 25 during peak periods, and the number of researchers averaged about 20 during peak periods. Average size of equity per project was ¥3.18 billion, with the OPSR contributing ¥1.82 billion. Thus the size of consortia was fairly large compared to biotechnology ventures in Japan.18
4.2. Summary of Questionnaire Survey Results
The questionnaire survey was comprised of three separate surveys—one each for participating firms, research consortia, and dispatched researchers. The participating firm survey solicited answers from the standpoint of an investing company, the research consortia survey from the standpoint of research management at the consortia, and the researcher survey from the standpoint of researchers dispatched from participating firms. The researcher survey (anonymous) sought answers pertaining to individually performed research. Further, the
17 The Industrial Investment Special Account was established to invest government funds in private sector entities. Sources of the funds are the Japan Bank for International Cooperation and dividends from Electric Power Development Co., Ltd., Nippon Telegraph and Telephone Corporation, Japan Tobacco Inc., and others. The account has made investments and loans to the Japan Key Technology Center (Ministry of International Trade and Industry, currently the Ministry of Economy, Trade and Industry), the National Institute of Information and Communications Technology (Ministry of Public Management, Home Affairs, Posts and Telecommunications), the National Agriculture and Bio-oriented Research Organization (Ministry of Agriculture, Forestry and Fisheries), the Japan Finance Corporation for Small Business, the Japan Development Bank (currently the Development Bank of Japan), the Japan Regional Development Corporation, and others. Historically, the Industrial Investment Special Account was established along with the abolition of the US-Japan Aid Collateral Funds Special Account in 1953, but it was after the reform in 1985 that it began actively providing investment to private sector entities engaged in basic research.
18 Odagiri et al (2002, 2003) and Okada et al (2003) examine the current situation of biotechnology ventures in Japan on the basis of field interviews and questionnaire surveys.
participating firm survey and research consortia survey were comprised of two parts— questionnaires and data enquiries.
We requested a total of 21 JPMA-member companies investing in research consortia to participate in the survey. We contacted companies involved in the JPMA’s R&D Committee through their committee representatives. Companies not involved in the committee were contacted through the committee’s contact list. We directly contacted research consortia with ongoing operations at the time of the survey, which included BF Research Institute, Dnavec Research, and Agene Research Institute (currently GeneCare Research Institute).
The survey started on June 18. We mailed survey forms and received responses through the mail in most cases. Some responses were received as electronic files via e-mail according to the wishes of the respondent. For the researcher survey, requests were made directly to companies, and responses were received either through the mail after being collected by the company or sent directly from the respondent.
For the participating firm survey, we received responses from all 21 companies. We also received responses from all 15 research consortia. Further, we received responses from 79 of the approximately 100 dispatched researchers requested. The collection of survey forms was completed on September 4. We requested revisions for any erroneous responses and gathered additional data if necessary. The collection and confirmation of all data was completed on November 20.
The dispatched researchers who responded to the survey were relatively young, with an average age of 32 when including managers, and 30.6 for researchers only. Their assignment lasted 4.3 years on average. Of the 79 dispatched researchers, 43 of them received some kind of instructions from the dispatching company during the dispatch period, while dispatched research managers more likely received instructions from the dispatching firms. Instructions mainly involved acquiring specific technologies and developing research networks. Additionally, only six of the 79 dispatched employees had previous experience with cooperative R&D.
In the tables below, unless specifically noted, average score represents the simple average of responses based on a five-point scale, with 1 signifying “very applicable,” 2 “somewhat applicable,” 3 “neutral,” 4 “not very applicable,” and 5 “not at all applicable.” The lower scores thereby indicate more affirmative responses. Standard deviations are in parentheses. The questionnaire surveys included a wide range of questions (16 questions in the participating firm survey, 34 in the research consortia survey, and 24 in the researcher survey). From these responses, we reclassify questionnaire results below in terms of the following seven categories: (1) objectives and research goals; (2) novelty and basicness of research; (3) evaluation; (4) resources; (5) advantages and disadvantages of government sponsorship; (6) advantages and disadvantages of cooperative research; and (7) outside cooperation in research. Note that in the
researcher survey, we asked researchers to evaluate the results they obtained individually rather than to evaluate the overall performance of the consortia in which they participated.
4.2.1. Objectives and Research Goals
Table 2 shows that with respect to the objectives of participating firms, a large number of responses cited “undertake projects with costs and risks too high to bear alone,” “deepen understanding of new research fields,” and “broaden external research network.” Few respondents said they participated in the project to “economize on internal R&D costs” and “license from research consortia,” and very few said they sought to “acquire earnings (dividends) from research consortia.”
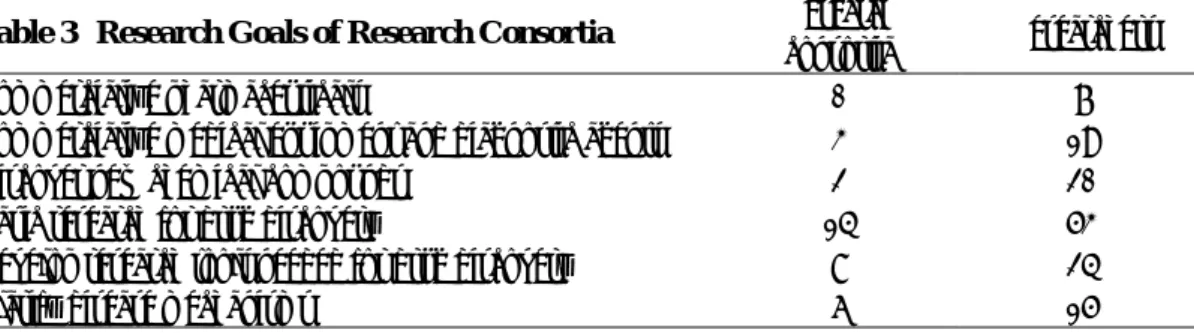
When asking about the research goals (Table 3), the largest number of responses cited “basic research for drug discovery,” followed by “develop research tools needed for drug discovery” and “clarify disease mechanisms.” Few respondents cited “commercialize pharmaceuticals,” “commercialize medical equipment and diagnostic agents,” and “discover new chemical compounds.” This suggests that the main field chosen was basic research that would complement participating firms’ R&D19.
4.2.2. Novelty and Basicness of Research
When asking about the degree of novelty and the basicness of the research, the largest number of respondents said the research was “novel both in Japan and overseas” and “basic research” (Table 4). The responses indicate that a large number of research consortia chose highly advanced research fields20.
As shown from Tables 2 to 4, the research projects analyzed in this paper are more likely to be riskier, have a generic nature, and be at such an embryonic stage that the relevant technologies are not easily appropriable by patent. Weak appropriability may be partly due to narrow patent scope of bio-technologies in Japan21.
4.2.3 Evaluation
Table 5 shows the average scores of the evaluation of the projects by the three types of respondents (investing firms, research managers, and researchers). Note that this is a four-point evaluation22. The evaluations of participating firms and researchers were relatively low, with
19 According to the questionnaire survey, the consortia were comprised of two to five distinctive research project teams (average of 3.8 teams). As a result, there was some variety in the responses of individual researchers who participated in typically only one of the research teams.
20 The relevant question in the survey is as follows.
Question 4: How novel was the research theme? Choose the most applicable answer from 1–3. 1. Research to compete in Japan 2. Novel in Japan 3. Novel both in Japan and overseas
21 See Kneller (2003) and Okada et al. (2003). 22 The relevant question in the survey is as follows.
average scores of 2.5 for participating firms and 2.4 for researchers. However, the evaluations of research project managers were slightly higher, with an average score of 2.1. Managers at the research consortia perhaps also considered the social benefits of government-sponsored cooperative research in their evaluations. Nevertheless, there were marginally no statistically significant differences among the three respondents.
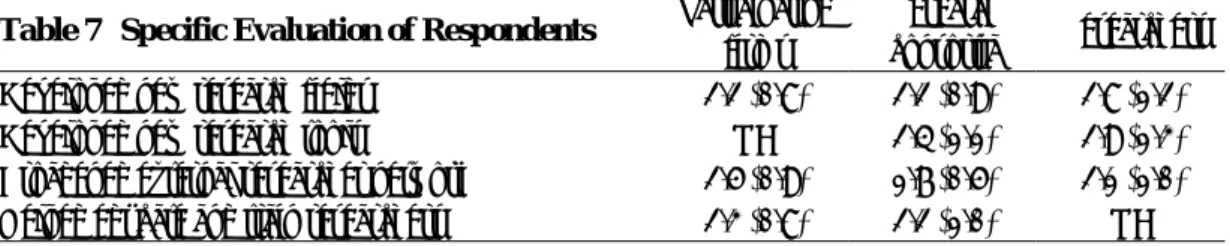
In Tables 6 and 7, we show average scores of the evaluations in more detail. Table 6 shows that the evaluations of participating firms, research consortia, and researchers were all higher for scientific and academic results than for results geared toward commercialization. This can be attributed to the low likelihood of success or the long gestation period required for commercialization because the majority of research fields are basic or highly novel.
As is shown in Tables 6 and 7, when comparing average scores by respondent, the evaluations of the project managers were relatively higher, while dispatched researchers offered rather lower evaluations.23 Specifically, relatively high evaluations were given for “developed research networks through cooperative research with outside parties.” This was followed by “developed new research fields,” “helped in educating and training dispatched and mid-career hired researchers,” and “developed new research tools.”
4.2.4. Resources
Table 8 shows the responses of research project managers at the consortia to questions about the sufficiency of human resources and research funds. Most responses indicated that the human resources and research funds were generally sufficient. The sufficiency of human resources was given relatively high marks, with average scores of 1.4–1.7 on a three-point scale. Moreover, research funds were viewed as generally sufficient, with an average score of 1.8 on a four-point scale. Therefore it is unlikely that there were critical constraints on funds or personnel. Rather, factors other than personnel and funds that led to the mundane performance of cooperative research need to be elucidated.
4.2.5. Advantages and Disadvantages of Government Sponsorship
Table 9 shows average scores for the advantages and disadvantages of government sponsorship. Advantages receiving relatively high evaluations included “facilitated cooperative research with
Question 6: Compared to your initial expectations, how does your company evaluate the performance of the research consortia you invested in (or research results of the research consortia; or research results during the time you were dispatched to the project)? Please select the appropriate number.
1. Results exceeded initial expectations 2. Results were generally in line with expectations 3. Achieved few results 4. Achieved no results
23 When following up with researchers about specific evaluations (results are not shown in the Tables), responses to the question about whether their personal research was properly evaluated had an average score of 2.6 (standard deviation of 1.0) in a four-point evaluation. When asked whether the research experience in the consortia was useful in their personal career development, responses had an average score of 2.2 (standard deviation of 1.0) in a four-point evaluation.
outside parties,” “preserved independence of administration and research,” and “enabled flexible investment.” For disadvantages, however, many of the research consortia responded that the bureaucratic “constraint of one-year budgeting” was an obstacle. This is perhaps because research consortia were required to use their budgets within the fiscal year on account of government investment even though they were organized as a private corporation24.
4.2.6. Advantages and Disadvantages of Cooperative Research
Next, we asked research managers at the consortia about the advantages and disadvantages of cooperative research. Average scores are shown in Table 10. Of particular interest was the virtual lack of obstacles to cooperative research involving the interests of participating firms and of conflicting interests among participating firms regarding the handling of research results. Given that most participants were pharmaceutical companies competing in the product market, more conflicting interests would not have been a surprise, and perhaps the lack of conflict can be attributed to the selection of extremely basic research themes or to management intended to avoid creating conflicting interests. Most responses for “pursued research that would be difficult for an independent company” were “neutral,” which suggests that the advantages of cooperative research were not sufficiently realized overall.
4.2.7. Outside Cooperation in Research
Table 11 shows responses to questions about cooperation with outside parties. Reflecting the relatively small research staffs, many respondents expressed the opinion that cooperative research with outside parties was very important. According to the questionnaire survey, 13 of the 15 research consortia conducted cooperative research with outside parties, and on average, the number of cooperative research projects with outside parties totaled 13.5. Though the details of cooperative research are not known, two of the research consortia have undertaken cooperative research on 30 or more occasions. Many respondents said they collaborated with domestic universities and public research institutes. Of the 15 research consortia, for example, 13 conducted cooperative research with universities and nine conducted cooperative research with public research institutions.
When asking whether participating firms continued with in-house research on the same theme after the end of the consortia, it was found that 21 of the 36 participating firms did follow-up research. Of these, 10 firms continue with the research. Moreover, companies that have discontinued research said they had maintained the research for an average of 3.3 years. Though more than half the firms responded that they had continued research after the end of the
24 Few individual researchers, however, responded that one-year budgeting provided an obstacle. There was also a difference concerning the response that cooperative research enabled the use of biological specimens, but as the importance of this varied depending on the research fields, it may be due to the presence of various research teams in a consortium.
program, this was mainly independent in-house-research with an average of only 2.1 researchers. Only two companies said five or more researchers had continued related research.25
We emphasize that we are aware of the limitations of the self-reported survey data that will be analyzed below. While our survey forms were pre-tested and modified by complementary field interviews, the possibility that our primary data reflect the personal attitudes of the respondents as well as objective characteristics of their research programs is still present. As such, while the present study attempts to quantify the governance structure and its effect on government-sponsored cooperative research, generalization from our findings should be made with the utmost caution.
5. Data and Empirical Specifications
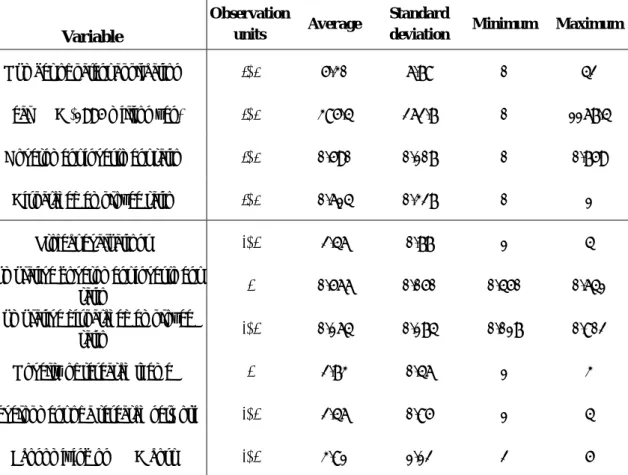
5.1. DataWe collect the data set used in the following estimates mainly from the questionnaire survey as well as from financial statements of investing firms on sales and R&D expenditures. From the questionnaire survey, we obtained data on the investing companies regarding the number of dispatched employees, research staff, and investment amount. Data on research consortia includes R&D expenditures, investments received, government investment, employees, researchers, patent applications, research papers, and others, as is summarized in Table 1. Two separate data sets were further created in terms of a distinct observation unit. The first is research consortia − year (j, t) level, and the second is participating firm − research consortia (i, j) matching sample level, where participating firm is indicated by i, research consortia by j, and fiscal year by t. We used these data sets to perform the two types of regressions explained below. Table 12 shows the summary statistics of the data sets used in regression analyses.
5.2. Patent Filings by Research Consortia
The first estimation equation looks at the relationship between the number of patent applications of government-sponsored research consortia and consortia characteristics. The estimation equation is:
] ) ( log ) ( log ) ( log [ exp 3 2 1 jt jt jt jt j jt es Time_dummi Trans_Emp Gov_Ratio R Pat
ε
β
β
β
α
+ + + + + =where Patjt is the number of patent applications by a research consortium, Rjt is research expenditures, Gov_Ratiojt is the ratio of government investment in equities, and Trans_Empjt
25 Interview surveys revealed examples of firms continuing research at the request of the OPSR, so these firms may perhaps not be continuing the research entirely on their own. Concerning the performance of follow-up research, average evaluations were 3.0 on a four-point scale, indicating that follow-up research was not likely to perform well in most cases.
represents the ratio of researchers dispatched from participating firms to the total number of researchers at a consortium j. Time_dummies are dummy variables from the year research consortia were established until the year they were disbanded. That is, a time dummy takes on a value one for all research consortia in the year of establishment and zero for other years. The time dummies from the second year were defined in the same way. This type of time dummies was used because of the tendency for the number of patent applications to increase several years after the start of cooperative research. We use a fixed-effect poisson model and a fixed-effect negative binomial model in estimation.
As discussed earlier, government investment ratios are expected to have had a negative impact on patent applications (
β
2<0). This is due to the assumption that a high ratio of government investment would make it difficult to secure exclusive use of research results by participating firms. The ratio of dispatched employees, however, is expected to have a positive coefficient. In other words, a higher commitment by participating firms is expected to increase the number of patent applications. However, as noted previously, participating firms may seek to avoid having research consortia file for a patent which would make it difficult to secure exclusive use of research results. In such a case, there is little incentive for patent applications by researchers dispatched by participating firms, andβ
3 may be negative.5.3. Project Evaluation by Investing Firms
The second estimation equation looks at the impact of the various characteristics of research consortia on project evaluation by participating firms. The estimation equation is:
. ) ( ) ( ) ( ) ( ) ( 5 4 3 2 1 ij ij ij j ij j ij g Economizin Network Newness Trans_Emp Gov_Ratio V
ε
β
β
β
β
β
+ + + + + =We use an ordered logit model in estimation. The dependent variable represents the evaluation of a consortium j by a participating firm i based on the responses to the questionnaire survey as is shown in Table 5.26 The numeric scores from the responses were used as is in the dependent variable. Therefore, if a coefficient of the explanatory variable has a negative sign, then the variable has a positive impact on its evaluation. As for the independent variables, Gov_Ratioj is the average OPSR’s investing ratio during the project period, and Trans_Empij is the average ratio of dispatched researchers from firm i to total researchers of a consortium j during the project period.
The remaining explanatory variables are from the questionnaires responses. Newnessj represents the response figure for the question about the novelty of the research theme, which was shown earlier in Table 4.27 The remaining two explanatory variables, Network
ij and
26 The relevant questionnaire form is shown in footnote 21.
Economizingij, are from the responses to the following question for participating firms in the questionnaire survey.
Question 8. Please provide more details about the results your company obtained from OPSR-sponsored cooperative research. For the following items, please choose the most applicable answer from 1–5.
(3) Did the company economize on internal R&D expenses as a result of participating in cooperative research?
(5) Did the company expand its outside research network through the research consortia?
1. Very applicable 2. Somewhat applicable
3. Neutral 4. Not very applicable 5. Not at all applicable
Economizingij is the explanatory variable representing a response score for (3), and Networkij is the variable representing a response score for (5).
These explanatory variables are used to control for the individual effect of research consortia. The degree of research novelty (Newnessj) would be affected by the technological opportunities of the project and the probability of success. On the other hand, the formation of research networks (Networkij) and reductions in R&D expenditures (Economizingij) are somewhat a focus in the previous studies. These variables are expected to reflect important motivational factors among participants as well as the characteristics of the project.28
Evaluations based on the questionnaire survey involve the subjective judgment of questionnaire respondents. Depending on the attributes of respondents, there may be some kind of systematic correlation between generalized evaluations Vij and explanatory variables, and it is possible there are biases in the estimates through correlation with the error term.29 It should be noted therefore that the latter equation is intended for roughly checking the approximate relationship between the subjective evaluation and consortia characteristics.
6. Empirical Results
6.1. Patent Equations for Research Consortia
The first equation considers the relationship between patent applications by research consortia and the commitment level of participants. Estimation results are shown in Table 13. All
applied, or developmental) as is shown in Table 4, but it did not have significant coefficients, possibly due to less variation in response scores.
28 Unfortunately, project dummies could not be used due to a small sample size.
29 The correlation between V and Newness is significant at −0.33 (p=0.02). The correlation between V and Network is 0.18 (p=0.31), and the correlation between V and Economizing is −0.20 (p=0.18). On the other hand, the correlation between Network and Economizing is 0.07 (p=0.64), the correlation between
Network and Newness is 0.02 (p=0.87), and the correlation between Economizing and Newness is 0.13
regressions are employed by using a fixed effect count data model (i.e., either a poisson or a negative binomial model). Time_dummies have a major influence on estimates and are jointly significant. The preferable results therefore are columns (2) and (4). In column (2), the real research expenditures have a significantly positive impact on the number of patent filings and elasticity is around 0.44. However, in equation (4), which uses a negative binomial model, the coefficient is slightly lower (0.32) and is still positive, but no longer statistically significant. This suggests that the government-sponsored cooperative research exhibits a relatively weak propensity to patent. This lack of a significant relationship between research expenditures and patent filings looks rather curious in terms of the patent production function literature,30 but this may have quite an interesting implication for co-investment schemes between government and private firms.
Next, in all specifications, the government investing ratio has a statistically significant negative impact on patent applications. Elasticity is high at well over 1. Why does a high government investment ratio decrease patent applications by research consortia? During our field interviews, many people pointed out that the number of patents was not an appropriate indicator of research results.
When considering the logic behind this point, for projects with a higher government investment, the ownership of research results is often subject to uncertainty, and participating firms (or researchers dispatched from investing firms) have weak incentive to file for an important patent. As noted by Branstetter and Sakakibara (2002), participating firms have perhaps increased patent applications in related technology fields following the end of a project.
Moreover, for extremely basic research themes, despite academic papers and expectations for a variety of tangible and intangible benefits over the long-term, it should be noted that such scientific and academic research results cannot be measured based solely on the number of patents. As mentioned earlier, as the research goals are extremely novel, the embryonic inventions and related scientific knowledge may not be wholly suitable for patenting.31 As is shown in Table 1, the number of scientific papers written by the researchers is virtually comparable to the number of patents.
Another possibility is that government investment ratios would have been determined endogenously through the review process of the Technology Evaluation Committee. In other words, in addition to a causal relationship of government investment ratios affecting patent applications, estimation results could also reflect an opposite causal relationship of patent
30 See Griliches (1990).
31 The relevant discussions are given by Colyvas et al. (2002). The weak propensity to patent may be due to the narrow scope of patent protection for the bio-pharmaceutical field in Japan, at least until quite recently. See Kneller (2003).
applications affecting government investment ratios. However, information gained from interviews suggests that the opposite causal chain is less likely to be at work.32
Moreover, low project performance may have caused a decline in private sector investment, and as a result, the ratio of government investment increased while patent applications decreased.33 Though this possibility cannot be disregarded, the annual investment by private firms was relatively stable during the project period, and the investing amount by participating firms is not likely to reflect the mid-term performance of the consortia.
6.3. Project Evaluation by Investing Firms
Finally, we examine the determinants of ex post evaluations by participating firms. Estimation results are shown in Table 14. All regressions are employed by using an ordered logit model. Estimation results showed that project evaluations by participating firms were high when the ratio of government investment (Gov_Ratioj) and the ratio of dispatched employees (Trans_Empij) were high. Both the government investment ratio and dispatched employee ratio were statistically significant at the 5% significance level. If we can regard these variables as proxies for commitment levels, the estimates indicate that the stronger the level of commitment, the higher the project evaluation. In particular, the government investment ratio had an especially strong impact on project evaluation.
Of course, this does not indicate that a causal relationship has been fully identified, and it should be noted that it is also reasonable to assume a causal relationship in the direction of higher government investment ratios and dispatched employee ratios for projects with high project evaluations, as mentioned before.
In the foregoing patent equations, the government investment ratio had a negative impact on patent filings. However, participating firm evaluations are higher in the case of high government investment ratios. This seemingly contradictory result suggests that patent applications by research consortia are not effective as an indicator of project evaluations.34 Further examination is needed to understand the reasons for higher participating firm evaluations in projects with high government investment ratios.35
32 The information gained through interviews and the free comment section of the questionnaire survey gave the strong impression that governance by the OPSR’s Technology Evaluation Committee did not function effectively. The intentions of the Ministry of Finance and review results of the Technology Evaluation Committee were simply conveyed as is to research consortia, and as a result, investments were not likely adjusted in a flexible manner. Moreover, OPSR representatives changed frequently at 2–3 year intervals, and many interviewees’ opinions indicated a lack of consistent policy in the review process. 33 Thanks go to Professor Sadao Nagaoka for pointing out this possibility.
34 However, the number of patent applications weighted by citations and other factors and the number of academic papers are perhaps effective as indicators of project results. Unfortunately, for the program discussed in this paper, because most patents have yet to be registered, an analysis using citation information was not possible.
35 One possibility is that there is a difference between the marginal effects and average effects of government investment ratios.
The degree of research novelty (Newness) was associated with higher project evaluations at the 1% significance level. In other words, higher research novelty led to higher participating firm evaluations of research consortia. Higher research novelty perhaps meant that project results were more varied, or that projects selecting ambitious research themes strengthened the motivation of researchers and the commitment of participating firms.
In projects with high evaluations for developed research networks (i.e., where the coefficient of Network was low), the overall evaluation of participating firms was low (i.e., the explained variable V was high). This suggests that the development of research networks is low on the list of priorities as an evaluation point. Though the development of research networks is an important evaluation point in the literature on industry-university-government cooperation,36 it appears that participating firms did not use OPSR-sponsored cooperative research for this purpose explicitly. Further, the evaluation point of economizing on R&D expenditures had a negative correlation with overall project evaluations. This suggests that, for participating firms making evaluations based on cost economizing, overall evaluations of projects themselves would not be high. Unfortunately, however, both Network and Economizing were not statistically significant in almost all cases.
7. Concluding Remarks
There are two major findings in this paper. First, government investment ratios had a negative impact on patent applications by government-sponsored research consortia. In projects with high government investment ratios, the ownership of research results is often subject to uncertainty, and in such projects, it appears that participating firms (or researchers dispatched from participating firms) have weak incentive to file for patents, and that as a result, patent applications in OPSR-sponsored cooperative research were not likely an effective project evaluation indicator.
Second, government investment ratios and the ratio of dispatched researchers to total researchers at the consortia had a positive impact on overall project evaluations. This means a higher level of commitment by the government and participating firm(s) to cooperative research led to higher project evaluations by participants. Moreover, highly novel research themes tended to result in higher project evaluations by participating firms.
It should be noted that all of the results from the qualitative analyses of survey data and regression analyses presented and discussed in the previous sections should be interpreted cautiously. First, survey data are subject to various types of self-reporting biases. Second, our analytical tools are not sufficiently sophisticated to make conclusions about directions of
36 See David et al (1999).
causality. More research will certainly need to be done on the role of governance structure in research association.
As is shown in the literature, the role of the public sector is especially important in the bio-pharmaceutical sector. The bio-pharmaceutical sector is a so-called “science-based industry,” and it is characterized by the high level of importance of basic research at universities and public research institutions.37 However, there are many steps before basic academic research leads to commercialization, and it is increasingly difficult for a single company to provide all the related technology and knowledge. Hence the bio-pharmaceutical industry combines an assortment of licensing, mergers, vertical integration, cooperative R&D, alliances, outsourcing, and other activities that extends beyond the boundary of firms.
Cooperative R&D can take a wide variety of forms depending on the project area, organization, participants, and other factors. Accordingly, there is no single answer with respect to methods of public support for R&D and its evaluation. Cooperative research is a means rather than an end. Consequently, policy measures must be designed with sufficient attention to the characteristics of each project, on a case-by-case basis.
The following discussion looks at the policy implications derived from the present study, which suggests a number of questions for further research. First, as offered by the theoretical literature, in order to increase incentives for cooperative R&D, the clear ownership control of research results would be required in advance. The situation in which patents are not part of project evaluation criteria may not be desirable for industry-university-government cooperation in embryonic biopharmaceutical research.38
Second, in the case of the government providing investment and subsidies for advanced cooperative research, because extremely specialized and focused research are targeted, it is necessary to choose research that is most appropriate for subsidization and to provide flexible mechanisms to reallocate funds based on mid-term reviews. In this regard, third party evaluations (peer review) should play an important role. Interviews and the questionnaire survey did not find evidence that the Technology Evaluation Committee of the OPSR programs played a role in flexible reallocation of resources. In highly advanced research areas, it is rare for the desired goals to be achieved according to plan, and it is common for research goals to undergo significant changes and revisions during the course of research. Accordingly, it is necessary to enable the flexible reallocation of funds when conducting a review of research. When
37 See Goto and Odagiri (2003).
38 See Kneller (2003). On this point, Bayh-Dole commissioning in which research results (intellectual property rights) of commissioned research belong to the commissioned party appears to merit reconsideration. Colyvas et al. (2002, p.66) pointed out, however, that intellectual property rights and exclusivity appear to be more important for inducing firms to develop embryonic inventions, though the dangers of strong exclusivity are also great for this type of inventions.
performing this type of adjustment effectively, good communication between government officials and R&D managers is essential.39
Third, it is arguable that public support in which the majority of funds are allocated unevenly to a few preeminent companies and researchers is not desirable. In what is often called the Matthew effect, concentrating subsidies on a few preeminent companies and researchers is common in most public support programs. However, this can be problematic in terms of efficient allocation of research funds.40 For public support to stimulate private R&D effectively, public funds should be allocated to the parties with severe financial constraints. It is necessary to devise mechanisms to distribute research funds to fledgling ventures and researchers with highly promising ideas but little research funding.41
Fourth, in terms of commercializing research results, in addition to the relative merits of the research results, a skilled management team, clear management strategy, and presence of a mediator to effectively collect risk money all have a significant influence on a project’s performance. Accordingly, as the research target approaches applied and developmental research, this type of support program for management becomes important. On this point, examinations of the Small Business Innovation Research Program in the US as well as the structure of venture capital markets would be beneficial.42
Finally, this paper focused on marginal effects over a relatively short timeframe. However, emphasis could also appropriately be placed on subsidizing research programs that the private sector is unable to take on due to high risk despite expectations for socially desirable long-term effects. That is, when evaluating public support for R&D, it is necessary to employ multi-perspective evaluation criteria that assess both short-term and long-term perspectives. Short-term evaluation would provide useful information when adjusting marginal fund allocations, but is not adequate for long-term policy evaluation. Unfortunately, however, many problems remain with policy evaluation methods that factor in long-term effects.
39 This is also pointed out by Lerner (2002). Lerner further indicates a need when selecting subsidy targets to conduct an examination of the candidate’s prior subsidy history and performance.
40 See Dasgupta and David (1994) and David et al (1999). 41 Jaffe (2002) emphasizes this point.
42 See the literature review in Section 2. In addition, Gompers and Lerner (1999) provide an excellent study of US venture capital markets.
References
Aghion, P. and J. Tirole (1994) “The Management of Innovation,” Quarterly Journal of Economics 109, 1185-1209.
Argyres, N. S. and J. P. Liebeskind (1998) “Privatizing the Intellectual Commons: Universities and the Commercialization of Biotechnology,” Journal of Economic Behavior & Organization 35, 427-454.
Arora, A. and A. Gambardella (1990) “Complementarity and External Linkages: The Strategies of the Large Firms in Biotechnology,” Journal of Industrial Economics 38, 361-379.
Arora, A. and A. Gambardella (1994) “Evaluating Technology Information and Utilizing it: Scientific Knowledge, Technological Capability, and External Linkages in Biotechnology,” Journal of Economic Behavior and Organization 24, 91-114.
Azoulay, P. (2003) “Agents and Embeddedness,” NBER Working Paper, no.10142.
Benfratello, L. and A. Sembenelli (2002) “Research Joint Ventures and Firm Level Performance,” Research Policy 31(4), 493-507.
Branstetter, L. and M. Sakakibara (2002) “When Do Research Consortia Work Well and Why? Evidence from Japanese Panel Data,” American Economic Review 92, 143-159.
Branstetter, L. and M. Sakakibara (1998) “Japanese Research Consortia: A Microeconometric Analysis of Industrial Policy,” Journal of Industrial Economics 46, 207-233.
Carayol, N. (2003) “Objectives, Agreements and Matching in Science–industry Collaborations: Reassembling the Pieces of the Puzzle,” Research Policy 32, 887-908.
Cockburn, I. and R. M. Henderson (2001) “Publicly Funded Science and the Productivity of the Pharmaceutical Industry,” in A. B. Jaffe, J. Lerner, and S. Stern eds., Innovation Policy and the Economy, MIT Press, 1-34.
Cohen, W. M., A. Goto, A. Nagata, R. R. Nelson, and J. P. Walsh (2002) “R&D Spillovers, Patents and the Incentive to Innovate in Japan and the United States,” Research Policy 31, 1349-1367.