spectrum in a γ+C reaction
著者
Matsumura Yuji
学位授与機関
Tohoku University
Direct measurement of the in-medium
𝜂
′
mass spectrum in a 𝛾 +C reaction
(𝛾 +C 反応を用いた核媒質中での
𝜂
′
質量スペクトルの直接測定)
松村 裕二
令和2年
The hadron mass is considered to be generated by the spontaneous breaking of chiral symmetry in quantum chromodynamics (QCD) vacuum. The chiral symmetry is expected to be restored under the condition such as high temperatures or high densities. Therefore, possible modification of hadron properties under the condition has been explored both theoretically and experimentally. A nucleus has often been used as a laboratory for the high-density environment. Thus, some experiments have been carried out to measure the mass or decay width of hadrons, especially for mesons, in a nucleus. However, the results are controversial. Therefore, more experimental data are mandatory to obtain reliable information about the meson properties in a nucleus.
The property of the η′ meson, which is one of the ground states of pseudoscalar
mesons in flavor SU(3), in a nucleus is a crucial research subject that has attracted a
great deal of attention to date. The η′ meson has larger mass than other pseudoscalar
mesons due to the axial U(1) anomaly effect. The anomaly effect is expected to have close relation with the degree of chiral symmetry. Thus, various theoretical models
have predicted significant decreasing of η′ mass in nuclear medium due to partial
restoration of chiral symmetry in a nucleus.
In this thesis, the mass spectrum of η′ mesons in nuclear medium is studied in
a γ+C reaction via the η′ → γγ decay mode with an electro-magnetic calorimeter.
This is the first direct measurement of the in-medium η′ mass spectrum.
The experiment was carried out at the SPring-8/LEPS2 beamline. Hadrons,
in-cluding η′ mesons, are produced in a γ+C reaction with incident photon beam energies
up to 2.4 GeV. Decay products, mainly photons, from photoproduced hadrons are de-tected by an electro-magnetic calorimeter (BGOegg). BGOegg consists of 1320 BGO crystals covering polar angles from 24 to 144 degrees and the whole azimuthal angles. Neutral or charged particles are distinguished by using inner scintillator hodoscopes installed inside BGOegg.
Mesons decaying into photons are identified in the invariant mass spectrum recon-structed from energies and hit positions at BGOegg. The energy calibration process
was carried out using π0 mass information in the γγ invariant mass distribution.
Fi-nally, the η′ mass resolution is achieved to be 20.7 MeV/c2 in the γγ invariant mass
spectrum, and the independence of the reconstructed mass on the total energies and the emission angles of produced mesons was confirmed.
such as π0π0 and π0η, is a major background for the measurement. Their relative
contribution was determined by fitting the simulated spectra of these processes to the real data. It has been confirmed that a simple and smooth function with a few
parameters well describes the multi-meson background spectrum around the η′ mass.
The event sample was divided into two ranges of γγ momenta below and above 1 GeV/c. The high-momentum sample is used as a reference without in-medium
sig-nals because most of η′ mesons are expected to decay outside a carbon nucleus due
to a long decay length. η′ photoproduction events from a proton target, which were
collected in a different experimental period, were also analyzed as another reference.
An enhancement in the low-mass region of the η′ mass was obtained with the
sta-tistical significance of over 3σ in the low-momentum sample (Pη′ ≤ 1 GeV/c) of the
carbon target data.
The significance of the enhancement was also evaluated by comparing the χ2 values
of fits with and without modeled in-medium signal functions. The signal distribution
of the in-medium η′ decay was generated by a MC simulation, where two
parame-ters corresponding to mass reduction and width broadening in nuclear media were introduced. The significance of signals was scanned in the two-parameter space of in-medium mass and width modification. Relatively higher significance was observed for the low-momentum sample of the carbon target, while there was no significance appeared for the high-momentum sample in the carbon target data and the overall-momentum sample in the proton target data. The maximum significance reaches
3.7σ for the parameter corresponding to the mass reduction of ∆m = 57 MeV/c2.
The favored region of mass reduction was determined as an area within 1σ from the maximum value of significance. On the other hand, there was no significant differ-ence among width parameters of ∆Γ < 100 MeV. The result indicates the possible
modification of η′ mass spectrum in the nuclear medium.
1.2 Chiral symmetry and meson masses . . . 3
1.2.1 SU(3)L×SU(3)R chiral symmetry . . . . 3
1.2.2 Spontaneous breaking of chiral symmetry . . . 4
1.2.3 Restoration of chiral symmetry in nuclear medium . . . 5
1.2.4 η′ meson and the axial U(1) anomaly . . . 6
1.3 Theoretical models on the η′ mass in nuclei . . . 7
1.3.1 NJL model . . . 7
1.3.2 Linear sigma model . . . 7
1.3.3 QMC model . . . 8
1.4 Experimental studies on the η′ mass in nuclei . . . 9
1.5 Direct measurment of in-medium meson mass spectra . . . 10
2 Experiment 15 2.1 SPring-8/LEPS2 facility . . . 15
2.1.1 LEPS2 beamline . . . 15
2.1.2 Backward Compton scattering . . . 17
2.1.3 Tagging counter . . . 19
2.1.4 Target . . . 20
2.2 Detectors . . . 20
2.2.1 BGOegg calorimeter . . . 21
2.2.2 Inner plastic scintillator hodoscopes . . . 23 I
2.2.3 UpVeto counter . . . 23
2.3 Trigger logic . . . 24
2.4 Data collection . . . 25
3 Calibration 27 3.1 Fundamental calibration for BGOegg . . . 27
3.1.1 Energy reconstruction and clustering . . . 27
3.1.2 Energy leakage of a cluster . . . 29
3.1.3 Energy calibration of BGOegg . . . 30
3.1.4 Timing calibration of BGOegg . . . 34
3.2 Additional correction of cluster energy . . . 35
3.2.1 Problems of obtained gain factors . . . 35
3.2.2 Correction of cluster energy for the forward layers . . . 41
4 Event selection for η′ analysis 49 4.1 Fundamental event selection . . . 49
4.2 Background reduction criteria . . . 53
4.2.1 Cluster radius . . . 53
4.2.2 Cluster shape . . . 58
4.3 Final η′ → γγ spectrum . . . 59
5 Line shape analysis 63 5.1 Outline of the line shape analysis . . . 63
5.2 Simulation for background events . . . 64
5.2.1 Energy-dependent beam shape . . . 65
5.2.2 Mass resolution . . . 65
5.3 Mass spectra of background processes . . . 67
5.3.1 Quasi-free η′ peak . . . 67
5.3.2 Background from ω mesons . . . . 68
5.3.3 Multi-meson background . . . 68
5.3.4 Unphysical background . . . 75
5.4 Fit to the γγ invariant mass spectrum . . . . 80
5.4.1 Momentum cut of the samples for the line shape analysis . . . 83
5.4.2 Fit results of the γγ invariant mass spectra . . . . 84 II
6.1.2 Fit results including in-medium modification signals . . . 108
6.2 Systematic studies . . . 113
6.2.1 Analysis for the proton target data . . . 113
6.2.2 χ2 difference test with another signal function . . . 113
6.2.3 Other systematic studies . . . 117
6.3 Further discussions . . . 117
7 Conclusions 129
A Examination of γγ spectra in other conditions 133
B Mass resolution of π0 and η 141
The hadron mass is considered to be generated by the spontaneous breaking of chiral symmetry in quantum chromodynamics (QCD) vacuum. Recently possible modifica-tion of hadron properties due to restoramodifica-tion of chiral symmetry at high temperatures
or finite densities has been discussed actively. The η′ meson, which is one of the
ground states of pseudoscalar mesons in flavour SU(3), in nuclear medium have been a crucial research subject that has attracted a great deal of attention because of its unique properties. In this chapter, an introduction of light pseudoscalar mesons and
chiral symmetry, fundamental properties of the η′ meson, and examples of theoretical
and experimental studies of the η′ meson in nuclear medium are described.
1.1
Light pseudoscalar mesons
In the constituent quark model, mesons are composed of a quark and anti-quark pair
qq. It is known that the strong interaction has approximate symmetry under rotation
of the triplet of the lightest three quarks (u, d, s), called the flavour SU(3) symmetry. Then the qq state can be grouped by the SU(3) multiplet representations. The nine
qq states can be decomposed into the SU(3) irreducible representations:
3⊗ 3 = 1 ⊕ 8 (1.1)
The singlet state is written by
|singleti = √1
3(|uui + |ddi + |ssi), (1.2) and the octet states are generated by eight independent bases. The ground states of
mesons are characterized by their quantum numbers; I3, the z component of isospin
I, and the hypercharge Y . Figure 1.1 shows the ground states of mesons. Their
spin-parity is JP = 0−. The three states π0, η8, and η0 are at the origin of the I3-Y
plane. The π0 meson is the isovector (I = 1) state written as
|π0i = √1
2(|uui − |ddi). (1.3)
The isoscalar (I = 0) states η8and η0belong to the octet and singlet representation
of the flavour SU(3), respectively. Their quark components are written as follows:
|η8i =
1
√
6(|uui + |ddi − 2|ssi), (1.4)
|η0i =
1
√
3(|uui + |ddi + |ssi). (1.5)
The isoscalar components |η8i and |η0i are mixing to form the mass eigenstates
|ηi and |η′i:
|ηi = cos θ|η8i − sin θ|η0i, (1.6) |η′i = sin θ|η0i + cos θ|η0i, (1.7)
where θ is the mixing angle of η8 and η0. The empirical value of θ is in the range
−11.5◦–−24.6◦ [1–3]. Since θ is relatively small, we can assume that |ηi ≈ |η
8i and |η′i ≈ |η
0i. The masses of η and η′ mesons are 547.9 MeV/c2 and 957.8 MeV/c2,
Figure 1.1: The light pseudoscalar mesons composed of u, d, s quarks.
1.2
Chiral symmetry and meson masses
1.2.1
SU(3)L×SU(3)R chiral symmetry
The quantum chromodynamics(QCD) Lagrangian density for three flavours (u, d, s) is written as LQCD = ψ (iγµDµ − M) ψ − 1 4G a µνG aµν, (1.8)
where ψ, γµ, M , and Gaµν are the quark field, gamma matrices, quark mass matrices,
and the strengths of the gluon field, respectively. The quark field ψ can be divided
into the left-handed (ψL) and the right-handed (ψR) fields as follows:
ψ = ( 1− γ5 2 + 1 + γ5 2 ) ψ = ψL + ψR. (1.9)
The chiral transformation is defined as an independent rotation for the left and right-handed quark fields. That is, the SU(3)L×SU(3)R chiral transformation is defined by
ψL 7→ exp (iθLaT
a) ψ
L, (1.10)
ψR 7→ exp (iθRaTa) ψR, (1.11)
where Ta(a=1,2,...,8) are the generators of the special unitary group SU(3). The QCD
Lagrangian (1.8) has symmetry under the SU(3)L×SU(3)R chiral transformation in
the massless limit, M → 0. Since the current quark masses are small compared with
the QCD energy scale, we can assume approximate chiral symmetry for the QCD Lagrangian.
1.2.2
Spontaneous breaking of chiral symmetry
Using the equation (1.9), the chiral transformation (1.10) and (1.11) can be rewritten as the transformation for the quark field ψ:
ψ 7→ exp (iθaVTa) ψ, (1.12)
ψ 7→ exp (iθaAγ5Ta) ψ. (1.13)
The transformation (1.12) and (1.13) are called the vector and axial-vector
trans-formation, respectively. In the chiral limit (M → 0), the QCD Lagrangian (1.8) is
invariant under the vector and axial-vector transformation, individually. From the
Noether theorem, these transformations lead to conserved currents, jVaµ and jAaµ, and
conserved charges, QaV and QaA:
jVaµ = ψγµTaψ, (1.14) jAaµ = ψγµγ5Taψ, (1.15) QaV = ∫ d3xjVa0, (1.16) QaA = ∫ d3xjAa0. (1.17)
In this case, the symmetry is called to be spontaneously broken. From the Nambu-Goldstone theorem, massless particles called Nambu-Nambu-Goldstone (NG) bosons appear when a global symmetry is spontaneously broken [5]. Thus, eight pseudoscalar NG bosons should exist corresponding to the generators of SU(3)A axial-vector
transfor-mation, QaA(a=1,2,...,8). These NG bosons are physically identified with the octet
mesons, π, K, and η. Note that the octet mesons are not strictly massless because the quarks actually have masses.
When the chiral symmetry is spontaneously broken, the expectation value of the
field operator ψψ for the vacuum,h0|ψψ|0i, has a non-zero value. The h0|ψψ|0i value,
called the quark condensate, is used as an order parameter of the chiral symmetry breaking [6]. The quark condensate leads to a dynamical quark mass of the order
of 300 MeV/c2, and explains the nucleon masses of the order of 1 GeV/c2 in the
constituent quark model [7].
1.2.3
Restoration of chiral symmetry in nuclear medium
Theoretical studies suggested that quark condensate decreases at high temperatures or high baryon densities, and thus the chiral symmetry is expected to restore in such environment [8, 9]. Therefore, possible changes of hadron masses under such environment have been studied both theoretically and experimentally. The nuclear medium has often been used as a high-density environment [6]. The quark condensate
is estimated to decrease by 37% at normal nuclear density ρ0 = 0.17 fm−3 [10]. Some
experiments have been performed to investigate mass modification of hadrons, such as mesons, in nuclear medium by generating them inside a nucleus [11–18].
In this thesis, mass modification of a light pseudoscalar meson, η′, in nuclear
medium is studied. The properties and characteristics of an η′ meson are described
1.2.4
η
′meson and the axial U(1) anomaly
The singlet meson, η′(≈ η0), has particularly larger mass compared to the octet
mesons as shown in Table. 1.1. The η′ meson is associated with the axial U(1)
sym-metry. Unlike the octet mesons, it is not a NG boson. It is known that the axial-vector
current corresponding to the axial U(1) transformation, jA0µ, is not conserved [19]:
jA0µ = ψγµγ5ψ, (1.19) ∂µjA0µ = 2iψγ5M ψ + 1 16π2ϵ µνλσGa µνG a λσ. (1.20)
Due to the second term of (1.20), the divergence of the axial-vector current does
not vanish in the massless limit (M → 0). This is called the axial U(1) anomaly. This
means that the axial U(1) symmetry is explicitly broken, and thus the η′ meson is
not as light as NG bosons.
The anomaly effect to the η′ mass can appear only if the chiral symmetry is
broken [20]. It is predicted by various models that η′ mass significantly decreases in
nuclear medium along with the partial restoration of chiral symmetry. In this regard,
the η′ meson can be a good probe to investigate the role that chiral symmetry and
the axial U(1) anomaly play in the mass generation. In the next section, examples of
theoretical models and experimental studies associated with the η′ mass modification
in nuclear medium are introduced.
Table 1.1: Mass of psuedoscalar mesons [1].
meson mass(MeV/c2) π0 134.98 π± 139.57 K0 497.61 K± 493.66 η 547.86 η′ 957.78
1.3.1
NJL model
Nagahiro et al. calculated η′ mass modification based on the Nambu-Jona-Lasinio
(NJL) model [7, 21, 22]. They used the following Lagrangian density:
L = L0+L4+L6, (1.21) L0 = ψ(i∂µγµ − M)ψ, (1.22) L4 = gS 2 ∑ a [ (ψλaψ)2+ (ψλaiγ5ψ)2 ] , (1.23) L6 = gD { det[ψi(1− γ5)ψj ] + h.c.}. (1.24)
The interaction term including 4-fermion interaction, L4, is invariant under
chi-ral U(3)L×U(3)R transformation. This term causes spontaneous breaking of chichi-ral symmetry, and then the quark condensate and the constituent quark mass are self-consistently determined from the gap equation. Since the quark condensate has a relation with the baryon density as described in Sec. 1.2.3, the density dependence
of η′ mass is obtained by this calculation. The Kobayashi-Maskawa-’t Hooft
inter-action term [23, 24] L6 breaks the axial U(1) symmetry, namely, represents the axial
U(1) anomaly. The coupling constant gD represents the strength of the anomaly
effect. They calculated meson mass spectra at finite density in three cases of the
den-sity dependence of gD: (a)gD(ρ) = gD, (b)gD(ρ) = 0, (c)gD(ρ) = gDexp[−(ρ/ρ0)2].
Note that the case (b) corresponds to the calculation with no anomaly effect.
Fig-ure 1.2 shows their results. They predicted a large reduction of η′ mass, ∆mη′ ∼
−150 MeV/c2, at the normal nuclear density ρ
0 in the case that gD was assumed to
be constant.
1.3.2
Linear sigma model
Sakai et. al. reported a prediction based on the linear sigma model [25]. The La-grangian of the linear sigma model is written by the hadron fields as the fundamental
Figure 1.2: The density dependence of meson mass spectra calculated with the NJL
model [22]. The density dependences of the anomaly parameter gD are assumed as
follows: (a)gD(ρ) = gD, (b)gD(ρ) = 0, (c)gD(ρ) = gDexp[−(ρ/ρ0)2]
.
degree of freedom and constructed to possess the same global symmetry as QCD [26]. The spontaneous breaking of chiral symmetry is described with the σ condensate as an order parameter instead of the quark condensate. They also used the term cor-responding to the Kobayashi-Maskawa-’t Hooft interaction, which breaks the axial U(1) symmetry. They did not include the density dependence of the strength of the
anomaly effect. Figure 1.3 shows their results. They evaluated the η′ mass reduction
at the normal nuclear density ∆mη′ ∼ −80 MeV/c2.
1.3.3
QMC model
An evaluation using the quark-meson-coupling (QMC) model was given by Bass et. al. [27]. The QMC model is described explicitly based on quark degrees of freedom [28].
They evaluated the mass of η and η′ mesons in nuclear matter for a given η-η′ mixing
angle. They suggested an η′ mass reduction of ∆mη′ ∼40–80 MeV/c2 in the ranges
Figure 1.3: The density dependence of meson mass spectra calculated with the linear
sigma model [25]. The normal nuclear density is ρ0 = 0.17 fm−3.
1.4
Experimental studies on the η
0mass in nuclei
One of the experimental approaches to investigate the η′ mass modification in nuclear
medium is to measure the η′-nucleus optical potential, which can be written as
Uη′(r) = V (r) + iW (r), (1.25)
where V and W are real and imaginary part of the optical potential, respectively,
and r is the distance between the meson and the center of the nucleus. The η′ mass
reduction at the normal nuclear density ρ0, ∆mη′(ρ0) is associated with the real part
of the optical potential [22, 29] as
V (r) = ∆mη′(ρ0) ρ(r)
ρ0
. (1.26)
Also, the imaginary part of the optical potential is related to the meson absorption
in nuclear medium, and related to the im-medium η′ width Γη′ as
W (r) =−1
2Γη′
ρ(r) ρ0
The CBELSA/TAPS collaboration evaluated the depth of the η′-nucleus optical
potential in photon induced reactions on 12C nucleus [30]. They measured the
excita-tion funcexcita-tion and momentum distribuexcita-tion of η′ mesons, and compared the data with
theoretical model calculations in different V (ρ0) cases. Their analysis indicated an
attractive potential of −(37 ± 10(stat.) ± 10(syst.)) MeV depth at the normal nuclear
density. This value corresponds to the mass reduction at the normal nuclear density, as can be seen from Eq. (1.26).
Another experimental approach is to search for η′-nucleus bound states. If the
absorption is small compared with the depth of the η′-nucleus potential, η′-nucleus
bound states could be formed [29, 31, 32]. The η-PRiME/Super-FRS collaboration
measured the missing mass spectrum near the η′ emission threshold in 12C(p, d)
reactions aiming to search for narrow peaks of η′-nucleus bound states on the
spec-trum [33]. No distinct structure was observed indicating the formation of η′-nucleus
bound states in their analysis. They claimed that a large mass reduction of ∆mη′ ∼
−150 MeV/c2 as predicted by the NJL model was disfavored although the
deter-mined upper limit of the optical potential has large ambiguity depending on the theoretical calculation of formation cross sections for the bound states. Furthermore, the LEPS2/BGOegg collaboration recently reported the analysis results of search for
η′-nucleus bound states in the missing mass spectroscopy of 12C(γ, p) reaction [34].
They tagged the η′N → ηN process as a possible decay process from η′-nucleus bound
states in order to reduce background events coming from multi-meson productions.
No signal events indicating the formation of η′-nucleus bound states were observed
after kinematical selections. They obtained the experimental upper limit of the sig-nal cross section, and compared with the theoretical calculation as shown in Fig. 1.4.
From their results, the deep η′-nucleus optical potential corresponding to a large mass
reduction of ∆mη′ ∼ −100MeV/c2 is unfavored under the large branching ratio of
the η′N → ηN decay process.
1.5
Direct measurment of in-medium meson mass
spectra
Although there have been some experimental studies investigating the η′-nucleus
Figure 1.4: The experimental upper limit of the signal cross section compared with theoretical calculations [34].
of in-medium η′ mass modification. The most straightforward way to measure the
meson mass is to reconstruct the invariant mass of its decay products. However, there
have been no experiments measuring directly the mass spectrum of η′ mesons
decay-ing in nuclei. In this thesis, the mass spectra of η′ mesons in nuclear medium are
investigated in a γ+C reaction via the η′ → γγ decay mode with an electro-magnetic
calorimeter. This is the first direct measurement of in-medium η′ mass spectra.
We performed a line shape analysis, in which the spectral shape of the invariant
mass reconstructed from the decay products of η′ mesons is examined. The
funda-mental method of line shape analysis is based on the analysis of ϕ → e+e− spectra
reported by KEK-PS E325 collaboration [15]. They measured invariant mass spectra
of e+e− pairs in p + A reactions aiming to detect possible in-medium modifications
of the ϕ meson, which had also been predicted by theoretical models [9, 35]. They observed a significant excess on the low-mass side of the ϕ meson peak in the slow (βγ < 1.25) region, as shown in Fig. 1.5. They claimed that the observation was consistent with the picture of possible in-medium modifications of the ϕ meson by
mϕ(ρ) = mϕ(0) ( 1− k1 ρ ρ0 ) , (1.28) Γtot ϕ(ρ) = Γ tot ϕ(0) ( 1 + k2 ρ ρ0 ) , (1.29) Γeeϕ (ρ) = Γeeϕ (0) ( 1 + k3 ρ ρ0 ) , (1.30)
where mϕ(ρ), Γtotϕ(ρ), and Γeeϕ (ρ) are the mass, total and partial decay width of ϕ
mesons at the density ρ. We adopt the same parametrization as Eq. (1.28)–(1.30) to discuss in-medium modification of meson mass spectra in Chapter 6.
The η′ mass spectrum is studied via the η′ → γγ decay mode. Since only photons
are emitted by the decay, there is no final state interaction of the decay products and no energy loss by bremsstrahlung. These features simplify the measurement and the analysis.
Figure 1.5: The obtained e+e− invariant mass spectra by the KEK-PS E325 collab-oration with the fit results [15].
The meson-photoproduction experiment was carried out at the SPring-8/LEPS2 beam-line using a tagged photon beam with energies up to 2.4 GeV. The experimental setup and the detectors used for this analysis are described in this chapter.
2.1
SPring-8/LEPS2 facility
2.1.1
LEPS2 beamline
SPring-8 is a synchrotron radiation (SR) facility located in Hyogo Prefecture in Japan.
There are 62 beamlines shown in Fig. 2.1 [36]. The LEPS2 beamline is located
at BL31LEP, which is one of the 30 m long straight sections in the storage ring. Figure 2.2 shows a schematic view of the LEPS2 beamline. The photon beam is produced by backward Compton scattering with ultraviolet laser photons injected onto the 8 GeV electrons circulating in the storage ring [37]. The photon beam is introduced to the experimental building located outside of the storage ring building. The recoil electrons are detected by the tagging counter to measure the energies of produced photons.
Figure 2.1: The beamline map of the SPring-8 facility [36]. The LEPS2 beamline is located at BL31LEP.
Figure 2.2: The schematic view of the LEPS2 beamline..
2.1.2
Backward Compton scattering
The principle of generating a photon beam by backward Compton scattering (BCS)
is described in this section. When a laser photon with momentum ⃗Pi and an electron
with momentum ⃗Pe collides head-on, the four-momentum conservation gives
| ⃗Pi| + √ | ⃗Pe|2+ m2e = | ⃗Pf| + √ | ⃗P′ e|2+ m2e, (2.1) ⃗ Pi+ ⃗Pe = P⃗f+ ⃗Pe′, (2.2)
where ⃗Pf and ⃗Pe′ are the momenta of the emitted photon and electron after Compton
scattering, respectively. me = 0.511 MeV/c2 is the electron mass. We can solve the
equation to obtain the energy of the final photon Eγ =| ⃗Pf| as follows:
Eγ = | ⃗Pi|| ⃗Pe| + | ⃗Pi| √ | ⃗Pe|2+ m2e | ⃗Pi| + √ | ⃗Pe|2+ m2e + (| ⃗Pi| − | ⃗Pe|) cos θγ , (2.3)
where θγ is the emission angle of the final photon. If | ⃗Pe| | ⃗Pi|, the final photon is
can be rewritten as Eγ = 4| ⃗Pi|| ⃗Pe|2 m2 e + 4| ⃗Pi|| ⃗Pe| + | ⃗Pe|2θ2γ , (2.4)
by using an approximation with | ⃗Pe| me and θγ ≈ 0. The maximum energy of an
emitted photon, the Compton edge Eγmax, is obtained at θγ = 0:
Eγmax = 4| ⃗Pi|| ⃗Pe|
2 m2
e + 4| ⃗Pi|| ⃗Pe|
. (2.5)
We used| ⃗Pe| = 7.975 GeV for incoming electrons and | ⃗Pi| = 3.49 eV for laser photons
with a wave length of 355 nm [37], and then Eγmax is calculated to be 2.385 GeV.
The differential cross section of Compton scattering in the laboratory frame is written as follows [38]: dσ dEγ = 2πr 2 ea Emax γ ( χ + 1 + cos2α), (2.6) where a = m 2 e m2 e + 4| ⃗Pi|| ⃗Pe| , (2.7) χ = ρ 2(1− a)2 1− ρ(1 − a), (2.8) cos α = 1− ρ(1 + a) 1− ρ(1 − a), (2.9) ρ = Eγ Emax γ . (2.10)
Here, re = 2.818 fm is the classical electron radius. Fig. 2.3 shows the Eγ dependence
of the differential cross section of backward Compton scattering. The BCS spectrum is
enhanced around the maximum energy Eγmax. Therefore, BCS photons will dominate
in high energy photons compared to bremsstrahlung photons generated via residual gas in the electron storage ring.
bcs.f 0 0.05 0.1 0.15 0.2 0 0.5 1 1.5 2 2.5 3 Eγ (GeV) dσ /dE γ (b/GeV)
Figure 2.3: The differential cross section of backward Compton scattering.
2.1.3
Tagging counter
The energy of a BCS photon is tagged by detecting the recoil electron with the LEPS2 tagging counter. The recoil electrons are bent by the magnet located downstream of
the collision point. These electrons hit different positions of the tagging counter
depending on their momenta. Then the energy of a recoil electron Ee is determined
by analyzing the tracks, and the energy of the BCS photon Eγ is obtained by
Eγ = Ee − Ee′, (2.11)
where Ee = 7.975 GeV is the energy of electrons circulating in the storage ring.
Fig. 2.4 shows a schematic drawing of the LEPS2 tagging counter. The tagging
counter consists of two layers of 1 mm square scintillating fiber (SciFi) hodoscopes and two layers of plastic scintillator (PS) hodoscopes. The SciFi hodoscopes are placed upstream of the PS hodoscopes. The SciFi layers are arranged so that the center of fibers are 0.5 mm shifted from each other. They cover a region corresponding to
BCS-photon energies above 1.3 GeV.
Figure 2.4: A schematic drawing of the LEPS2 tagging counter.
2.1.4
Target
A carbon target was used in this experiment. The thickness is 20.0 mm and the
density is measured to be 1.73 g/cm3. The target holder is made of a 10 mm thick
polystyrene foam and a 0.125 mm thick kapton foil. Pictures of the carbon target and the holder are shown in Fig. 2.5.
2.2
Detectors
The photon beam is transported to the target placed approximately 125 m down-stream from the BCS collision point, and reactions are induced on the target nuclei. Photoproduced particles and their decay products are detected by the detectors in-stalled in the LEPS2 experimental building. Figure 2.6 shows a schematic drawing of the detector setup in the LEPS2 building. An electro-magnetic calorimeter BGOegg covers a large solid angle around the target. Inner plastic scintillator (IPS) hodoscopes and a cylindrical drift chamber (CDC) are installed inside BGOegg to detect charged
Figure 2.5: (a)The carbon target. (b)(c)The target holder.
particles. A drift chamber (DC) and a resistive plate chamber (RPC) wall are in-stalled downstream of BGOegg to detect particles emitted in forward direction. A plastic scintillator named UpVeto is installed upstream of BGOegg to exclude events
in which an incident photon is converted to an e+e− pair before reaching the target.
In this work, CDC and forward detectors (DC, RPC) were not used in the data anal-ysis. Details of each detector strongly related to this analysis are described in the following subsections.
2.2.1
BGOegg calorimeter
BGOegg is an egg-shaped electro-magnetic calorimeter consisting of 1320 Bi4Ge3O12
(BGO) crystals, which cover a polar angle of from 24 to 144 degrees and the whole az-imuthal angles surrounding the target. Figure 2.7 shows a schematic view of BGOegg. The forward and backward parts of BGOegg are divided into 13 and 9 layers in the polar direction, respectively, and each layer is divided into 60 pieces in the azimuthal direction. We define the layer numbers i = 1, 2, ...., 22 from the downstream side, and
Figure 2.6: A schematic drawing of the detector setup in the LEPS2 experimental building.
give the azimuth numbers j = 1, 2, ..., 60 clockwise from the left when viewed from upstream. Then we can identify each crystal with a number n as
n = 60(i− 1) + j. (2.12)
Each crystal has an isosceles-trapezoid front and back, and its length in the radial direction is 220 mm, which corresponds to 20 radiation lengths. There is no support frame between the crystals, and thus there is no dead region. Each crystal is covered with a reflective film of ESR. More details of the BGOegg design is found in Ref. [39]. The signals from each crystal is read by a photomultiplier tube (PMT). Two types of PMTs are used for BGOegg; a metal-packaged PMT Hamamatsu Photonics R11265 (H11334) for the crystals of layer 5–20, and a 3/4-in. PMT Hamamatsu Photonics R4125 (H6524) for the other crystals. The charge amount and timing of PMT signals are measured with analog-to-digital converter (ADC) modules and time-to-digital converter (TDC) modules, respectively. We used LeCroy FERA 4300B and CAEN
1-GeV photons [39].
Figure 2.7: A schematic drawing view of BGOegg.
2.2.2
Inner plastic scintillator hodoscopes
The inner plastic scintillator (IPS) hodoscopes are installed inside BGOegg, as shown in Fig. 2.8, in order to identify charged particles. The inner hodoscopes consists of
30 plastic scintillators with a size of 453 mm × 26 mm × 5 mm. The signals are read
with multi pixel photon counters (MPPCs) connected to the upstream sides of the scintillators. One or two scintillators covers each BGOegg crystal.
2.2.3
UpVeto counter
A plastic scintillator named UpVeto is installed upstream of BGOegg. BCS photons
sometimes convert e+e− pairs before reaching the target due to the materials in the
beamline. These events are removed in the data analysis by using the UpVeto counter.
Figure 2.8: A schematic drawing of the configuration of BGOegg and inner detectors (left), and the front view of the inner hodoscopes (right).
× 3 mm. A fine-mesh PMT (Hamamatsu Photonics H6614-70mod) is connected to
the plastic scintillator through a light guide.
2.3
Trigger logic
The trigger signals for data acquisition are generated with a signal logic described in Fig. 2.9. Signals from BGOegg is divided into 88 blocks (4 blocks for each layer), and the sum-out signals, which are proportional to the number of fired channels in each block, are provided by using the LeCroy 4413 discriminator modules. The GeV-γ 139 module [40] gives the analog sum of these sum-out signals, and outputs a logical signal if the analog sum exceeds the set threshold. In this experiment, the threshold was set to output the trigger signal when two or more BGOegg crystals were fired. The trigger signal additionally requires a coincidence with BGOegg hits and tagger-PS hits. The trigger signal from the tagging counter is generated when two tagger-PSs in pair have hits. Then, the logical sum of the trigger signals from BGOegg and the tagging
counter gives an experimental trigger signal. This is denoted as “BGO2hit⊗Tagger
Figure 2.9: The trigger logic.
2.4
Data collection
The experiment was carried out from April to July in 2015. The total number of
incident photons in the tagged energy region (1.3–2.4 GeV) is 9.8× 10¹². The total
number of recorded events is 1.3 × 10⁹. We also took data with a liquid hydrogen
This chapter describes the energy and timing calibration of the BGOegg calorime-ter. The reconstruction of particle hits and the fundamental method of energy and timing calibrations are described in Sec. 3.1. Additional corrections for the energy measurement depending on the BGOegg layer are given in Sec. 3.2.
3.1
Fundamental calibration for BGOegg
Mesons in final states are reconstructed with an electro-magnetic calorimeter BGOegg via measuring the energy, timing, and hit position of their decay products, such as photons. In this section, the identification of a BGOegg hit together with the method of energy and timing calibrations, are described.
3.1.1
Energy reconstruction and clustering
An energy deposit Ei for each crystal is evaluated from recorded charge information
by
Ei = αi(Ai− A0i), (3.1)
where αi, Ai, A0i are the gain factor, the integrated charge on Analog-To-Digital
Converter (ADC), the pedestal channel of i-th crystal, respectively. Pedestal channels are determined run-by-run as mean values of ADC distributions with the condition
that i-th crystal and crystals within 30 degrees have no hit information on Time-To-Digital Converter (TDC). The gain factors should be determined individually because the gains of PMTs and their supplied voltages are different depending on crystals.
When a photon or an electron comes into a crystal, an electro-magnetic shower occurs. The energy of the shower is recorded as charge information for each crystal. Since the dimension of the front size of a BGO crystal is smaller than the trans-verse spread of an electro-magnetic shower, which is characterized by Moliere radius
RM = 22.3 mm [1], the electro-magnetic shower developed leaks into nearby
crys-tals. Therefore, to reconstruct the total energy of incoming photons or electrons, neighboring crystals with finite ADC values should be clustered and summed up.
A cluster is defined as a set of fired crystals to be connected. In the clustering algorithm, first of all, crystals with TDC information are connected. Second, adjacent crystals only with ADC information corresponding to a small energy deposit are
combined. (See Fig. 3.1.) The cluster energy Ecls is defined by
Ecls = ∑ i Ei mi , (3.2)
where Ei is the energy deposit for the i-th crystal and mi is the number of clusters
sharing i-th crystal. mi is usually set to 1. However, in the case that two clusters
share i-th crystal, mi is set to 2 and Ei is divided equally into these two clusters.
The hit position of a particle is reconstructed by an energy-weighted mean of the front positions of crystals in a cluster. The hit timing for a cluster is defined by using the timing information of cluster core, which is the crystal with the largest energy deposit.
When inner plastic scintillators in front of a reconstructed cluster are fired, the cluster is called a “charged cluster”, otherwise it is called a “neutral cluster”.
As-suming a neutral cluster corresponds to a photon, the momentum ⃗p is reconstructed
by ⃗ p = Ecls ⃗ r |⃗r|, (3.3)
where Ecls, ⃗r are the energy and hit position vector of a cluster, respectively. The
Figure 3.1: An example of the clustering method. In case of this figure, the cluster A consists of crystals inside the violet line, and the cluster B consists of crystals inside the blue line. Crystals with orange color have TDC information.
3.1.2
Energy leakage of a cluster
In general, the size of the electro-magnetic shower doesn’t contain inside the recon-structed clusters, e.g., a few % of the energy respect to its total energy is expected to leak out from the cluster. Therefore, the correction of the leaked energy is mandatory to reconstruct the full energy of incident particles. Since the ratio of energy leakage is dependent on particle energy and a hit position, the cluster energy should be cor-rected as a function of cluster energy and a hit layer. The amount of energy leakage was evaluated by a Monte-Carlo (MC) simulation. The correction is applied before the energy calibration, described in the next subsection.
A MC simulation was developed based on GEANT4 package [42, 43]. In the simu-lation, photons were generated isotropically at the target position with a fixed energy, which was varied sample by sample in a wide range. The energies of photons have been reconstructed via cluster information at BGOegg as same as real data analysis
and compared with the generated energy. The ratio of energy leakage ∆Eleak/E was
determined by ∆Eleak E = Eγ − Ecls Eγ , (3.4)
where Eγ, Ecls are the original energy of generated photons and the mean of a
recon-structed cluster energy distribution, respectively. The photon energy Eγ was set every
50 MeV from 50 to 1000 MeV. The cluster energy distribution was plotted for each layer at which the cluster core was found. The correction function was determined by fitting the following function to the energy dependence of estimated leakage:
∆Eleak
E = C1nerfc(C2n
√
| log(C3nE)|)C4n (3.5)
≡ fleak(E; n), (3.6)
where n is the layer number of a cluster core, and C1n–C4n are the fitting parameters
for the n-th layer. The function erfc(x) is a complementary error function defined as follows: erfc(x) = √2 π ∫ ∞ x exp(−t2)dt. (3.7)
Figure 3.2 shows the simulated energy leakage ratio as a function of the photon energy. Since a cluster size is determined by the number of fired crystals which is connected by the algorithm mentioned in the previous subsection, a cluster becomes larger as the absolute value of a photon energy increases. On the other hand, the actual spread of an electro-magnetic shower is almost constant around Moliere radius
RM. Therefore, the ratio of energy leakage decreases when photon energy increases.
A corrected cluster energy Eclscorr is obtained as a numerical solution of the equation
Eclscorr = Ecls0 + fleak(Eclscorr; n)E corr
cls , (3.8)
where Ecls0 is the original cluster energy defined by (3.2). The leak correction was
applied for the layers except for the outermost layers, which corresponds to the most forward and backward crystals. The energy leakage of those outermost layers was taken into account in the energy calibration process described in the following sub-section.
3.1.3
Energy calibration of BGOegg
The gain factors α are determined so that the mean of a reconstructed π0 mass peak
incident γ energy E (MeV)
energy leakage ratio
∆E/E
0 0.025 0.05 0 1000layer2
0 0.025 0.05 0 1000layer3
0 0.025 0.05 0 1000layer4
0 0.025 0.05 0 1000layer5
0 0.025 0.05 0 1000layer6
0 0.025 0.05 0 1000layer7
0 0.025 0.05 0 1000layer8
0 0.025 0.05 0 1000layer9
0 0.025 0.05 0 1000layer10
0 0.025 0.05 0 1000layer11
0 0.025 0.05 0 1000layer12
0 0.025 0.05 0 1000layer13
0 0.025 0.05 0 1000layer14
0 0.025 0.05 0 1000layer15
0 0.025 0.05 0 1000layer16
0 0.025 0.05 0 1000layer17
0 0.025 0.05 0 1000layer18
0 0.025 0.05 0 1000layer19
0 0.025 0.05 0 1000layer20
0 0.025 0.05 0 1000layer21
Figure 3.2: The simulated ratio of energy leakage. The fitted results of Eq.(3.5) are shown by red lines.
system is obtained from two neutral clusters by
Mγγ =
√
E1E2(1− cos θ), (3.9)
where E1,E2 are cluster energies. The cosine of opening angle θ is obtained by
cos θ = r⃗1· ⃗r2
|⃗r1||⃗r2|
, (3.10)
where ⃗r1, ⃗r2 are the hit position vectors of reconstructed clusters.
The 2γ invariant mass distribution was obtained for each crystal which was
as-signed to a core of either cluster. A peak structure of π0 → γγ was observed for every
crystal channel. Typical spectra of γγ invariant mass are shown in Fig. 3.3. Clusters with energies less than 80 MeV were unused because there were a lot of noise hits and incomplete clusters in the low-energy region. The opening angle of a γγ system was also required to be greater than 50 degrees in the Lab frame, because the uncertainty of the hit position became large for nearby clusters with bias for the invariant mass.
The reconstructed π0mass for i-th crystal, mi, was obtained by fitting a Gaussian and
a 2nd-order polynomial function to the spectrum. The gain factors αi were adjusted
so that mi agreed with the PDG value of π0 mass mπ for all channels:
αnewi = mπ
mi
αoldi , (3.11)
where αnewi , αoldi are adjusted and original gain factors for i-th crystal. For the
chan-nels at the outermost layers, the peak position to be adjusted cannot set to the π0
mass on the PDG because of the existence of the energy leakage to the outside of BGOegg. Therefore, the value is evaluated by a MC simulation, which is found to be
127.9 MeV/c2. Since the gain factors were updated simultaneously for all crystals,
this adjustment was repeated until the reconstructed π0 mass became consistent with
the target values for all crystals. The consistency was judged by using χ2, defined by
χ2 = 1 1320 1320∑ i=1 ( mi − mπ δmi )2 , (3.12)
invariant mass 0 100 0 200 Ee0001 invariant mass 0 100 200 0 200 Ee0061 invariant mass 0 100 200 0 200 Ee0121 invariant mass 0 100 200 0 200 Ee0181 invariant mass 0 100 200 0 200 Ee0241 invariant mass 0 100 200 0 200 Ee0301 invariant mass 0 200 0 200 Ee0361 invariant mass 0 100 200 0 200 Ee0421 invariant mass 0 100 200 0 200 Ee0481 invariant mass 0 100 200 0 200 Ee0541 invariant mass 0 100 200 0 200 Ee0601 invariant mass 0 100 200 0 200 Ee0661 invariant mass 0 100 200 0 200 Ee0721 invariant mass 0 100 200 0 200 Ee0781 invariant mass 0 100 200 0 200 Ee0841 invariant mass 0 100 200 0 200 Ee0901 invariant mass 0 100 200 0 200 Ee0961 invariant mass 0 100 200 0 200 Ee1021 invariant mass 0 100 0 200 Ee1081 invariant mass 0 100 0 200 Ee1141 invariant mass 0 50 100 0 200 Ee1201 invariant mass 0 50 0 200 Ee1261
2γ invariant mass (MeV/c2)
counts/1 MeV/c
2
Figure 3.3: Typical γγ invariant mass spectra. π0 peaks are clearly observed. Fitted
functions are shown by blue lines. The channel numbers of BGOegg crystals to which the cluster core belong are indicated in the top-right part of individual panels.
iteration of a few times. Figure 3.4 shows the π0peak positions after the final iteration. The gain factors were determined roughly every 10 runs in the collected data.
127 128 129 130 131 132 133 134 135 0 200 400 600 800 1000 1200
BGOegg channel number
π
0 peak position (MeV/c 2 )
Figure 3.4: The final values of π0 peak positions. The target values are indicated
by red lines at 134.9 MeV/c2 and 127.9 MeV/c2 for the inner and outermost layers,
respectively.
3.1.4
Timing calibration of BGOegg
The timing of i-th crysital hit, ti, is defined as a time difference to that of the nearest
RF signal, tRF:
ti = ci(Ti − T0i)− tRF, (3.13)
where Ti is the recorded TDC channel for the i-th crystal, and T0i was determined
so that the hit timings of photons should be distributed around 0 ns. The value ci
is a coefficient to convert the TDC channel to time in the unit of ns. The value was
determined to be ci = 0.9871 ns/channel.
In addition, a time-walk correction that originated via clear correlation between timing determined by leading-edge discriminators and pulse height information (ADC)
needs to be applied. The correction is known to be as slewing correction. The
senting the slope in high-ADC regions, was treated as a fixed parameter in the fit. γ was determined every run set in the collected data by fitting a linear function to the ADC-timing correlation in the high-ADC region. In the slewing-correction process,
photons from the π0 → γγ decay were selected in order to eliminate accidental noise
hits. In this analysis, the requirement of the reconstructed invariant mass of γγ to
be in the range from 114 to 156 MeV/c2 is taken. Figure 3.5 shows the ADC-timing
correlation with fitting results.
3.2
Additional correction of cluster energy
Even after the fundamental energy calibration described in the previous section, some problems with obtained cluster energies have remained. This section describes details of these problems and an additional correction to fix them.
3.2.1
Problems of obtained gain factors
As described in the previous section, the gain factors defined by the equation (3.1)
were determined based on the π0 mass. They should be applicable to any energy
region of photon hits as long as the linearity of a PMT output to the energy deposit is guaranteed. Therefore, a γγ invariant mass distribution for the η meson must be correctly peaked at the PDG value, too. However, as shown in Fig. 3.6, the gain
factors obtained independently based on the η mass, αη, were different from those
based on the π0 mass, απ. Here, the gain factors αη were determined in the same way
described in the previous section except for using a η → γγ peak. The target values to
be adjusted was 547.8 MeV/c2 and 519.9 MeV/c2 for the inner and outermost layers,
respectively (see Figure 3.7). To understand the inconsistency of gain factors απ and
ADC (channel) Timing (ns) 0 5 10 0 250 ch1 0 5 10 0 250 ch61 0 5 10 0 250 ch121 0 5 10 0 250 ch181 0 5 10 0 250 ch241 0 5 10 0 250 ch301 0 5 10 0 250 ch361 0 5 10 0 250 ch421 0 5 10 0 250 ch481 0 5 10 0 250 ch541 0 5 10 0 250 ch601 0 5 10 0 250 ch661 0 5 10 0 250 ch721 0 5 10 0 250 ch781 0 5 10 0 250 ch841 0 5 10 0 250 ch901 0 5 10 0 250 ch961 0 5 10 0 250 ch1021 0 5 10 0 250 ch1081 0 5 10 0 250 ch1141 0 5 10 0 250 ch1201 0 5 10 0 250 ch1261
Figure 3.5: The ADC-timing correlation BGOegg hits. The fitted functions are shown by blue lines.
0.98 0.99 1 1.01 1.02 2 4 6 8 10 12 14 16 18 20
BGOegg layer number
α
π /α
η
Figure 3.6: The ratio of gain factors based on the π0 mass and those based on the η
mass (απ/αη). 500 510 520 530 540 550 0 200 400 600 800 1000 1200
BGOegg channel No.
η peak position (MeV/c
2 )
Figure 3.7: The final values of η peak positions in an independent gain calibration.
The target values are indicated by red lines at 547.8 MeV/c2 and 519.9 MeV/c2 for
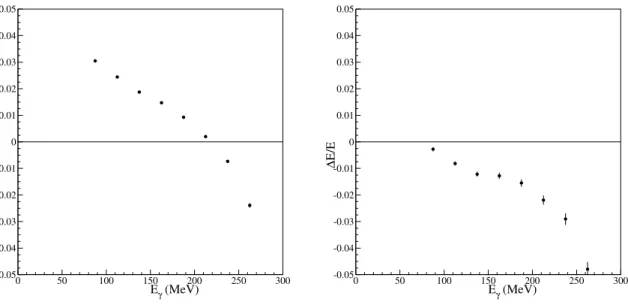
Layer dependence of π0 mass
To check the gain factors depending on the BGOegg layer number, the π0 mass was
reconstructed for each layer where the core crystal of either photon cluster was found.
Figure 3.8 shows the reconstructed π0 mass for some of the forward layers. In this
figure, one of the two neutral clusters corresponds to the layer number described in the upper side of each panel, while the other cluster belongs to the layer number
represented in the horizontal axis. The gain factors αη were used to plot this figure.
The reconstructed π0 mass obviously becomes lower when using a cluster whose core
belongs to forward layers up to the 4th layer. Furthermore, the reconstructed π0 mass
decreases more significantly when both two photons hit in the forward layers. This
behavior suggests that αη’s are too low in the layers 2–4 for lower photon energies
corresponding to the π0 → γγ decay when they are adjusted based on the η mass.
Layer dependence of η mass
Figure 3.9 shows the reconstructed η mass for each combination of γ hit layers in the
same way as the analysis for π0 mass. Here αη’s are used again as gain factors. Unlike
the case of π0 mass, there is no layer dependence in the reconstructed η mass, and the
observed dependence is consistent with a MC simulation result for any combination
of hit layers. This result confirms that αη’s give low gains in the forward layers only
when the cluster energies are relatively low, because the difference of π0 and η leads to
different energy coverages of photon clusters. In contrast, απ’s must show high gains
in the forward layers when the cluster energies are high, as recognized from Fig. 3.6.
The reason of the gain factor inconsistency
From the above studies, the deviation of αη from απ appears when a cluster belongs to
the forward layers up to the 4th layer and has a low energy corresponding to photons
coming from π0. Simultaneously, απ’s are unreasonably higher than αη’s in the same
forward layers.
Considering the clear changes between the 4th and 5th layers, as seen in Figs. 3.6 and 3.8, the problem seems to come from the difference of signal-readout PMT types: that is, H6524 was used for the forward region up to the 4th layer, and H11334 was used for the other layers. Based on our observation, it is deduced that the linearity
130 132 134 136 138 0 5 10layer15 20 m π (MeV/c
layer2
130 132 134 136 138 0 5 10layer15 20layer3
130 132 134 136 138 140 0 5 10layer15 20 m π (MeV/c 2 )layer4
130 132 134 136 138 140 0 5 10layer15 20layer5
130 132 134 136 138 140 0 5 10layer15 20 m π (MeV/c 2 )layer6
130 132 134 136 138 140 0 5 10layer15 20layer7
Figure 3.8: The reconstructed π0 mass for different layer combinations of two neutral
clusters in the case of using αη. The layer number described in the upper side of each
panel represents that of the forward cluster, and the horizontal axis represents the
layer number of the backward cluster. The PDG value of π0 mass is indicated by red
540 545 550 555 560 0 5 10layer15 20 m η (MeV/c 2 )
layer2
540 545 550 555 560 0 5 10layer15 20layer3
540 545 550 555 560 0 5 10layer15 20 m η (MeV/c 2 )layer4
540 545 550 555 560 0 5 10layer15 20layer5
540 545 550 555 560 0 5 10layer15 20 m η (MeV/c 2 )layer6
540 545 550 555 560 0 5 10layer15 20layer7
real data MC simulationFigure 3.9: The reconstructed η mass for different layer combinations of two neutral
clusters in the case of using αη. The layer number described in the upper side of each
panel represents that of the forward cluster, and the horizontal axis represents the layer number of the backward cluster. The PDG value of η mass is indicated by red lines. The forward layers up to the 7th layer are shown.
layers) are not derived because a cluster whose core is found there is not used in the analysis described in the following chapters.
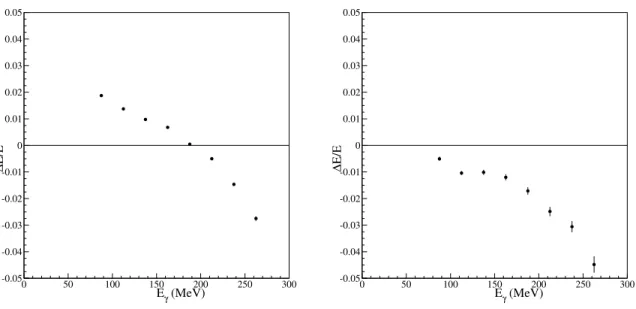
3.2.2
Correction of cluster energy for the forward layers
To correct the cluster energy with recovery of the linearity for the forward layers, the difference of the measured energy from the correct energy was estimated as a function of the true energy under the following assumptions:
1. The gain factors based on η mass, αη, are determined incorrectly for the forward
layers up to 4th when the photon energy is relatively low.
2. The cluster energies are correctly reconstructed for the inner layers from 6th to 19th with linearity.
The difference of a cluster energy from the correct energy for the forward layers, ∆E, were obtained in the following way. In the case of the correction for the i-th
forward layer, π0 mass was reconstructed in combination with another cluster detected
at the j-th layer, where j varied from 6 to 19. The reconstructed π0 mass M can be
written by
M = 2√EiEj sin θ
2, (3.15)
where Ei, Ej are the cluster energies with η-based gain factors αη at the i-th and
j-th layer, respectively, and θ is the opening angle of these clusters. Here, Ej must
be a true energy, based on the assumption 2. The correct π0 mass Mπ is written by
Mπ = 2
√
EitrueEj sin θ
2, (3.16)
factor ∆E = Eitrue− Ei can be derived to be ∆E E = 1− ( M Mπ )2 . (3.17)
In the measurement of ∆E/E by using Eq. 3.17, M was obtained from the two
detected neutral clusters based on Eq. 3.15, while the PDG value of π0 mass was
assigned to Mπ. The left panels of Figs. 3.10–3.12 show the obtained correction factor
∆E/E for the 2–4th layers. ∆E/E obtained by a MC simulation is also shown in the right panels of the same figures. There remains energy dependence of ∆E/E not only in the real data but also in the MC simulation. Here, photon energy distributions
of individual crystals are enhanced at lower energy sides. In a certain Ei bin, event
leaks due to a finite energy resolution exist more from the lower-energy neighboring bin with negative ∆E. This effect becomes stronger at higher-energy bins because higher-energy events are kinematically limited and the event leaks are more significant. Therefore, ∆E/E decreases at higher energies even in a MC simulation. The energy to be corrected is ∆E measured in the real data after removing this effect about event leakage, Thus, the true correction factor was obtained by subtracting the ∆E/E values of the MC simulation from that of the real data. Figure 3.13–15 show the ∆E/E results after the subtraction. Finally, the correction functions were determined
by fitting a linear function to the subtracted data. The final cluster energy Eclsfin are
obtained by adding the correction factor ∆E to the cluster energy after the leak
correction, Eclscorr: Eclsfin = Eclscorr + ∆E. The corrections are applied for the energy
ranges where ∆E > 0.
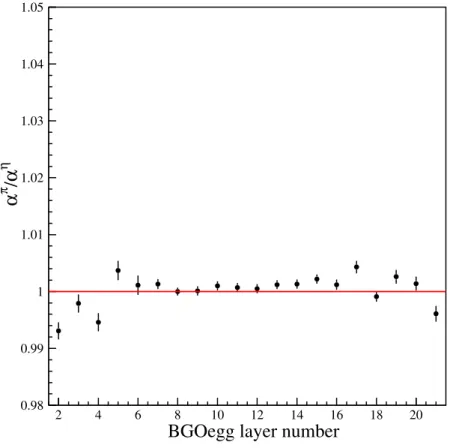
After applying the ∆E/E correction, the gain factor calibrations to obtain απ
and αη were redone. Then, the ratio of the gain factors απ and αη, the momentum
dependence of η mass, and the layer dependence of π0 mass were checked again.
Figure 3.16 shows the new ratio of απ/αη. The inconsistency between απ and αη has
been significantly resolved, and they agree within 1%. Figures 3.17 show the layer
dependence of the π0 mass. αη’s were used to plot these figures. Strong dependences
are removed, and the consistency with MC simulations has been achieved in both figures.
Although both types of gain factors απ and αη can be used consistently after
-0.05 -0.04 -0.03 -0.02 -0.01 0 0.01 0 50 100 150 200 250 300 Eγ (MeV) ∆E/E -0.05 -0.04 -0.03 -0.02 -0.01 0 0.01 0 50 100 150 200 250 300 Eγ (MeV) ∆E/E
Figure 3.10: ∆E/E for the 2nd layer by using the real data (left) and a MC simulation (right). -0.05 -0.04 -0.03 -0.02 -0.01 0 0.01 0.02 0.03 0.04 0.05 0 50 100 150 200 250 300 Eγ (MeV) ∆E/E -0.05 -0.04 -0.03 -0.02 -0.01 0 0.01 0.02 0.03 0.04 0.05 0 50 100 150 200 250 300 Eγ (MeV) ∆E/E
Figure 3.11: ∆E/E for the 3rd layer by using the real data (left) and a MC simulation (right).
-0.05 -0.04 -0.03 -0.02 -0.01 0 0.01 0.02 0.03 0.04 0.05 0 50 100 150 200 250 300 Eγ (MeV) ∆E/E -0.05 -0.04 -0.03 -0.02 -0.01 0 0.01 0.02 0.03 0.04 0.05 0 50 100 150 200 250 300 Eγ (MeV) ∆E/E
Figure 3.12: ∆E/E for the 4th layer by using the real data (left) and a MC simulation (right). -0.01 0 0.01 0.02 0.03 0.04 0.05 0 50 100 150 200 250 300 Eγ (MeV) ∆E/E
Figure 3.13: ∆E/E for the 2nd layer after subtracting the values by a MC simulation from those of the real data. A fitted function is indicated by a red line.
-0.01 0 0.01 0.02 0 50 100 150 200 250 300 Eγ (MeV) ∆E/E
Figure 3.14: ∆E/E for the 3rd layer after subtracting the values by a MC simulation from those of the real data. A fitted function is indicated by a red line.
-0.01 0 0.01 0.02 0.03 0.04 0.05 0 50 100 150 200 250 300 Eγ (MeV) ∆E/E
Figure 3.15: ∆E/E for the 4th layer after subtracting the values by a MC simulation from those of the real data. A fitted function is indicated by a red line.
chapters because απ’s are stably determined with high statistics. 0.98 0.99 1 1.01 1.02 1.03 1.04 1.05 2 4 6 8 10 12 14 16 18 20 α π /α η
BGOegg layer number
Figure 3.16: The ratio of the gain factors based on the π0 and those based on the η
130 132 134 136 138 0 5 10layer15 20 m π (MeV/c
layer2
130 132 134 136 138 0 5 10layer15 20layer3
130 132 134 136 138 140 0 5 10layer15 20 m π (MeV/c 2 )layer4
130 132 134 136 138 140 0 5 10layer15 20layer5
130 132 134 136 138 140 0 5 10layer15 20 m π (MeV/c 2 )layer6
130 132 134 136 138 140 0 5 10layer15 20layer7
Figure 3.17: The reconstructed π0mass for different layer combinations of two neutral
clusters after applying the ∆E/E correction. The layer number described in the upper side of each panel represents that of the forward cluster, and the horizontal
axis represents the layer number of the backward cluster. The PDG value of the π0
In this chapter, event selection criteria for the η′ → γγ process and procedures for background reduction are described.
4.1
Fundamental event selection
The photoproduction process of η′ mesons, i.e., γN → η′N has been chosen as an
elementary process to produce η′ mesons in the nucleus. The mass spectrum of the
η′ meson was reconstructed using one of its decay channels, η′ → γγ mode, via
detecting two photons in the final state. Therefore, the event with two photons and one nucleon in the final state will be selected for this analysis. Thus, events with just two neutral clusters and one or less charged clusters at BGOegg were selected. Note that nucleons are not necessarily detected because they can leave from the acceptance hole of BGOegg.
Fundamental cut conditions for the neutral clusters corresponding to photons are as follows:
1. The crystal energy sum of each cluster is more than 100 MeV. 2. Each cluster core does not belong to the outermost layers.
3. The angle between two neutral clusters is more than 50 degrees. 49
4. No crystal is shared by different clusters.
5. The occupancy ratio (the ratio of the energy deposit at the cluster core to the cluster energy) is less than 0.9.
6. The timing of each cluster with respect to the RF signal is within ±1.5 ns.
The condition 1 was required to eliminate noise hits or incomplete clusters. The condition 2 was set because the energy resolution becomes too low at the outermost layers due to large energy leakage. The condition 3 was required because small opening angles bias the γγ invariant mass. (See Fig. 4.1.) The condition 5 was required in order to exclude a possibility of neutron hits. Since the energy deposit of photons spreads out due to an electro-magnetic shower, the occupancy ratio of clusters made by photons distributes in the range less than 0.9, as shown in Fig. 4.2. In contrast, the energy deposit of neutron clusters is concentrated at the cluster core. The condition
6 was determined so that the timing range should be set within ± 5σ for all layers
and cluster energies. This timing condition can reduce accidental BGOegg hits from different electron bunches and clusters made by cosmic rays. Slow neutrons can be also excluded by this timing condition.
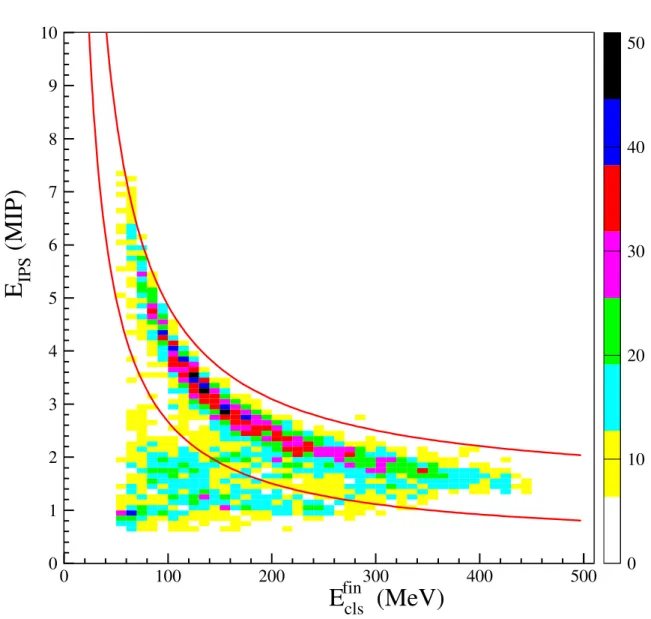
When a charged cluster is found at BGOegg, it should correspond to a proton. Thus, a condition to identify the proton was required using so-called ∆E-E
correla-tion, where ∆E is the energy deposit measured by the inner hodoscopes, EIPS, and E
is the cluster energy measured by BGOegg, Eclsfin. Figure 4.3 shows the ∆E-E
correla-tion along with the selected region between red lines. Events with two neutral clusters
were selected to plot the figure, where the γγ invariant mass Mγγ was required to be
in the region of 900≤ Mγγ < 1020 MeV. The selected region is expressed by
0.339 + 232.9/Eclsfin ≤ EIPS < 1.326 + 353.6/Eclsfin, (4.1)
where Eclsfinis measured in the unit of MeV, and EIPSis measured in the unit normalized
by the energy deposit of minimum ionizing particles (MIP). The inner hodoscopes were calibrated so that the distribution of energy deposits by MIP should be peaked at 1.
133 133.5 134 134.5 135 2 4 6 8 10 12 14 16 18 20
BGOegg layer number
π
0 peak position (MeV/c
Figure 4.1: π0 peak positions in the γγ invariant mass distribution for each layer in
a MC simulation of γp → π0ηp events. Opening angle cuts were applied with the cut
points of 50 degrees (black) and 25 degrees (blue). No cut was applied for the red
points. The PDG value of the π0 mass is indicated by a red line. The γγ invariant
mass is biased in forward layers in the case of 25-degrees cut or no cut.
0 50 100 150 200 250 300 350 0 0.1 0.2 0.3 0.4 0.5 0.6 0.7 0.8 0.9 1 Occupancy ratio counts
Figure 4.2: Distributions of the occupancy ratio of a cluster for photon hits (black) and neutron hits (blue). The cut point is indicated by a red line at 0.9.
![Figure 1.3: The density dependence of meson mass spectra calculated with the linear sigma model [25]](https://thumb-ap.123doks.com/thumbv2/123deta/5889052.1047730/18.918.294.705.147.454/figure-density-dependence-meson-spectra-calculated-linear-sigma.webp)
![Figure 1.4: The experimental upper limit of the signal cross section compared with theoretical calculations [34].](https://thumb-ap.123doks.com/thumbv2/123deta/5889052.1047730/20.918.266.699.141.439/figure-experimental-upper-signal-section-compared-theoretical-calculations.webp)
![Figure 2.1: The beamline map of the SPring-8 facility [36]. The LEPS2 beamline is located at BL31LEP.](https://thumb-ap.123doks.com/thumbv2/123deta/5889052.1047730/25.918.148.725.297.837/figure-beamline-spring-facility-leps-beamline-located-lep.webp)