Spatio-Temporal
Patterns
in
an
Adhesive
Tape
at
Peeling
山崎義弘 (Yoshihiro Yamazaki) 1, 戸田昭彦 (Akihiko Toda) *
Dept. of Physics, Chuo Univ.
* Fac. ofIntegrated Arts and Sciences, Hiroshima Univ.
Abstract
We investigated the dynamical behavior of an adhesive tape at peeling. And a
dynamical-morphological phase diagram as functions of peel speed and spring constant
was obtained. The spati0-temporal patterns turn out to be classified roughly into four
types; low-speed pattern, high-speed pattern, oscillatory pattern, and spati0-temporal
in-termittent pattern.
keywords :adhesion, dynamical phase diagram, stick-slip motion, fingering instability,
spati0-temporal intermittency
Introduction
Adhesion is
acommon
phenomenon inour
daily life and is characterizedas
amechanicalbehavior when
we
separate two materials sticking to each other. It is, however, considered tobe difficult to
understand
adhesive behaviors quantitatively sincewe
must take into accountnot only amicroscopic change of surface properties but also amacroscopic deformation of
an
adhesive itself [1]. In order tocharacterize the mechanical properties
of
an
adhesive, speed-loadcurve
is measured by peelingan
adhesive tape. This measurement has been carried outas an
industrial test in general. Furthermore this measurement is also important from the viewpoint
of soft matter physics.
Recently, the dynamical properties of
an
adhesive tape has been studied by observing themorphology of apeeling front of adhesive [2]. In the
case
of adhesive failure whichmeans
that the adhesive does not remain
on
the surface of the substrate after peeling, two sortsof morphologies
are
observed
dependingon
the peel speedand
load. Inone
state, adhesiveundergoes alarge deformation and forms atunnel-like morphology. The large deformation
causes
theenergy
dissipation and peel speed becomes low. In the other state, adhesive failureoccurs
before the large deformation of adhesive. Therefore the peel speed is larger than thatof the former state, and
no
morphology is observed. The interesting point is that there isan
1yamazaki@seagull.phys.chu0-u.ac.jp
数理解析研究所講究録 1231 巻 2001 年 56-63
oscillatory region between these two states with respect to peel load. If the experiment with aconstant speed within the intermediate region is carried out, then these two states
emerge
alternately in time. We expect that this oscillatory motion in
an
adhesive tape is also able to understand within thecommon
physical framework to other stick-silp phenomena [3] suchas
dry friction of granular matter [4], paper-paper slip [5], earthquake [6], and melt fracture in
polymeric liquid [7].
In this Letter,
we
report the results ofour
experiments for the further investigation and tryto understand the peeling behavior by constructing adynamical phase diagram.
Experimental Setup
The experimental setupis shown schematically in Fig. 1. AtwO-ply adhesivetape
was
stickedon asolid plate and the top tape
was
connected toan
elastic spring whose spring constant is denoted by $k$ in this figure. The elastic springwas
pulled upward atone
end with aconstant speed $V$. Therefore the peeling angle inour
experiment is 90’. It is noted thatwe
consider the peeling of an adhesive tape not from the surface of asolid plate but from the back surface ofthe other adhesive tape. We used
an
adhesive tape with cross-linked adhesive ($\mathrm{N}\mathrm{o}.31\mathrm{D}$, NittoDenko Corporation). The width of the tape is $25\mathrm{m}\mathrm{m}$ and the substrate is aPET film with 25
$\mu \mathrm{m}$ thickness. The temperature
was
25 $\pm 1\circ \mathrm{c}$ and humiditywas
not controlled. It is knownthat moisture has little effect
on
the property of adhesive we used [8]. As control parameterswe
changed $k$ and $V$, andwe
measured the peel load $F$ and observed the patterns lefton
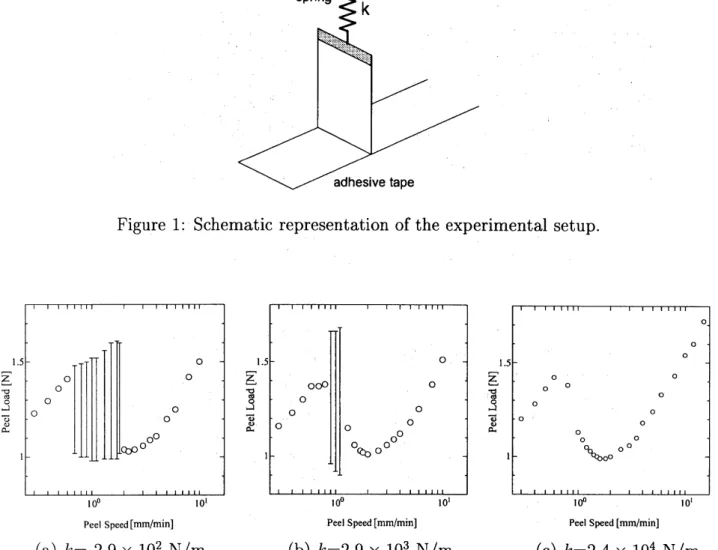
the surface of apeeled tape.Results
Speed-load
curves
in three different cases, namely, $k=2.9\cross 10^{2},2.9\cross 10^{3}$, and 2.4 $\cross 10^{4}$$\mathrm{N}/\mathrm{m}$
are
shown in Fig.2. From Fig.2(a), it is found that two stationary regions represented byaset of white circles (region $\mathrm{A}:V<0.8\mathrm{m}\mathrm{m}/\min$, region $\mathrm{B}:V>2.0\mathrm{m}\mathrm{m}/\min$) exist. In each region, peel load increases
as
peel speed becomes high. The strength of the peel load in these regionsseems
to be independent of the spring constant. In the intermediate region betweenregions Aand $\mathrm{B}$, oscillatory motion
occurs as
shown in Fig.2(a). The speed-load behavior inFig.2(a) is consistent with the experimental results by Urahama [2]. In addtion
we
found that57
the intermediate oscillatory region becomes
narrower
and finally vanishesas
$k$ increases (see Fig.2(b) and (c)$)$. We also confirmed that the fluctuations in peel load from the averageare
gradually diminished
as
$k$ increases at afixed peel speed. Thereforewe
expect that there existsacritical spring constant
as
afunction ofpeel speed at which aHopfbifurcationoccurs.
The difference between region Aand region $\mathrm{B}$
emerges
not only in aspeed-loadcurve
butalso in amorphology of adhesive during peeling. Figure 3shows the typical failure front of
an
adhesive tape in peeling process. Figs. $3(\mathrm{a})$ and (b)
are
failure fronts in thecase
of regions Aand $\mathrm{B}$, respectively. The direction of peeling is down. In the
case
ofregion $\mathrm{A}$, it is found thatoval holes aligning regularly
are
formed in front of the failure front. These holes representcross
sections of tunnels made of adhesive
as
pointed out by Urahama.On
the other hand, in thecase
of region $\mathrm{B}$,no
hole is formed and the failure front becomes rough. The difference in thefailure front between these two regions is considered to be caused by the visc0-elastic behavior
of adhesive. In region $\mathrm{A}$, peel speed is low and adhesive is able to deform largely. In region $\mathrm{B}$,
however, peel speed is
so
high that the failureoccurs
without large deformation in most partof adhesive. Instead of atunnel formation
as
in thecase
of region $\mathrm{A}$, fibrilsare
formed by thelarge deformation only in the limited local part of adhesive. These
deformations
in both speedregions
occur
in the vicinity of the failure front and remaineven
after peeling. Therefore, wecan
identify apeelingprocess
by observingan
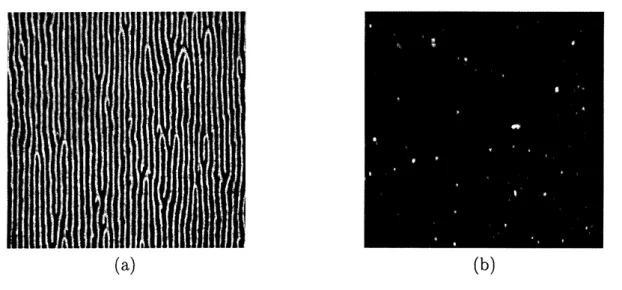
adhesive tape after peeling.Figure $4(\mathrm{a})$ and (b) show the typical patterns in apeeled adhesive tape in regions Aand $\mathrm{B}$,
respectively. In Fig.4(a), astriped pattern is
seen.
White lines represent tunnels of adhesive,and
some
defects
exist where awhite line is terminatedor
is splitting into twoor
three lines.The splitting of awhite line
occurs
due to the tip splitting ofan
oval air hole in Fig.3(a)induced by fingering instability [9]. In contrast,
no
pattern is observed in Fig.4(b) becauselarge deformation
occurs
only inalimited
local region of adhesive.In the
intermediate
speedregion between
two regionsAand
$\mathrm{B}$,we
found
two characteristicpattens depending
on
the springconstantas
shown in Fig.5. In these figures, peeling progressesfrom top tobottom. Morphologiesobservedinthe
case
ofregions Aand$\mathrm{B}$are
seen as
white andblack regions in Fig.5, respectively. Figure $5(\mathrm{a})$ is astriped pattern alternating morphologies
in the
case
of region Aand $\mathrm{B}$, and thisstriped pattern is obtained in thecase
where the springconstant is small. It is found that this pattern is spatially uniform and periodic
emergence
oftwo morphologies
causes
the oscillation of peel load. As the spring constant becomes bigger,spatial uniformity in the pattern is lost and black and white regions vary not only temporally but also spatially
as
shown in Fig.5(b). In thecase
of ahard spring, the deviation ofpeel loadmust be reduced and asteady state in peel speed and load is realized. The crucial point from
Fig.5(b) is that asteady state is realized not by
emergence
ofanew
morphology formed by peeled adhesive but by coexistence of two morphologies obtained in thecase
of region AandB. Therefore, if
we
change apeel speed,anew
steady state is achieved by changing the ratio of white region to black regionas
shown in Fig.6.Then, It turns out to be that the spati0-temporal patterns
can
be classified into four types;low-speed pattern, high-speed pattern, oscillatory pattern, and spati0-temporal intermittent
pattern. Actually the dynamical-morphological phase diagram in V-k space
was
obtainedas
shown in Fig.7. Low-speed and high-speed patterns correspond to morphologies in the
case
ofregions Aand $\mathrm{B}$, respectively. And oscillatory pattern is characterized
as
aspatially uniformstriped pattern.
Summary
and
Discussion
We investigated the dynamical behavior in the peeling process of
an
adhesive tape froma
morphological viewpoint. The features
are
summerizedas
follows.(i) By constructing adynamical-morphological phase diagram in V-k spacethe spati0-temporal patterns ofapeeled adhesive tape
can
be classified into four types; low-speed pattern $(V<V_{\mathrm{L}})$,high-speed pattern $(V>V_{\mathrm{H}})$, oscillatory pattern $(V_{\mathrm{L}}<V<V_{\mathrm{H}}, k<k_{\mathrm{c}}(V))$, and spatial temporal intermittent pattern $(V_{\mathrm{L}}<V<V_{\mathrm{H}}, k>k_{\mathrm{c}}(V))$. $V_{\mathrm{L}}$ is the upper limit speed for the
low-speed pattern, and $V_{\mathrm{H}}$ is the lower limit speed for the high-speed pattern. $k_{\mathrm{c}}$ is the upper
limit spring constant for aspatially uniform striped pattern.
(ii) From aspeed-load measurement, atransition from asteady state to
an
oscillatory stateoccurs at acritical spring constant $k^{*}$. $k^{*}$ is expected to be aHopf bifurcation point. The
relation between $k_{\mathrm{c}}$ and $k^{*}$ is not clear.
(iii) Asteady state in aspeed-load
curve
in thecase
of $V_{\mathrm{L}}<V<V_{\mathrm{H}}$ and $k>k^{*}$ is realized by controlling the rate of aspatial occupation of morphologies in low-speed and high-speedpatterns at atime. And this ratio depends
on
the peel speedThe failure front in aspati0-temporal intermittent pattern is shown in Fig.8. The peeling
process
progresses
downward. It is found from this figure that the failure in high-speed regionoccurs
in the middle region of the front line and two kinds offailure frontsas
shown in Fig.3coexist. Theimportant point is that the positions of the failure fronts in twostates
are
differentfrom each other. Therefore this difference is considered to have
an
influenceon
the morphologiesin the vicinity of the interface between two states. In constructing amodel for the dynamical behavior of
an
adhesive,we
must take into account not only the effect of springas
aglobalinteraction but also the spatial variation of the failure front
as
alocal interaction.Acknowledgments
The authors thank Dr. T. Mizuguchi and Mr. A. Nishimoto for their fruitful discussions.
The authors
are
grateful to Prof. T.Ohta
and Prof. M. Matsushita for their enlighteningdiscussions.
References
[1]
C.
Gay and L. Leibler. Physics Today, 52(11):48-52,1999.
[2] Y. Urahama. J. Adhesion, 31:47-58,
1989.
[3] B. N.
J.
Persson. Sliding Fkiction. Springer-Verlag, Berlin,1998.
[4]
S.
Nasuno, A. Kudrolli, A. Bak, and J. P.Gollub.
Phys. Rev. E, 58:2161-2171, 1998.[5] F. Heslot, T. Baumberger, B. Perrin, B. Caroli, and
C. Caroli.
Phys. Rev. E, 49:4973-4987,1994.
[6]
J.
M.Carlson
andJ. S.
Langer. Phys.Rev.
Lett, 62:2632-2635,1989.[7] K.
Sato
and A. Toda.J.
Phys.Soc.
Jpn., 68:77-85,1999.
[8] Y. Urahama. private communication. 2001.
[9] M. Rabaud,
S.
Michalland, and Y. Couder. Phys. Rev. Lett, 64:184-187, 1990Figure 1: Schematic representation ofthe experimental setup. $\mathrm{o}\circ$ 15 $\overline{\frac{\mathrm{z}}{\triangleleft_{\phi}[mathring]_{A}}}$
ooo
$\circ$ $\circ 0\circ$ $\overline{"\omega v}$ $\mathrm{o}$ $\mathrm{o}$ $\mathrm{o}_{0\nwarrow_{b\mathrm{o}^{\circ}}0^{\circ^{\mathrm{O}}}}$ 1 $10^{0}$ $10^{1}$PeelSpeed$[ \mathrm{m}\mathrm{m}/\min]$ PeelSpeed$[ \mathrm{m}\mathrm{m}/\min]$ PeelSPeed$[ \mathrm{m}\mathrm{m}/\min]$
(a) $k=2.9\cross 10^{2}\mathrm{N}/\mathrm{m}$ (b) $k=2.9\cross 10^{3}\mathrm{N}/\mathrm{m}$ (c) $k=2.4\cross 10^{4}\mathrm{N}/\mathrm{m}$
Figure 2: Peel load
as
afunction ofpeel speed $V$ in threecases
with adifferent spring constant. (a) $k=2.9\cross 10^{2}\mathrm{N}/\mathrm{m}$, (b) $k=2.9\cross 10^{3}\mathrm{N}/\mathrm{m}$, (c) $k=2.4\cross 10^{4}\mathrm{N}/\mathrm{m}$. The bar represents theamplitude of the oscillatory motion in peel load at each fixed peel speed.
(a) (b)
Figure 3: Failurefronts at peeling. Peeling progresses from top to bottom, (a) the morphology
of adhesive in the
case
ofregion A. (b) the morphology of adhesive in thecase
of region B. The actual size of these figures is 440 $\mu \mathrm{m}\cross 290\mu \mathrm{m}$.(a) (b)
Figure 4: Snapshots of typical patterns in apeeled adhesive tape, (a) the
case
ofregion A. (b)the
case
of region B. The actual size ofthese figures is 5.0 mm $\cross 5.0\mathrm{m}\mathrm{m}$.(a) (b)
Figure 5: Snapshotsof typical patterns in the intermediate regions ofpeel speed between region
Aand B. (a) oscillatory pattern; $k=2.9\cross 10^{3}\mathrm{N}/\mathrm{m}$, $V=0.8\mathrm{m}\mathrm{m}/\mathrm{s}\mathrm{e}\mathrm{c}$
.
(b) spati0-temporalintermittent pattern; $k=2.7\cross 10^{3}\mathrm{N}/\mathrm{m}$, $V=1.6\mathrm{m}\mathrm{m}/\mathrm{s}\mathrm{e}\mathrm{c}$. The actual size of these figures is
25 mm $\cross 19\mathrm{m}\mathrm{m}$.
Figure 6: Another example ofaspati0-temporal intermittent pattern with adifferent condition
from Fig.5(b). The actual size ofthis figure is 15 mm $\cross 11\mathrm{m}\mathrm{m}$.
a
$\grave{\Xi}$ $\overline{\epsilon 6}$ $*\mathrm{r}\dot{n}$ $\overline{\circ 0}$ $\underline{\mathrm{o}}\mathfrak{v}$ $.\infty\approx \mathrm{E}$Peel Speed $[ \mathrm{m}\mathrm{m}/\min]$
Figure 7: Dynamical-morphological phase diagram in V-k space.
Figure 8: Afailure front in the
case
of aspati0-temporal intermittent pattern. Two kindsof failure morphologies, namely, morphologies in low-speed pattern and high-speed pattern
coexist. The actual size of this figure is 1.9 mm $\cross 0.75\mathrm{m}\mathrm{m}$.