New Migrant Settlement in Lae
著者
TAJIMA Yasuhiro
journal or
publication title
南太平洋海域調査研究報告=Occasional papers
volume
23
page range
57-65
URL
http://hdl.handle.net/10232/16785
Survey Team 4, Report 2. The Progress Report of the 1991 Survey of the Research Project,
"Man and the Environment in Papua New Guinea"
NEW MIGRANT SETTLEMENT IN LAE
Yasuhiro TAJIMA
Purpose and method
This study aims to examine the characteristics of, and changes in Papua New Guinean society by grasping the recent migration patterns from rural district to urban areas. In my former papers (TAJIMA 1990a, 1990b), I have reported on the migration processes in two urban settlements, the Papuan Compound Area and the Buko Settlement, which were formed in the 1960's and 1970's. This time, I selected four settlements formed in 1980's as our sample areas, and interviewed householders with questionnaires. The name of the settlements used in our samples are : Tensiti Station 1, Mouth Markham, West Taraka, and Boundary Road.
Tensiti Station 1 is situated in the northern part of the city and was first formed by people from Menyamya, Morobe Province in 1983. Now this scttlcncnt is composed of 30 households from Menyamya, 17 households from the Highlands areas, and 11 households form the Sepik areas. People live on government land and many of them work as wage earners. Examples of their occupations include a provincial officer, an employee of a private company, and a teacher. In addition, some of them are farmers in the city.
Mouth Markham is situated at the mouth of the River Markham, in the south-western part of the city. Mouth Markham with a population of 300, is a mixed settlement and had its first residents in the early 1980's. However, most people have settled there since 1989.
They rent the land from the Rabu and Butu people who have lived near there since early
times, and pay ground rent to them. The residents work as wage earner in the city, but some are jobless.
West Taraka is situated in the north-western part of the city, and Boundary Road is situated in the mid-western part of the city. Both have grown rapidly in the 1970's and
1980's by people coming mainly from the Highlands areas. I tried to interview at least ten
householders in the former two settlements, and I entrusted my investigation to the leaders
of the settlements in the latter two cases.
In this paper, I will discuss the results of my survey in terms of first, the attributes of the respondents; second, their migration processes; third, their life situation; fourth, the relationships to their home villages, and fifth, their hopes for the future. Finally, I would
like to sort out the communal and other elements which weaken the unity of the communities in the results of my survey.
Results
1. Attributes and former migration experience
When aggregated into tenyearage groups (Table 1), more than three-fourths of the
respondents were in their twenties (36.4%) or thirties (39.4%). Morobe Province (24.2%),
East Sepik Province (36.4%), and the provinces in the Highlands (27.3%) were the main places of birth of the respondents (Table 2). 39.4 percent of the informants had worked as
58
Y. TAJIMA
subsistence farmers in their home villages (Table. 3). The second largest category included
students and children (27.3%). However, we can also notice self-employed people and wage
earners in various categories as well. 57.6 percent of the informants answered that they had no migration experience before they came to Lae (Table 4). Those who had former migration
experience answered that they had migrated to the main cities for work.
Table 1 Ages of informants
Ages T M W B No. % 16-20 1 1 3.0 21-25 4 5 1 10 30.3 26-30 1 1 2 6.1 31-35 1 2 2 1 6 18.2 36-40 3 3 1 7 21.2 41-45 46-50 1 1 3 1 6 18.2 51-55 1 1 3.0 Total 10 12 7 4 33 100.0
Note: T stands for "Tensiti Station 1", M stands for "Mouth Markham", W
stands for "West Taraka" and B stands for "Boundary Road"
Table 3 Occupations in home villages
Occupation T M W B No. % Farmer 4 3 5 1 13 39.4 Self-employed 2 2 4 12.1 Coffee grower 2 2 6.1 Carpenter 1 1 3.0 Driver 1 1 3.0 Wage earner 1 2 3 9.1 Cowboy 1 1 3.0 Sawmiller 1 1 3.0 Shop worker 1 1 3.0 Missionary 2 1 3 9.1 Student, child 1 7 1 9 27.3 Unknown 1 1 3.0 Total 10 12 7 4 33 100.0
Table 2 Birth place
Province T M W B No. % Morobe 6 1 1 8 24.2 Menyamya 6 6 18.2 Gori 1 1 3.0 unknown 1 1 3.0 E. Sepik 3 8 1 12 36.4 Wewak 2 2 6.1 Maprik 2 3 5 15.2 Yangoru 1 1 2 6.1 Angorum 2 2 6.1 Ama 1 1 3.0 W. Sepik 1 1 3.0 Northern 1 1 2 6.1 Central 1 1 3.0 Chimbu 1 4 5 15.2 E. Highland 4 5 12.1 Total 10 12 7 4 33 100.0
Table 4 Past experiences of migration
Place (Work) T M W B No. %
Bougainville (Copra) 2 2 6.1
(Mine) 1 1 3.0
Popondetta (Copra) 1 1 2 6.1
Rabaul 1 1 3.0
Port Moresby 1 2 3 9.1
Mount Hagen (Shop) 2 2 6.1
Goroka 1 1 3.0
Lae 1 1 3.0
Main cities (Misson) 1 1 3.0
"None" 5 9 3 2 19 57.6
2. The process of migration to Lae
Almost half of the informants (48.5%) came to Lae in the 1980's. The figure is much higher in Mouth Markham (66.7%, Table 5). East Sepik Province (30.3%) and the provinces in the Highlands (30.3%) stand out as places where the informants lived before they came to Lae. This tendency corresponds to the fact that most respondents were born in the Sepik and Highlands areas and less than half of them have had former migration experiences. The people from East Sepik tend to live in Mouth Markham, and those from the Highlands tend to concentrate in the West Taraka and Boundary Road settlements respectively (Table 6).
57.6 percent of respondents came to Lae for employment (Table 7). However, it is also
true that their relatives (60.6%), especially brothers and sisters (18.1% and 12.1%), were
staying in Lae before the respondents moved to Lae (Table 8). Most respondents (63.6%) stayed in their relatives' homes when they first came to Lae (Table 9). After the informants
had secured a place to stay, their most important concern was job-hunting. 48.5 percent of
the informants visited companies directly and 9.1 percent wrote letters to the companies. More than half of the informants did not depend on relatives or "Wantok" (people from the
Table 5 Year of immigration to Lae
Year T M W B No. % 1961-65 2 2 4 12.1 66-70 1 2 3 9.1 71-75 1 1 3 5 15.2 76-80 4 1 5 15.2 81-85 1 1 2 2 6 18.2 86-90 3 7 10 30.3 Total 10 12 7 4 33 100.0
Table 7 Reasons coming to Lae
Reasons T M W B No. %
Job 4 7 6 2 19 57.6
School 1 2 3 9.1
Marriage 2 2 6.1
Mission 2 2 6.1
To live in the city 1 1 2 6.1
Other 2 1 1 1 5,} 15.2
Total 10 12 7 4 33 100.0
Note 1) "t° grow crops" "to live in a new settlement" "to meet my brother who was sick" "to meet my father" etc.
Table 6 Living place before coming to Lae
Province T M W B No. % Morobe 6]) 1 1 8 24.2 E. Sepik 32) ?3) 10 30.3 W. Sepik 1 1 3.0 Central 2 2 6.1 Northern 1 1 2 6.1 Chimbu 1 3 4 12.1 E. Highlands 1 4 5 15.2 W. Highlands 1 1 3.0 Total 10 12 7 4 33 100.0
Note 1) Menyamya 6, 2) Yangoru 2, Wewak 1, 3) Wewak 3, Maprik2, Yangoru1, Marienberg 1,
Table 8 Relatives living in Lae
Relatives T M W B No. %
Relatives 7 10 1 2 20 60.6
Father & mother 3 1 4 12.1
Brother 1 5 6 18.2 Sister 2 1 1 4 12.1 Uncle 1 2 3 9.1 Cousin 2 2 6.1 Brother in law 1 1 3.0 "Wan tok" 3 3 9.1 None 3 2 5 15.2 Unknown 3 2 5 15.2 Total 10 12 7 4 33 100.0
Y. TAJIMA
Table 9 Dwelling place in Lae
Dwelling place T M W B No. %
Relative's house 7 7 3 4 21 63.6
Father (mother)'s house 2 1 3 9.1
Brother(sister) 's house 4 4 3 1 12 36.4 Other relative's house 1 3 2 6 18.2 "Wan tok"s house 1 3 1 5 15.2
In the place ofwork 1 1 2 6.1
Dormitory 1 1 3.0
Selfbuilt 1 1 3.0
Rely on the settlement 3 3 9.1
Total 10 12 7 4 33 100.0
Table 11 Companions of the immigrants
Companion T M W B No. %
Alone 7 7 3 1 18 54.5
Wife & children 3 3 6 18.2
Brother 2 1 3 9.1
Cousin 1 1 3.0
Friend 3 2 5 15.2
Total 10 12 7 4 33 100.0
Table 10 Way of looking for job
Looking for job T M W B No. %
Go to co. alone 4 8 1 3 16" 48.5
Write a letter 2 1 3n 9.1
Rely on the relatives 1 1 1 1 4 12.1
Rely on the settlement 3 3 9.1
Respond to a reqest 1 1 3.0
Have a job already 3 32) 9.1
Student 1 1 2 6.1
Unknown 1 1 3.0
Total 10 12 7 4 33 100.0
Note 1) 4 people among 19 couldn't get jobs 2) mission 2, farmer 1
Table 12 Problems in Lae at their arrival time
Problems T M W B No. %
Hungry 1 2 3 9.1
No friends 1 1 3.0
Sick 1 1 3.0
Liveing in a crowded room 1 1 3.0
"Yes" (unknown) 1 1 2 6.1
"No problems" 9 9 6 1 25 75.8
Total 10 12 7 4 33 100.0
same language group) when they tried to find a job (Table 10). Many of them visited
companies again and again, until they finaly found a job. 54.5 percent of the respondents
came to Lae alone (Table 11). However, some informants were accompanied by their
relatives, family members, and friends.
75.8 percent of the informants answered that they did not have any serious problems after they moved to Lae. Some of the problems respondents experienced included hunger,
loneliness, and crowded living conditions (Table 12).
3. Current life situation
In grasping their current life situation, I paid attention to their occupations and family situations, especially the differences in the origins of husbands and wives. Concerning the
present occupations of the respondents, the wage earner (33.3%), and the self-employed person (24.2%) stand out as two major categories (Table 13). However, there are differences
in the distribution of wage earners and self-employed persons among the settlements. Wage earners are most numerous in Mouth Markham, while self-employed persons are most numerous in Tensiti Station 1. It should be noted that the percentage of those who are
unemployed is also relatively large (18.2%). In terms of working hours per week, 24.2 percent of the informants work less than eight hours a week (Table 14). If we consider those
Table 13 Present occupation Occupation T M W B No. % Self employed 6 1 1 8 24.2 Subsistence farmer 4 4 12.1 Breeding chickens 2 2 6.1 Carpenter 1 1 2 6.1 Wage earner 3 7 1 11 33.3
Security service Co. 1 2 3 9.1
Waiter in hotel 1 1 3.0
Bakery worker 1 1 3.0
Driver of Cola Co. 1 3.0
Allied electronics Co. 1 3.0
Furniture Co. worker 1 3.0
Supermarket worker 1 3.0
Motor Co. worker 1 3.0
Salesman 1 1 3.0 Missionary 1 1 2 4 12.1 Community leader 2 2 6.1 Student 1 1 3.0 No occupation 4 2 6 18.2 Unknown 1 1 3.0 Total 10 12 7 4 33 100.0
Table 16 Year of marriage
Year T M W B No. % 1961-65 1 1 3.0 66-70 71-75 1 2 1 4 12.1 76-80 4 3 1 8 24.2 81-85 1 2 3 9.1 86-90 3 2 2 7 21.2 91- 2 2 6.1 Alone 1 1 2 6.1 Unknown 4 2 6 18.2 Total 10 12 7 4 33 100.0
Table 14 Working hours per week
Hours T M W B No. % 0 - 8 1 5 2 8 24.2 8-16 1 1 3.0 16-24 24-32 1 1 2 6.1 32-40 1 1 1 3 9.1 40- 7 6 5 1 19 57.6 Total 10 12 7 4 33 100.0
Table 15 Number of children per household
Number T M W B No. % 7 1 1 3.0 6 5 1 1 3.0 4 1 3 2 2 8 24.2 3 2 2 4 12.1 2 2 1 1 1 5 15.2 1 2 3 1 1 7 21.2 0 3 3 1 7 21.2 Total 10 12 7 4 33 100.0
Table 17 Place of Marriage
Place T M W B No. % Home village 6 4 4 2 16 48.5 Lae 3 4 1 1 9 27.3 Others 3 1 4 12.1 Unmarried 1 1 2 6.1 Unknown 2 2 6.1 Total 10 12 7 4 33 100.0
who work more than forty hours a week as full-time workers, then only 57.6 percent of the respondents are employed full-time.
94 percent of the informants' households have less than four children (Table 15). This might be due to the newness of the settlements which were built in the 1980's. About 90% of the respondents except "alone" and "unknown" were married in the 1970's and 1980's (Table 16). 48.5 percent of the informants married in their home villages, while 27.3 percent and
62
Y. TAJIMA
Table 18 Difference of native place between husband and wife
Native place T M W B No. %
Same village 7 4 4 2 17 51.5
Different village5' 2 1 3 9.1
Different province 2" 52) 23) 24> 11 33.3
Unmarried 1 1 2 6.1
Total 10 12 7 4 33 100.0
Notel) E. Sepik (Wewak) W. Sepik 2) E. Sepik (Wewak)
E. Sepik (Maprik)
-Madan 3) Northern -Morobe -Chimbu E. Sepik -E. Highland -Chimbu 4) E. Highland -Morobe -Chimbu E. Highland -Chimbu E. Sepik (Angoram) -Gulf 5) in same province E. Sepik (Yangoru) -Morobe (Boana)
Morobe (Salamaua) -Central
Marriages to fellow villagers occurred with 51.5 percent of the respondents (Table 18). However, it is remarkable that 42.4 percent of the respondents were married to women who were born in different villages from them. These marriage patterns may indicate the informants' widening contacts to the "outer" world through immigration to urban areas. 4. Relationship to the home village
I asked the respondents about temporal visits, letterwriting, and the remittance of money and goods to their homes in order to assess the strength of their relationship to the home village. Among the relatives in their home village, the informants regard parents and
siblings as the most important (33.3% and 30.3% respectively in Table 19). 69.7 percent of the informants have returned to their home villages more tham once a year (Table 20). This
Table 19 The most important person living in home village
Family relationship T M W B No. %
Father, mother 3 6 1 1 11 33.3 Brother, sister 5 4 1 10 30.3 Uncle 2 1 2 1 6 18.2 Other relatives 1 1 3.0 No one 1 1 3.0 Unknown 3 1 4 12.1 Total 10 12 7 4 33 100.0
Table 21 Frequency of sending money or goods to the home village
Frequency Over 12 times a year 6-11 times a year 3-5 times a year 1-2 times a year Once in 2-3 years
Give to them in Lae
Bring bythemselves Do not send Total % 12.1 6.1 12.1 27.3 9.1 6.1 3.0 24.2 100.0
Table 20 Frequency of returning to their home village
Frequency Over 4 times a year 2-3 times a year Once a year Once in 2-4 years Once in 5-10 years Not yet returned
Total No. 33 % 12.1 15.2 42.4 6.1 6.1 18.2 100.0
Table 22 Frequency of sending letters to the home village
Frequency Over 12 times a year 6-11 times a year 3-5 times a year 1-2 times a year Once in 2-3 years
Do not write a letter Unknown
Total 10 12
means that the informants have kept a strong commitment to ther home village. The informants in West Taraka returned most frequently. This might be because 71.4 percent of the informants in West Taraka are from the Highlands areas which are connected to Lae by
the Highland Highway (Table 6). 57.6 percent of the informants sent money or goods to their home villages more than once a year (Table 21), and 69.8 percent of them wrote letters
even more frequently (Table 22). The remittance and the letters also indicate the infor mants' strong relationship with their home villages.
5. Future hopes
Lastly, I asked the respondents about their wishes of returning home and their hope in the future as a measure to assess the strength of the relationship to their home villages and the direction of courses of social changes. As shown in table 23, 66.7 percent of the informants reported that they hope to return to their home villages in the future. This is Table 23 The place people want to live in the
future Place T M W B No. % Lae 6 4 10 30.3 Home village 4 11 3 4 22 66.7 Other 1 1 3.0 Total 10 12 7 4 33 100.0
Table 25 Hope for work and life in the future
Hope T M W B No. % Business 5 4 4 2 15 45.5 Manage a store 2 2 1 2 7 21.2 Do some business 2 1 3 9.1 Breed chickens 2 1 3 9.1 Manage PMV" 1 1 3.0
Manage passenger ship 1 1 3.0
Other active hopes 1 1 1 3 9.1
Politician 1 1 3.0
Metallurgist 1 1 3.0
Leader ofcommunity 1 1 3.0
Rather passive hope 2 4 1 2 9 27.3
Collect sand gold 1 1 3.0
Do my life in village 3 1 1 5 15.2
Respectable man 1 1 3.0
Make child independent 1 1 3.0
No hope 1 1 3.0
"I don't know" 2 3 5 15.2
Unknown 1 1 3.0
Total 10 12 7 4 33 100.0
Note 1) PMV stands for "Public Motor Vehicle"
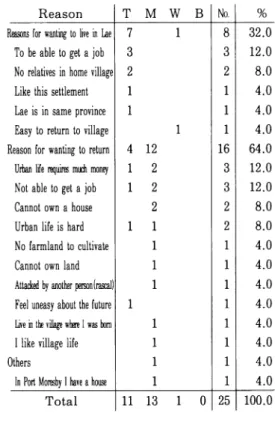
Table 24 The reasons for selecting the place they want to live in the future
Reason
Reasons for wanting to live in Lae To be able to get a job No relatives in home village Like this settlement
Lae is in same province Easy to return to village Reason for wanting toreturn Urban life requires much money Not able to get a job
Cannot own a house Urban life is hard No farmland to cultivate Cannot own land Attacked by another pereon(rascal) Feel uneasy about the future
Live in the village where I was born
I like village life
Others
In Port Moresby 1have a house
Total
Note 1) I could not collect enough answers in West Taraka and Boundary Road because I didn't interview them by myself in these settlements.
2) One householder does not always give only one answer.
M Y. TAJIMA
especially strong in Mouth Markham and Boundary Road (91.7% and 100% respectively). This is another indication of the strong commitment to their home villages. The stated reasons for wishing to return to their home villages are as follows: "Urban life requires too much money.", "Urban life is too hard.", "We haven't got our own land or houses.", and
finally, "We like village life." (Table 24). In contrast, 30.3 percent of the informants hope to stay in Lae (Table 23). The stated reasons are as follows: "We can get more money by working in the city." and "I have no relatives in my home village." (Table 24).
This evidence indicates that even in urban life, the respondants maintain the customs
and ideas of their rural life. Furthermore they have strong ties to their home villages. However, many of them (45.5 percent) hope to do some business in the future (Table 25). This might indicate that the influence of commercialism or capitalism considerably affects
their consciousness.
Discussion
A. Communal elements among the above results are as follows.
1) The newcomers stayed in their relatives' houses in the city.
2) Immigrants had a strong connection to their home villages, as many of them returned to
their villages at least once a year.
3) Many of them hoped to return to their home villages in the future.
4) They had strong attachment to their land and houses, which table 24 shows us.
5) Some of them regarded urban life as difficult. Instead they preferred village life.
B. The following shows the elements which weaken the unity of the communities.
1) About 40% of the responding immigrants had previous experiences of migration. This
is a relatively large percentage.
2) Many of them changed their jobs from subsistence farmers to wage earners.
3) Over 40% of the men were married to women who were born in different villates from them. This means that there is a widening in the range of their marriages.
4) Some of the responding immigrants, especially in Tensiti Station 1 and West Taraka,
hoped to stay in Lae from now on, though many of them hoped to return to their home villages in the future.
5) About half of them hoped to manage some kind of business in the future.
These five points described in B result mainly from the effects of urbanization. Both 1)
and 2) in B indicate the experiences of the wage earners, i. e. the most monetary economic and
capitalistic experiences. After their experiences, they hope to manage a business in the
future. The reason for wanting to stay in Lae in 4) was the existence of jobs, giving them
opportunity to make money. This also means the accumulation of the experience of monetary economy.
Concluding Remarks
The society of PNG strongly maintains the elements of community. However, the
advance of a monetary economy is affecting urbanization as we saw with the growht of wage
References
TAJIMA, Y. 1990a Kagoshima Univ. Res. Center S. Pac, Occasional Papers. No.20 : 51-57.