Transformation of the Rice Marketing System
and Myanmar's Transition to a Market Economy
著者
Okamoto Ikuko
権利
Copyrights 日本貿易振興機構(ジェトロ)アジア
経済研究所 / Institute of Developing
Economies, Japan External Trade Organization
(IDE-JETRO) http://www.ide.go.jp
journal or
publication title
IDE Discussion Paper
volume
43
year
2005-12-01
INSTITUTE OF DEVELOPING ECONOMIES
Discussion Papers are preliminary materials circulated
to stimulate discussions and critical comments
DISCUSSION PAPER No. 43
Transformation of the Rice
Marketing System and Myanmar’s
Transition to a Market Economy
Ikuko Okamoto*
December 2005
Abstract:
Creating a rice marketing system has been one of the central policy issues in Myanmar’s move to a market economy since the end of the 1980s. Two liberalizations of rice marketing were implemented in 1987 and 2003. This paper examines the essential aspects of the liberalizations and the subsequent transformation of Myanmar’s rice marketing sector. It attempts to bring into clearer focus the rationale of the government’s rice marketing reforms which is to maintain a stable supply of rice at a low price to consumers. Under this rationale, however, the state rice marketing sector continued to lose efficiency while the private sector was allowed to develop on condition that it did not jeopardize the rationale of stable supply at low price. The paper concludes that the prospect for the future development of the private rice marketing sector is dim since a change in the rice market’s rationale is unlikely. Private rice exporting is unlikely to be permitted, while the domestic market is approaching the saturation point. Thus, there is little momentum for the private rice sector to undertake any substantial expansion of investment.Keywords: Myanmar, rice, marketing system, liberalization
JEL classification: P39, Q13, Q18
The Institute of Developing Economies (IDE) is a semigovernmental,
nonpartisan, nonprofit research institute, founded in 1958. The Institute
merged with the Japan External Trade Organization (JETRO) on July 1, 1998.
The Institute conducts basic and comprehensive studies on economic and
related affairs in all developing countries and regions, including Asia, Middle
East, Africa, Latin America, Oceania, and Eastern Europe.
The views expressed in this publication are those of the author(s). Publication does not imply endorsement by the Institute of Developing Economies of any of the views expressed.
INSTITUTE OF DEVELOPING ECONOMIES (IDE), JETRO 3-2-2, WAKABA,MIHAMA-KU,CHIBA-SHI
CHIBA 261-8545, JAPAN
Transformation of the Rice Marketing System and Myanmar’s Transition to a Market Economy∗
Contents
Introduction
1. The First Liberalization and Transformation of the State Rice Marketing Sector
1.1 The System after the First Liberalization
1.2 Background and Determining Factors of the First Liberalization
1.3 Problems in the State Marketing Sector after the First Liberalization
2. The Private Rice Marketing Sector after the First Liberalization
2.1 Development of Private Marketing Sector
2.2Problems that Private Rice Marketing Sector Has Faced
3. The Second Liberalization
Conclusion
References
∗
The author would like to show a great appreciation to Dr. Koichi Fujita of Kyoto University for valuable comments. The author also thanks all the members of the research project of Institute of Developing Economies, JETRO entitled “Transition to a Market Economy: Issues and Prospects under 15 years of Military Rule” conducted in 2003 and 2004.
Introduction
Creating a rice1 marketing system to serve the national interest has been one of the central
policy issues for the Myanmar government since independence. The importance of rice for food
security as well as a source of government revenues and foreign exchange earnings have been
the major factors for the historical priority placed on rice. It is the leading staple food in
Myanmar, and the per capita rice consumption of 180 kg per year (Thein Myint 1997, p.7)
clearly indicates the extremely high dependency of the Myanmar people on rice, even when
compared with neighboring Asian countries. For this reason successive Myanmar governments
have put great political importance on ensuring a stable supply of rice as a key to maintaining
the stability of the regime (Mya Maung 1998, p.109). Under the socialist government that came
to power in 1962, a comprehensive system of controls over rice marketing was established for
the first time which introduced a rice ration system for consumers along with a compulsory
delivery system for procuring paddy directly from farmers to support the ration system. At the
same time the exportation of rice became a state monopoly and served as the regime’s main
source for earning foreign exchange. Thus it is no exaggeration to say that agricultural policy in
Myanmar is synonymous with rice policy.
The implementation of agricultural marketing liberalization began in the late 1980s
starting with the domestic agricultural market which was liberalized from September 1987. This
move signaled the start of Myanmar’s transition to a market economy. A year later, in October
1988, the ban on the private export of agricultural produce was lifted (Okamoto 2001), and
thereafter the marketing of some crops enjoyed full liberalization. However, the marketing of
rice, which was basically the main target of agricultural reform, remained under state control.
The rice ration system was maintained for the public servants and the paddy procurement
system, which had been terminated in 1987, were revived in 1989. Further, rice exporting
1
In this paper rice means both paddy and milled rice. When a distinction is necessary, the terms paddy or milled rice are used.
remained a government monopoly with responsibility taken over by Myanmar Agricultural
Produce Trading (MAPT).2 This period of reform can be called the first liberalization.
In April 2003, 16 years after the first liberalization, another liberalization of rice
marketing was suddenly announced. Under this second liberalization the rice ration system for
the civil servants and the paddy procurement system were finally abolished. Initially, the private
exporting of rice was also incorporated into the reform plan and the foreign exchange earnings
were to be divided equally between the government and the private sector. However, this part of
the plan was not implemented when abolition of the rice rationing system was announced in
January 2004. This second liberalization can be viewed as an epoch-making reform which has
brought about the comprehensive liberalization of the domestic rice market 40 years after the
establishment of Myanmar’s socialist regime. However, the aftermath of the second
liberalization also shows that the government is still not ready to undertake full-scale rice export
deregulation.
The institutional changes and current state of Myanmar’s rice marketing system have yet
to be fully explored. Takahashi (2000), Okamoto (1993), MOAI (2000) and U Tin Htut Oo and
Kudo (2003) provide overviews of the rice marketing system after the first liberalization.
However, these studies limit their discussions to overviews of the institutional changes and do
not analyze the development process of the marketing system or the interrelationship between
the state and the private marketing sector. Therefore, the emphasis of this paper is on describing
the transformation of the rice marketing system in greater detail and depth. Through this closer
examination, this study seeks to bring into clearer focus the rationale of the government’s rice
marketing reforms and to explore the significance of liberalizations in the light of developments
Myanmar’s rice marketing sector. Two points in particular will be examined to evaluate the
transformation of the rice marketing system: 1) the way the state marketing sector was
2
The government institution responsible for rice marketing has been reorganized and renamed several times. MAPT came into being following reorganization of the AFPTC (Agricultural Farm Produce Trading Corporation) in 1989. See Okamoto (1993).
maintained and the characteristics it came to have after the first liberalization, and 2) the way
the state sector has influenced the development of the private sector. However, it is still too
early to provide a comprehensive evaluation of the second liberalization, and only a provisional
assessment will be attempted in this paper.
Section 1, which follows, describes the features of the state marketing sector after the first
liberalization along with presenting the background and underlying factors of the reform and its
problems. Section 2 explores the development of the private marketing sector and the problems
it has faced. Section 3 examines the significance of the second liberalization, and the findings of
this study are summed up in the concluding section.
1. The First Liberalization and Transformation of the State Rice Marketing Sector
1.1 The System after the First Liberalization
The essential components of the rice marketing system of the socialist period were the
rice rationing system for consumers, the paddy procurement system that supported the rationing
system, and the state monopoly on rice exporting. This section will look at how the first
liberalization changed these three particular systems.
a. The Rice Rationing System
The rice rationing system targeting general consumers was abolished with the first
liberalization,3 and the system was limited to targeting the so-called Budget Group ( or Target
Group) which consisted of civil servants and military personnel. This substantially reduced the
number of people targeted for rice rations which decreased the volume of rationed rice to
0.6-0.8 million tons in normal years. This was a decrease of 1 million tons compared to the
volume rationed in the socialist period (Table 1). Sixty percent of the total rationed rice was for
3
Until 1994 rice was rationed to some general consumers in rice deficit area through cooperatives. However, the amount was quite limited.
public servants, 30% for the military, and the rest went to special institutions such as hospitals.4
Table 1 Changes in the Volume of Rationed Rice
(in thousand tons)
Rice Coverted in Paddy
1980/81 4,259 1,618 3,236 76.0 1983/84 4,145 1,709 3,418 82.5 1987/88 564 574 1,148 203.5 1988/89 1,672 556 1,112 66.5 1989/90 1,482 869 1,738 117.2 1990/91 1,851 751 1,502 81.1 1991/92 2,095 616 1,232 58.8 1992/93 2,222 770 1,540 69.3 1993/94 1,939 711 1,421 73.3 1994/95 2,034 744 1,487 73.1 1995/96 1,934 769 1,539 79.5 1996/97 1,522 822 1,643 108.0 1997/98 1,601 773 1,546 96.6 1998/99 2,200 668 1,336 60.7 1999/2000 2,212 616 1,232 55.7 2000/2001 2,126 585 1,169 55.0 2001/2002 2,119 569 1,137 53.7 Notes:
1. The conversion rate from paddy into rice is 50%.
2. For 1979/80~1994/95, procurement includes that by cooperative. Sources:
Procurement volumes from: REFS various issues and MAPT documents Rationed volumes for 1980/81,83/84 from: MAPT (2003, p.222-23) for 1987/88-92/93 from: Ko Ko Gyi (1994, Table 5)
for 1993/1994-2001/02 from: MAPT documents Volume of Paddy
Procured
Rationed Rice % of Rationed Volume in Procured Volume
Under the rice ration system of the socialist period, general consumers were eligible to
receive 12.6 kg (6 pyi5) monthly per adult and 6.3 kg (3 pyi) per child under 12 years old (Mya
Than and Nishizawa 1990, p.104).6 Assuming that the per capita consumption for an adult was
4 MAPT. 5 1pyi equals 2.1kg. 6
These figures are based on information from government officials. Rice farmers were not targeted for rationed rice. Instead, they were allowed to deduct the paddy for home consumption from the calculation of their paddy procurement obligation. But those farming less than three acres were eligible for rationed rice. Rice was provided by the people’s shops in the initial stage and by consumer cooperatives at later
180 kg per year, as it is at present, 84% of annual consumption would have been covered by the
ration system, which can be regarded as quite a sufficient amount. Moreover, the average price
of rationed rice remained at about 50% of the free market price for the period of
1962/63-1986/87, and for the decade from 1978, the price was kept unchanged.7 This means
that consumers were sufficiently protected in terms of food security.
After the first liberalization, the volume of rationed rice for the Budget Group was
changed to 25 kg (12 pyi) per month for an unmarried adult and 28 kg (14 pyi) for a married
adult. This was a sufficient amount for an individual adult, but depending on the size of a
household, the amount of rationed rice decreased compared to that of the socialist period.
However, the price of rationed rice was kept at 21% of the free market price on average for the
period of 1988-2001,8 and some ministries and organizations even provided the rice to their
personnel for free.9 Therefore, it can be said that the price was kept low in order to compensate
for the decrease in the amount of rationed rice compared to that of the socialist period.
b. The Paddy Procurement System
With the decrease in the volume of rationed rice, the paddy procurement system that supplied
the rice was scaled back as well. A procurement quota was set for paddy produced in the
monsoon season (monsoon paddy), but it was decreased to 10-12 baskets10/acre (0.5-0.6 tons
stage. In addition to that, government officials were eligible to the special rationed rice “Project rice” in the case they were members of any government projects.
7
Saito and Lee Kin Kiong (1998, p.98). The price of rationed rice differs depending on whether a location is categorized as a rice deficit or rice surplus area. For example, the price difference between Mandalay and Yangon is 10% (MAPT, 2003, p.222-225). Meanwhile the free market price difference between the two cities is 30%-80% (Okamoto 2003, p.174), indicating that deficit areas are given special consideration.
8
Calculated based on Monthly Economic Indicators (various issues) and MAPT (2000, p.260).
9
Some ministries having a relatively good financial footing provided their own subsidies for rice. In 1996, when there was a sudden jump in the price, rice was rationed to all public workers for free (Mya Maung 1998, p.113).
10
per hector) from the 30-40 basket/acre (1.5-2.1 tons per hector) of the socialist period.
Consequently, the volume of rice procured by the government as a share of total rice production
decreased by one-third after liberalization (Table 2).
Table 2. Estimated Volume of Domestically Marketed Paddy Rice (in thousand tons) A Production Procured Volume Ratio (%) Seed Waste Home Consumpt ion
Volume Ratio(%) Milled Rice Converted to Paddy as a % of Procure-ment as a % of Produc-tion b b/A C/A d d/b d/A 1971/72 8189 2245 27.4 514 514 7528 (1585) (31.9) 831 1240 55.3 15.1 1976/77 9335 2889 30.9 524 524 7538 (2140) (22.9) 646 964 33.4 10.3 1980/81 13340 4259 31.9 530 530 7384 637 4.8 703 1049 24.6 7.9 1981/82 14170 4355 30.7 527 527 7402 1358 9.6 701 1046 24.0 7.4 1982/83 14397 4111 28.6 504 504 7395 1882 13.1 711 1061 25.8 7.4 1983/84 14312 4145 29.0 499 499 7413 1756 12.3 906 1352 32.6 9.4 1984/85 14279 3731 26.1 508 508 7406 2126 14.9 634 946 25.4 6.6 1985/86 14341 4156 29.0 506 506 7354 1818 12.7 594 887 21.3 6.2 1986/87 14150 4263 30.1 500 500 7363 1523 10.8 604 901 21.1 6.4 1987/88 13658 564 4.1 482 482 7402 4728 34.6 320 478 84.7 3.5 1988/89 13186 1672 12.7 494 494 7447 3080 23.4 48 72 4.3 0.5 1989/90 13826 1482 10.7 504 504 7551 3785 27.4 169 252 17.0 1.8 1990/91 13748 1851 13.5 511 511 7579 3296 24.0 134 200 10.8 1.5 1991/92 12993 2095 16.1 499 499 7589 2312 17.8 183 273 13.0 2.1 1992/93 14603 2222 15.2 530 530 7648 3672 25.1 199 297 13.4 2.0 1993/94 15500 1939 12.5 587 587 7694 4693 30.3 261 390 20.1 2.5 1994/95 17908 2034 11.4 613 613 7737 6911 38.6 1041 1554 76.4 8.7 1995/96 17669 1934 10.9 634 634 7772 6695 37.9 354 528 27.3 3.0 1996/97 17397 1522 8.7 607 607 7810 6852 39.4 93 139 9.1 0.8 1997/98 16391 1601 9.8 597 597 7829 5765 35.2 28 42 2.6 0.3 1998/99 16808 2200 13.1 607 607 7869 5524 32.9 120 179 8.1 1.1 1999/2000 20159 2212 11.0 649 649 7908 8741 43.4 69 103 4.7 0.5 2000/2001 21359 2126 10.0 657 657 7948 9972 46.7 257 384 18.0 1.8 Notes:
1. Seed and waste are assumed to be 2 baskets per acre.
2. Home consumpion is calcurated as the number of households×5.5(the average number of people per household in 1999) ×15 baskets. For 1998/99-99/2000 the data for farm households are not available; therefore consumption was estimated
using the average increase in the rate of households. 3. Exports include both white rice and broken rice.
4. The paddy conversion rate for exports is assumed to be 67%. Sources:
number of farm households from: RFES , various issues procurement volumes: same as Table 1
production and sown acreage from: Agricultural Statistics , 1998/99-2000/01 and MAS exports from: Statistical Yearbook 1991, 1998, 2001, Tin Htut Oo & Kudo ed. Table 15.
B C=A-B D
Deductions Marketed Volume Exports
Although the farmers’ quota obligations were reduced, the paddy procurement system
itself essentially unchanged from that of the socialist period. In normal years farmers were
and received the price in advance (Okamoto 2005, p.168). The procurement price paid under
this system was kept at 40%-60% of the prevailing free market price as in the socialist period.
c. Rice Export System
Although the ban on the private export of agricultural produce such as pulses was lifted in
1988, rice exporting remained the monopoly of MAPT. The government’s priority was on
securing rice for rationing, and only the rice remaining in government hands after rationing was
released for export. Consequently, only an extremely small amount of rice was exported when
compared with the socialist period (Table 2).
One result of the government’s monopoly over rice exporting has been the separation of
the domestic and international markets which has led to a huge disparity between the domestic
and international price of rice. The domestic rice price at the free market foreign exchange rate
was 60% of the international price on average after the first liberalization. It even fell to 40%
when the domestic price collapsed in 2000-01. The international price of rice has been trending
downward over the past two decades, but the Myanmar government has kept the price of
domestic rice well below even the declining international level.
1.2 Background and Determining Factors of the First Liberalization
This section will turns to the background and determining factors of the first liberalization.
The important fact is that rice in Myanmar is a political commodity. The government has always
seen the stable supply of rice at a low price as a very important factor for avoiding political
disturbances, and the reform measures were designed with this factor in mind.
There were basically two problems that led to the first liberalization. One was the
government’s growing fiscal deficit. As noted earlier, the ration system of the socialist period
was for consumers in general. Thus as the population increased over the years, the fiscal burden
of rationing continued to expand. This can be seen in MAPT’s balance sheet figures which
recording a deficit in 1985/86 of 220 million kyats.11 This fall suggests that it was virtually
impossible for the government to raise its procurement price in response to the rising discontent
of rice farmers against the procurement system.
The second problem was the growing disinclination of farmers to produce rice. The paddy
procurement system itself created a huge disincentive for farmers.12 The system had been
revised several times during the socialist period, and by the mid 1980 it had become very severe
on the farmers with the state absorbing their entire marketable surplus. Adding further to farmer
stress was the low procurement price which remained unchanged from 1980/81 to 1986/87
while the free market price doubled during the same period. Takahashi (1992, p. 93) saw this
paddy procurement system as resting on the “good will (seidana)” of the farmers and “pressure”
from the state. But from the beginning of the 1980s, there came to be only “pressure” which
drove up farmer discontent and made them reluctant to cultivate rice.
This discontent and reluctance peaked with the government’s failure to procure a sufficient
supply of paddy at its low procurement price in 1986/87. This triggered government moves to
reform Myanmar’s rice marketing policy. To deal with the skyrocketing free market rice price,
the government introduced a new procurement scheme which bought paddy through
cooperatives in an effort to assure a sufficient supply of rationed rice to consumers. Along with
this the government issued yet another prohibition against the sale of rice on the black market in
an effort to keep the rice price under control (Kawada 1988, p.8). However, neither of these
moves achieved their aims, and it was starkly clear to everyone that the socialist rice marketing
system with strong reliance on pressure and price controls had reached a dead end.
The reason for modifying the rice marketing system soon after the broad-ranging
11
The figures were not only for rice. However, due to the overwhelming share of rice in the ration system, any increase/decrease in the volume of rationed rice had a substantial impact on MAPT’s balance sheet. Tin Soe (1994, p.21) pointed out that the deficit for rice procurement and rationing increased fivefold during the nine years from 1978/79 to 1986/87.
12
See Saito (1979), Takahashi (1992), Tin Soe and Fisher (1990) for analyses of the procurement system in the socialist period.
liberalization of agricultural marketing was also closely related to the need for the government
to assure a stable supply of rice at a low price. Even though the rice rationing system for the
general consumer was to be abandoned, that for the military and public workers was to be
maintained to secure the political base of the regime. Initially it was planned to collect paddy for
the rationed rice as land revenue from farmers and commercial taxes from traders.13 However,
the new collection system became caught up in the movement for democracy in 1988 and did
not function well with the result that the amount collected fell far short of requirement. The next
year, following the crushing of the democracy movement, the government revived the paddy
procurement system which had a very strong institutional base under the Socialist government.
In a determined effort to achieve its procurement goals, the government sought to placate
farmers by reducing the “pressure” of procuring while making efforts to obtain their “good will”.
A clear indication of the government’s new approach was the initial labeling of paddy collected
under this revised system as “good will paddy (Seidana zaba)” (Okamoto 1993, p.107).
Along with this, the government monopoly on rice exporting was utilized as a measure to
control the price of rice for the general consumer who was excluded from the rice ration system
after the first liberalization. A general deregulation of private exporting was announced only two
months after the peak of the democracy movement. But in the midst of the tense situation and
fear of further instability, the government very much wanted to keep a stable rice price for
general consumers, and it regarded the maintaining of its monopoly onrice exporting as one
means to this end. Consequently, the decision to allow private rice exporting was shelved.
In addition to this, it may be true that the government had another incentive for
maintaining its monopoly on rice exporting: it was a direct source for earning foreign exchange.
By exporting rice that had been procured at 25%-30% below the international price, the
government could earn a huge profit from the price difference; and although the exported
volume remained quite low, the foreign exchange earned per unit was large, giving the
13
government incentive to keep control over rice exports.
In the late 1990s, when the domestic rice market had for the most part stabilized, the
government apparently took a stronger interest in earning foreign exchange through rice exports.
This is evident from the fact that despite the decrease of the total volume of rationed rice, the
amount collected through the procurement system increased considerably (Table 1). If
procurement was only for rice rationed to the Budget Group, there should not have been a need
to expand the areas targeted for the procurement of rice which even included rice deficit areas.
It is clear that the rice marketing system after the first liberalization continued to place
priority on maintaining a stable supply of rice at a low price, and the underlying rationale of the
system had not fundamentally changed since the socialist period. But why could this system be
sustained for 16 years following the first liberalization? One reason was the shrinkage of the
procurement system deficit when compared to the socialist period. According to MAPT, the
deficit was 350 million kyats in 1986/87; this was turned into a surplus of 310 million kyats by
1989/90.14 Another reason was the reduction in procurement quotas for farmers. Although not as
large as the official statistics suggest (as will be discussed further in the next section), it is true
that the reduced quota obligations increased the marketable surplus of paddy per farmer when
compared with the amount they could hold under the strict system in the socialist period. This
increase, though it was not remarkable for every farmer, eased to some extent the disparity
between the government procurement price and free market price which made more farmers to
continue and expand rice production.
1.3 Problems in the State Marketing Sector after the First Liberalization
As already pointed out, the main policy objective of the state rice marketing sector after
14
According to later MAPT documents, it appears that the deficit increased again from the mid 1990s, and especially at the end of the 1990s. It is possible that this increase was because of a rise in the procurement volume. However, there is insufficient documentation to discuss the background and scale of the deficit in depth in this paper.
the first liberalization was to maintain the stable supply of rice at a low price. For this purpose,
the paddy procurement system, the rice ration system for the Budget Group, and the government
monopoly on rice exporting were utilized as the major institutional tools. This section will
discuss the problems in the state marketing sector through an examination of three areas: 1) the
procurement process, 2) the milling stage, and 3) rationing and exporting.
a. Problems in the Procurement Process
Despite the official assertion that the burden of the paddy procurement system on farmers
was eased, there were various problems in the procurement process.
First, the amount procured was fixed on a per acre basis; thus farmers with lower
productivity or less marketable surplus were at a disadvantage. Unlike the system in the socialist
period that absorbed the farmers’ entire marketable surplus, the new system had the merit of
inducing farmers to increase production. However, the demerit was that it did not reflect the
disparity in the productivity of individual farmers or take into consideration reasons for
fluctuations in yield, such as weather conditions.
Second, as Figure 1 shows,the procurement price was only revised after the disparity
Figure 1. Changes in Procurement and Farmgate Prices 0 200 400 600 800 1000 1200 1400 1600 89 /9 0 91 /9 2 93 /9 4 95 /9 6 97 /9 8 99 /0 0 01 /0 2 K y a ts/ b a sk e t 0 0.1 0.2 0.3 0.4 0.5 0.6 0.7 0.8 0.9 1 P ro cu rem en t P ri ce/ F ar m g at e P ri ce Procurement Price Farmgate price Ratio
Source: MAPT, the Author's Survey, Takahasi (2000).
This widening disparity in price is one reason to think that the real burden on farmers was not
actually lessened to the extent that official statistics indicate.15
A third problem is the likelihood of an upward bias in the production statistics as a
negative consequence of the policy of aggressively increasing rice production. The real rice
production level in some areas could have been less than the figures that appeared in the
statistics since local administrators tended to overstate production, implying the real burden of
farmers could have been much heavier than reported.
A fourth problem was the rise in the cost transportation. Normally procurement took place
at the procurement depots set up by MAPT in towns and village from October (the start of the
15
Considering that the procurement price was paid to farmers when they need money for cultivation, such as for rice planting, it has been argued that the system offered the farmers a kind of credit (Fujita 2003). However, since the government abolished the procurement system in 2003/04 and started providing advance payments, there has been less discontent among farmers indicating that the demerits of the procurement system were greater than the merits.
harvest season) until March. Farmers had to deliver paddy to designated depots at their own cost.
However, after liberalization the number of procurement depots decreased, and more often than
not farmers had to deliver their paddy to more distant depots. This increased the burden of the
farmers’ transportation costs (Takahashi 2000, p.191).
Fifthly, there were additional cost that occurred at the procurement depots (Takahashi
2005, p.56, 191), such as the frequent bribes demanded by MAPT staff. Sometimes the demands
could be so flagrant that they led to arrests for exceeding even the tolerance of the authorities.
To avoid his sort of extra cost at the depot, some farmers entrusted their deliveries of procured
rice to special brokers who could better handle bargaining with MAPT staff. As an example of
the cost for this service in 1999, farmers in a township in Yangon Division paid 8 baskets (8%)
for the delivery of 100 baskets of procured paddy. In effect, this means that farmers were forced
to bear larger costs if delivering their paddy to procurement depots on their own.
A sixth problem was the enlargement of the areas targeted for the procurement of paddy
which added to the burden of farmers in general. Looking at the percentage of procurement by
area (Table 3), one would expect the rice surplus areas (Ayeyarwaddy, Bago and Yangon
divisions and Mon State) to account for the larger share. However, the rice deficit areas (the rest
of the divisions and states) also had their shares increased, especially from around 1993/94.
Even though the procurement rate per farmer in the rice deficit areas was set lower than for the
surplus areas, their share in actual terms increased in the 1990s. This was the result of stronger
government pressure to increase rice production nationwide. Procurement quotas were raised
even for those areas where the rice production was basically for home consumption with little
Table 3 Share of Paddy Procurement by Area (%)
1991/92 1992/93 1993/94 1994/95 1995/96 1996/97 1998/99 1999/2000
Rice Deficit Areas 12.9 11.0 21.2 16.6 22.4 28.1 18.7 25.0
Rice Surplus Areas 87.1 89.0 78.8 83.4 77.6 71.9 81.3 75.0
Ayeyawaddy 47.5 55.1 38.9 42.4 37.5 40.8 42.7 35.5
Notes:
1. Rice deficit areas include Sagaing Mandalay, Magwe and Taninthayi divisions, and Kachin, Kyin, Kaya, Shan and Rakhin states. 2. Surplus areas include Ayeyawaddy, Bago and Yangon divisions and Mon State.
Source: MAPT.
A seventh problem was that procurement quotas were virtually impossible to adjust.
Officially quotas were to be determined at the township and district level based on the
performance of the previous year and actual production conditions. However, it was almost
impossible to set a target lower than the previous year without special reasons. There was
continuous pressure from the top authorities to increase or at least maintain the total volume of
procurement per area.
An eighth problem, administrative operations at the village and township levels were
greatly biased toward maintaining the procurement system which impeded the functioning of
local administration. During the procurement process in the villages, not only MAPT personnel,
but all administrative bodies in a local area were expected to be involved.16 They were all
responsible for pressuring farmers to meet their quotas. Whenever local authorities found
procurement operations lagging and the possibility of the target not being achieved, all the civil
servants in the township were sent out to the villages to encourage the farmers to meet their
procurement obligations. Finally, there was the problem of the quality of procured paddy. In
response to the government’s low procurement price, farmers tended to deliver to the depots
their lower quality paddy (such as that which was not fully dried or had been intentional mixed
16
Townships set up a special committee every year for promoting rice procurement during the harvest season. The chairman of this committee was the chairman of the Township Peace and Development Council. The MAPT township manager was the secretary, and other committee members consisted of officials from related ministries and organizations such as the Ministry of Agriculture and Irrigation.
with foreign matter) and sold their better paddy on the free market. Another factor affecting
quality was that paddy delivered to the depot was supposed to be separated into varieties, but in
practice this separation was loosely controlled and different varieties became intermixed. Thus
good quality paddy could become mixed with poor quality paddy leading to a lower grade of
milled rice. The result was that the quality of procured paddy became a big problem, the same
as it had been in the socialist period (Takahashi 1992, p.93-94).
b. Problems at the Milling Stage
The paddy collected from farmers was milled either at MAPT-owned rice mills or
contracted to private mills. As of 2000/01, MAPT owned 68 mills mainly in the major rice
producing areas. Most of them had been constructed in the 1980s with official development
assistance (ODA) from Japan or other international organizations. Many of MAPT’s mills were
large scale with a capacity of 100 tons of milled rice per day, while most private mills had a
capacity of less than 50 tons per day. There was far more paddy procured than MAPT could
handle at its own mills, so it contracted with private mills. Table 4 shows the share of milling by
MAPT and private mills after liberalization began in 1987. The share for MAPT mills was only
Table 4. Changes in the Share of Rice Milled by MAPT-Owned and MAPT-Contracted Mills.
(in millions) Procurement
Paddy Milled Rice Paddy Milled Rice (baskets) (baskets) (tons) (baskets) (tons)
1988/89 85.10 14.70 0.18 46.10 0.58 24.18 71.4 1989/90 63.00 19.10 0.24 59.20 0.78 24.39 124.3 1990/91 72.10 19.60 0.24 40.40 0.53 32.67 83.2 1991/92 74.70 20.30 0.25 45.90 0.59 30.66 88.6 1992/93 76.50 25.00 0.31 57.70 0.75 30.23 108.1 1993/94 92.30 27.00 0.34 50.90 0.67 34.66 84.4 1994/95 97.30 32.10 0.40 76.50 0.97 29.56 111.6 1995/96 92.90 27.40 0.35 67.10 0.85 28.99 101.7 1996/97 73.00 22.60 0.28 49.90 0.65 31.17 99.3 1997/98 44.70 21.70 0.27 37.20 0.48 36.84 131.8 1998/99 105.30 26.20 0.33 46.00 0.61 36.29 68.6 1999/2000 105.83 30.90 0.38 53.30 0.69 36.70 79.6 2000/2001 101.74 28.10 0.35 51.80 0.67 35.17 78.5
Source: Tin Htut Oo and Kudo (2003, p.114)
Share of Milled Rice in the Total Procured Amount
(%) Fiscal Year
MAPT Mills MAPT-Contracted Mills
Share for MAPT Mills
(%)
One reason for the high dependency on private rice mills after liberalization, even with
the decrease in the volume of procured rice, was the run-down condition of MAPT mills. These
facilities could not be maintained or repaired after the halt of ODA following the government’s
suppression of the democracy movement in 1988. Also the chronic shortage of electricity
greatly lowered their rate of operation as most of MAPT’s mills were power by electricity. Some
mills operated only 6-10 hours a day because of blackouts although they had 24-hour operating
capacity.17
The biggest problem with the milling of procured paddy was the low milling fee paid to
contracted private mills. It was half to one-third of the prevailing free market milling rate. For
example, in 1998/99 the market milling fee was 20-30 kyat per basket while MAPT paid only
10 kyat per basket. The government kept this low milling fee in order to curb the growing
expenditures incurred by the state marketing sector. This meant that not only the farmers but
also the private millers were burdened by the rice rationing system.
17
c. Problems Related to Rationing and Exporting
The quality problem of procured paddy, which was pointed out above, had two results.
First, although the rice ration system was a benefit to recipients in terms of volume and
price, this was not sufficient enough to overcome the inferior quality of the rice, which led
recipients to sell it to traders as feed for livestock rather than consume it at home.18 The
increasing availability of a wide variety of rice at varying prices on the free market, as will be
seen later, further accelerated this trend. Consequently, the rice ration system no longer worked
as a benefit to its recipients as the government originally intended.
Second, the inferior quality of procured paddy limited the destinations for exported
Myanmar rice. A breakdown of Myanmar’s rice exports (Table 5) shows that most go to South
Asia, Africa and Southeast Asia which have a large share of the world’s low-income countries
where demand for low quality rice is high. Myanmar rice has failed to generate stable export
demand because of its export regime which depended greatly on the state marketing sector. Due
to the nature of the state marketing sector to place importance for quantity of supply rather than
the quality, Myanmar was not able to meet demands for wide range of quality to expand the
export.
18
Relatively affluent people tended to purchase rice on the black market during the socialist period. However, it is likely that the compulsory delivery system absorbed not only the surplus for sale but also part of the rice for home consumption of farmers. Therefore, the volume of rice sold in the black market could not have been large and most of the rationed rice was actually consumed during the socialist period.
Table 5. Breakdown of Myanmar Rice Exports
(%) Destination 1990/91 1991/92 1992/93 1993/94 1994/95 1995/96 1996/97 1997/98 1998/99 1999/2000 2000/01 Southeast Asia 11.2 25.7 2.0 6.1 61.0 73.7 50.5 3.6 55.0 36.4 18.3 South Asia 49.3 26.2 37.7 18.8 9.5 7.3 21.5 96.4 15.8 41.8 69.3 the rest of Asia 0.0 4.9 0.0 3.1 0.0 5.1 0.0 0.0 0.8 0.0 0.0 Africa 29.9 43.2 57.3 66.7 26.5 6.5 26.9 0.0 25.8 0.0 10.0 Middle East 2.2 0.0 3.0 1.1 0.0 0.0 0.0 0.0 0.0 0.0 0.0 North and South America 7.5 0.0 0.0 0.0 1.4 7.3 0.0 0.0 0.0 0.0 0.0
Europe 0.0 0.0 0.0 4.2 1.5 0.0 1.1 0.0 2.5 21.8 2.4
Total 100.0 100.0 100.0 100.0 100.0 100.0 100.0 100.0 100.0 100.0 100.0 Source: Statistical Yearbook (1997, 2001)
2. The Private Rice Marketing Sector after the First Liberalization
2.1 Development of Private Marketing Sector
The rice ration system and its supporting procurement system were scaled back after the
first liberalization, and the private sector came to play a larger role in supplying rice to the
general consumer. The first liberalization abolished the restrictions on private millers and
traders, and the geographical restrictions on rice trading that existed in the socialist period were
basically lifted (Okamoto 2004, p.165-166).
The shrinking of the state marketing sector along with the government’s policy in the
1990s to raise rice production brought a steady increase in the volume of rice on the free
market.19 The volume reached 30%-40% of total production by the end of the 1990s (Table 2).20
19
For analyses of the government’s policy to increase rice production in the 1990s, see Fujita ed. (2005, Chapter 5), Takahashi (2000) and Fujita (2003) and Kurosaki et al. (2004).
20
This estimation is based on the official statistics. As Fujita points out (Fujita 2003, p. 310), there can be some upward bias in yields in official figures, especially since the late 1990s. The volume percentage shown here is based on the officially estimated average yield of around 60-65 baskets per acre since 1995/96. However, according to field surveys by authors, there is a greater number of areas where the average yield for monsoon paddy is around 50 baskets per acre which is 20% lower than the official figures. Thus, if the estimation is made based on this 20% lower figure, the marketed volume of rice for 2000/01 decreases from 46% to 27%. In this estimation, however, the calculation of home consumption does not differentiate between adults and children. Thus, the volume for home consumption could be less than these figures suggest. Therefore, the marketed volume for 2000/01 could have been between 27% and 46%.
This section will examine how the private marketing sector developed in the midst of the
increasing volume of marketed rice, focusing especially on the qualitative changes of the
marketing system.
One important change was the spread of marketing over wide areas of the country.
Myanmar has a diversity of agronomic environments, and not every area of the country is
suitable for rice cultivation. Therefore rice has to be transferred from surplus to deficit areas.
The rice flows are shown in Figure 2.
Figure2. Flow of Rice
The major commodity flows are from Lower to Upper Myanmar and Lower Myanmar
to coastal areas. Rice is transferred via Upper Myanmar to the mountainous frontier areas.
Yangon, the capital, functions as the central marketing point from which the flow of rice reaches
3-3.4 million tons annually (average figure for 2000-2002) (MOAI, MIS, various issues),
accounting for 34% of the total marketed volume per year indicated in Table 2. The rice
assembled in Yangon is transferred to markets in Upper Myanmar and the coastal areas while
also feeding the capital’s four million people. During the socialist period, only a scant volume of
milled rice was marketed which had slipped through the mesh of government regulations. But
now it is traded in large volumes over wide areas of the country.
The price trend of rice in different areas of the country is another indication that rice is now
being marketed over a wide area. Figure 3 shows the change in the price of rice of similar
quality in six different areas. Yangon, Mawlyamyaine and Pyay are in rice surplus areas;
Mandaly and Pakkoku are in rice deficit areas, while Taunggyi is an important
collection/transfer market in a rice deficit mountainous area. Figure 3 shows that the prices in
the six areas moved closely with each other, although the prices in deficit areas were higher than
those of surplus areas as would be expected.
Figure 3. Changes in the Rice Prices in Diiferent A reas (2002)
0 2000 4000 6000 8000 10000 1 2 3 4 5 6 7 8 9 10 11 12 Month Ky a ts/ b a g
Yangon (Em at a) Mawlamyain( Emat a) P yay(Manawt huka) Mandalay( Manawt huka) P akkok( Zeeyar) T aunggyi( Zeeyar)
A second change was the entry of private rice millers and traders who expanded the
volume of marketed rice. The number of private rice mills increased throughout the 1990s. This
was mainly due to the sharp rise in the number of small mills in the villages (often called huller
mills which have a capacity below 15 tons per day). The exact number of these small rice mills
is not available, but there are normally one to five of them in each village tract. For example, in
a township in Yangon Division, where the author conducted a survey, there were 200 of these
small mills.21 The township has 64 village tracts, which would mean that each village tract had
3.1 rice mills on average. Assuming that there are two rice mills in a village tract in the major
rice producing areas (e.g., Ayeyarwaddy, Bago, Yangon and Mandalay divisions and Mon State),
the total number of these small mills could be as high as 14,240. However, it is not unusual for a
village tract to have more than 2 rice mills, so the above figure is a rather conservative estimate.
The establishment of small rice mills was first permitted officially from around 1992/93; thus
the dramatic increase in the number of these mills has taken place in the short time since then.
Most of these mills handle paddy for home consumption in the villages, while only a few
engage in milling for sale on the free market. The owners of these small mills are often farmers
who do not have sufficient capital to invest a high quality machines. Thus, the efficiency of
these mills is often low, and the quality of their milling poor. Oftentimes the rice they have
milled, even when of the same variety, can be sold only at lower prices.22
Not only the rice millers, but a large number of traders also entered the rice market.
According to the author’s survey of 47 wholesalers in eight major rice markets (Pathein, Pyapon,
Mawlamyaingyun, Myaungmya, Yangon, Pyay, Mandalay, Pakkoku), 39 wholesalers (84.8%)
began rice trading after liberalization in 1987, and only five (10.9%) were doing so before
then.23 By far the greater share of rice traders entered the market after liberalization. The
formation of marketing networks over wide areas of the country as well as the increase in the
21
Author’s survey in 1999.
22
This is especially the case for the high quality rice.
23
volume of marketed rice produced by farmers encouraged the entry of traders, especially in the
late 1990s.
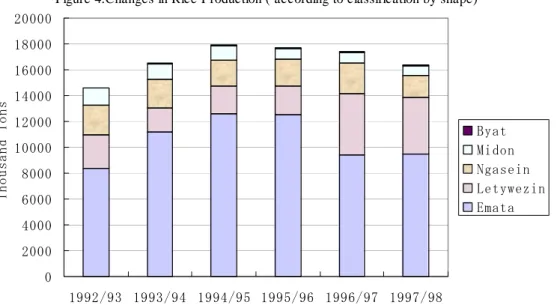
A third change was progress in the differentiation of rice varieties and production areas.
This indicates a growing preference for high quality rice in Myanmar, although low- and
medium-grade rice still predominates in the domestic market. The share for rice classified as
Emata and Ngasein (classifications according to shape),24 which are two groups of low- and
medium-grade rice, accounted for a high share of total production even in the 1990s (Figure 4);
thus their share of marketed volume was also large.
Figure 4.Changes in Rice Production ( according to classification by shape)
0 2000 4000 6000 8000 10000 12000 14000 16000 18000 20000 1992/93 1993/94 1994/95 1995/96 1996/97 1997/98 Thou sand T ons Byat Midon Ngasein Letywezin Emata Source:MOAI(2001). 24
In the British colonial period, rice was classified according to the nurturing duration at the farm level (Kaukkyi, Kauklat and Kaukyin for long, medium and short nurturing varieties). Myanmar’s rice traders adopted classifications according to shape (length and width), such as Emata, Ngasein, Midon, Letywezin and Byat (Cheng 1968, p.36-39; DOA 1936, p.12-14; MOAI 2004, p.46). These classifications continue to be used, but since the introduction of high yield varieties in the late 1970s, classification by variety name has become more common. However, the government’s procurement operations and the official statistics as well continue to be based on classification by shape.
It is rare for these two groups to be traded based on their individual variety names. Their
prices are generally low (Figure 5), and the greatest demand for them comes from the low- and
middle-income classes. The demand for rice of the Ngasein group, which is of low quality, is
generally high in Upper Myanmar where a larger number of the country’s poor areas are located.
Ngasein group rice is generally referred to as “rough” rice, but it is preferred by the poor
because its volume increases when cooked. Rather than quality, these people want rice that fills
the stomach.
Figure 5 Changes in Wholesale Rice Price(in Yangon according to Group)
0 1000 2000 3000 4000 5000 6000 7000 8000 9000 1 3 5 7 9 11 1 3 5 7 9 11 1 3 5 7 9 11 2000 2001 2002 K y at /B ag Posan Ngakyue Emata Ngasein
Source: MIS(various monthly issues).
Since the 1990s, differentiation by variety has progressed for some types of rice that have
a certain added value. These are traded by individual variety name and not by group
classification according to shape. Also their prices are determined by quality and production
area. The best example is Pawsan Hmwe, a type of fragrant rice of high quality that is produced
in the Ayeyarwaddy Delta. Pawsan Hmwe belongs to the Midon group when classified by shape.
Looking at the price change for various types of rice (2000-2002), Pawsan Hmwe on average
minimum of 24% higher (Figure 5). The price of Pawsan Hmwe differs depending on the area
of production and quality. For example, that produced in Pyapon in Ayeyawaddy Division is
regarded as high quality and is priced 10%-20% higher than the same rice of regular quality
(MIS, 2002). 25
The trend toward quality among consumers is most evident in Yangon which is the largest
rice consuming area in the country. The brands of some wholesalers, especially those dealing in
high quality rice, have come to be valued highly, and consumers now equate some specific
brands with high quality. For this reason, some wholesalers in Yangon started to sell their rice in
bags printed with their logos, a trend that became popular especially from the late 1990s. To
secure the consumer’s trust wholesalers had to maintain high quality. This required them to
select rice mills carefully and check the quality of milling when purchasing rice.
In the past, rice was looked upon as a basic food, and there was less concern about quality.
But consumers emerged who demanded better quality rice, and traders in large numbers
responded to this demand. This significant change in the Myanmar economy came about with
the development of private rice marketing following liberalization of the rice market sector.
Fourth, changes in the means of transportation were an important factor for expanding the
area of rice marketing in the 1990s. There was a substantial shift from water to land
transportation. Water and rail transportation had been the major means of transportation in
Myanmar since the colonial period. Even today when rice is transported directly from producing
areas in the Delta to collection markets in Upper Myanmar, such as Pakkoku, water
transportation is still widely used. In Yangon Division as well, about 50% of all rice is
transported on waterways.
However, if we look at the change in the absolute volume of rice shipped by water, by
25
While their price comparisons are not as detailed as for Pawsan Hmwe, there are other varieties in strong demand and which are priced by the name of the variety. Some examples are Shwebo Manaw (the variety preferred in Upper Myanmar and produced in Shwebo; it belongs to the Letywezin group), and
2001/02 it had decreased to one-fifth of that shipped in 1990/91,and to only one-tenth of that in
1980/81 (Central Statistical Organization, 2002).26 In its place, truck transportation gained
dramatically in importance during the 1990s. Behind this growth lay the gradual development of
the country’s highway system. The total length of miles increased about 30% in the 11 years
from 1990/91 to 2000/01 (Central Statistical Organization, 2002), and the number of trucks
(second-hand) increased 40% during the same period.
One clear reason for the rapid growth of land transportation was shortened
transportation time. For example, if water transportation is used to move rice from the Delta to
Pakokku, it takes well over one month, but it only takes several days if transported by truck.
There are two benefits from the shortened transportation time. One is the lessened risk of
deterioration in quality. If transported for a month in Myanmar’s scorching heat, the quality of
rice is certain to deteriorate. However, if it is transported by truck, deterioration can be
minimized. The second benefit is the acceleration of commodity turnover. This is quite apparent
in transactions on the Yangon market where there are more traders wanting to collect payments
as quickly as possible to use as capital for purchasing the next shipment of goods. With greater
speed of commodity turnover, traders can increase the volume of their transactions. In this sense,
the expansion of truck transportation has not only helped expand the area of marketing, but has
also helped increase the volume of transactions and the profits of traders.
A fifth change was the shift of traders from informal methods to using formal institutions
for raising capital and settling accounts. Previously, most rice traders depended on loans from
relatives and acquaintances for their working capital. Even for settling bills, they often utilized
26
About 21% of the rice shipped to Yangon was transported by truck to the Bayintnaung Market, according to the average figures for 2002 (MOAI, various monthly issues). The remaining 79% was shipped by water. Of the volume transported by water, 50% was sent from the Delta to the Lamadaw and Bodataung areas. The rice shipped to these areas is often reloaded onto trucks for transport to the Bayintnaung Market where many of the rice wholesalers have their stores. Thus, along with the development of the road system in the Delta, the truck transportation has increased to avoid the reloading process.
the informal remittance system called “Hondi”,27 or if not they accompanied the commodity and
paid the price directly. However, after the government allowed the establishment of private
banks in the early 1990s, 20 private banks came into existence in the country. Further, branch
networks expanded even into some rural areas, and account settlement through banks increased
quite dramatically. In one rural area (Pakkoku), a new 21-day short-term loan scheme with an
upper limit of three million kyat was introduced to provide working capital to local rice traders.
However, this scheme continued only up to the early 2000s. After the financial crisis in 2003,
large banks were forced to close. This seriously hampered utilization of the banking sector for
loans and account settlements, and many traders reverted to relying on informal loans and
remittances. The development of the financial sector has yet to recover from this setback.
One more change was the development of infrastructure for conducting transactions,
especially on the Yangon market. The Myanmar Rice Wholesalers Association took over
responsibility for managing the rice trading center in Yangon and helped improve the market’s
efficiency and the environment for conducting transactions. The rice trading center is open to
anyone who pays the entrance and annual fees, the number of members has been increasing
annually (it had 6,000 members in 2002). In 2003, 500-600 traders visited the center every
morning and transactions took place through negotiations with traders presenting different
samples of rice. The center keeps records of the daily prices and volumes of rice traded, and
these records are provided to the rice traders and to government organizations. This helps
traders to judge the current market condition at least for Yangon market.
27
In this system the amount of money for a transaction is not paid to the seller directly, but to the hondi agent located in the area where the buyer lives. The hondi agent in the seller’s area pays the amount to the seller after receiving confirmation from the agent in the buyer’s area that the amount has been received. The money the hondi agents use for payment is the money that has accrued from previous transactions for other traders. Therefore, for the system to function, there have to be various kinds of commodity transactions taking place for the hondi agents on both sides.
2.2 Problems that Private Rice Marketing Sector Has Faced
In the previous section we noted various positive aspects of private rice marketing in
Myanmar after the first liberalization. However, there were also problems in the development
process, and these were closely bound with the official rationale of the rice marketing system
which was the maintaining of a stable rice supply at a low price. The private rice marketing
sector did not dare to interfere with this rationale. Consequently, the sector had to limit the
scope of its transaction activities to dealing in the government’s procurement operations (for the
Budget Group) and to the domestic rice market. This next section will discuss the problems for
rice millers. This will be followed by a discussion of those faced by rice traders.
a. Problems Facing Rice Millers
It was pointed out earlier that there was a remarkable rise of small rice mills in rural areas
in Myanmar. However, contrastingly enough, mid and large-scale rice mills (mills with milling
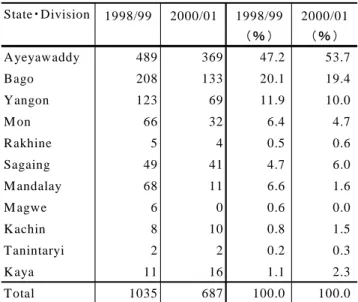
capacity more than 16 tons of rice per day) decreased in numbers. Table 6 indicates the changes
in the number of MAPT registered mid-and large rice mills.
Table 6. Number of M id- and Large-scale Private M ills Registered with M APT
State・Division 1998/99 2000/01 1998/99 2000/01 (% ) (% ) Ayeyawaddy 489 369 47.2 53.7 Bago 208 133 20.1 19.4 Yangon 123 69 11.9 10.0 M on 66 32 6.4 4.7 Rakhine 5 4 0.5 0.6 Sagaing 49 41 4.7 6.0 M andalay 68 11 6.6 1.6 M agwe 6 0 0.6 0.0 K achin 8 10 0.8 1.5 Tanintaryi 2 2 0.2 0.3 K aya 11 16 1.1 2.3 Total 1035 687 100.0 100.0 Source: M APT, Tin Htut Oo & K udo (2003, Annex 7)
The figures show that the number of these rice mills decreased greatly in only two years.
Another example of this big drop comes from the author’s 1999 survey. There were 13 mid- and
large-scale rice mills in a township in Yangon Division, but only seven of the mills were
actually operating. The other six had closed down.
The great majority of these big rice mills had been established during the British colonial
period or the socialist period. Those opened during the colonial period had played a primary role
in making Myanmar one of the giant rice exporters of the world. However, when rice exporting
became a government monopoly in the socialist period, these rice mills were required to mill the
government procured paddy at the official fixed rate, though they were not nationalized in the
strict sense. After the first liberalization in 1987, these mid- and large-scale mills also started
operating in the private rice market. But business was difficult because of their large capacity.
The main reason that the rice mills closed down in the township stated above was capacity
underutilization.
One reason for this underutilization was the decreasing demand for milling at mid- and
large-scale rice mills. The rapid increase in the number of small mills in the villages following
the first liberalization reduced the need to transport paddy to the distant big mills and their rate
of operation declined. Before liberalization the rice for rural household consumption was milled
at the big mills located in town. But during the 1990s this rice came to be processed mostly at
the newly established village mills, and the big town mills lost business. Competition also arose
from some rice traders, especially from those in Pathein and Myaungmya in Ayeyarwaddy
Division, who procured paddy over a wide area. These traders set up their own rice mills. As
noted earlier, the rice price can fluctuate widely on the Yangon market, and the timing of
transactions has a big impact on the profit of traders. If the rice sent to Yangon has to be milled
at one of the big mills, traders sometimes have to wait their turn which can make them miss the
best timing for a sale. To avoid this problem, some traders set up their own mills, even if these
mills, and in an effort to raise their rate of operation, some of these big mills turned from the
specialization on custom milling and started regular milling whereby the mill bought up and
milled paddy at its own expense and then sold the rice itself. This was another indication of the
unfavorable business conditions facing the big rice mills.
A second problem for mid- and large-scale rice mills was that the milling of MAPT paddy
often became a burden both financially and physically. Even though MAPT bore the cost of
labor for the milling of its paddy, big mills contracted by MAPT still often found that milling for
the organization did not pay. The mills also needed to handle all the cumbersome procedures to
abide by the requirement that MAPT prescribed.28 There were also cases where MAPT required
mills to store its paddy or milled rice for medium to long periods without paying any charges.
These mills were then hard pressed to find space to store their own rice or paddy. From the
statistical figures, government dependency of rice storage on the private sector is less than 10%
(Okamoto 2004, p.170). However, considering the above examples of required storage, it was
very likely more than that. All these difficulties made the big rice mills reluctant to contract with
MAPT. Table 7 shows the change in the number of mills contracted by MAPT to mill
government procured paddy. It has been declining over the past decade. This can be interpreted
as reflecting the general reluctance of private rice mills to contract with MAPT.29
28
One example of the quality check burden was the report that even though contracts prescribed a rate of 25% for broken rice, millers were sometimes required to meet a rate of 15% at the time of quality inspections.
29
The year 2001/02, although showing a decline, was not an ordinary year. MAPT increased rice exports that year, and it had to contract with more private mills for these exports. To attract mills, it raised its milling fee to 30 kyat per basket which was close to the market rate. This attracted even those mills that had never contracted with MAPT before. Thus the figure for contracted mills in 2001/02 was likely rather higher than it otherwise would have been. MAPT also resorted to coercive methods to employ mills. In some areas it notified mill owners that their milling licenses would be revoked if they refused to contract with MAPT.
Table 7. Number of Private Mills Contrated to Mill MAPT Paddy Division/State 1991/92 1995/96 1998/99 2000/01 Ayeyawaddy 220 208 144 138 Bago 173 136 100 51 Yangon 75 61 49 38 Mon 40 37 30 43 Rakhine 19 15 12 0 Sagaing 101 81 78 68 Mandalay 56 66 38 39 Magwe 32 19 20 15 Kachin 20 25 14 14 Tanintaryi 19 14 12 17 Kayin 9 1 1 0 Kaya 1 1 1 0 Tota; 765 664 499 423
Source: MAPT, Tin Htut Oo & Kudo (2003, Annex 5)
While the long-term trend of private rice mills has been away from MAPT, there are mills
that find a benefit in contracting to mill MAPT’s procured paddy. One reason is that they can at
least secure a certain amount of paddy to continue operating. With general demand decreasing
for milling at mid- and large-scale mills, they need to find ways to keep themselves running. It
is a rather passive response. But they have workers to pay, and they see it as better to get
whatever paddy they can to keep operating. Another reason is the deterioration and
obsolescence of their milling facilities. These mills have found that they cannot meet the quality
demanded of rice for sale on the free market. However, when milling for MAPT, the quality is
less important. These are rice mills that are less inclined to expand their business or improve
quality, so they are willing to contract with MAPT. Most of the rice mills that have closed down
in recent years have been these sorts of passive operators who have relying mainly on milling
MAPT paddy for their business.
But the biggest problem facing the mid- and large-scale mills is the dilapidated condition
of their milling facilities and equipment. Important parts of these mills, such as engines, are now
very old and have been in use since the 1930s; the most recent are from the 1960s. A survey by
millers who had started business after the 1987 liberalization had often not constructed
completely new mills; rather they had made use of second-hand equipment or had purchased old
mills. In the survey, there were 22 mid- and large-scale mills; seven of them were new entrants
into the business, but only two of these were constructing new facilities. The other five had
purchased old, second-hand mills. Even with new ownership, the cost and maintenance of
running these old, second-hand mills with their worn-out equipment can be very high. But no
support or assistance for maintenance or improving efficiency has been forthcoming from the
government despite its dependence on the big mills for milling state procured paddy.30
In the view of most of the big rice mills, any substantial investment to upgrade facilities
and improve quality will not pay given that the market is still dominated by trading in medium
and low quality rice. Replacing their steam engines with electric motors would in all likelihood
lower their rate of operation because of the chronic shortage of electricity. The limited supply of
spare parts at reasonable cost and sufficient quality has also detracted from the willingness of
millers to undertake new investment. The great majority of mid- and large-scale millers say that
they are ready to undertake new investment once private rice exporting is allowed and the
market for high quality rice expands. This clearly indicates that the present condition of
Myanmar’s rice market, characterized by government restrictions on exporting and the
dominance of low and medium quality rice, has narrowed the business opportunities for big rice
millers, and this in turn has narrowed their business perspective.
b. Problems Facing Rice Traders
The first liberalization gave rice traders the freedom to deal in the domestic rice market,
and this new market environment encouraged the entry of new rice traders. However, this new
freedom was only on the condition that their dealings did not jeopardize the government’s rice
policy. Herein lay the nature of the first liberalization. Rice traders were not entirely free from
30
During the socialist period, there was some loan assistance to private mills from the Asian Development Bank.
government intervention. There were three situations where the government intervened in the
domestic rice market.
One was when rice transactions were done with remote regions. In general after the first
liberalization, there were no longer any restrictions on the marketing of rice over a wide area of
the country. However, transactions with some remote regions bordering neighboring countries
were an exception. These regions were Shan, Chin and Rakhine states, and Tanintharyi Division.
For any rice transactions with these regions, it was necessary to get permission from the local
authorities (the State or Division Peace and Development Council). For some regions, there was
a set monthly quota for the volume of rice to be transacted.31 The rationale of this regulation, of
course, was to keep the domestic rice price stable. With Myanmar’s domestic rice price kept far
below the international price, if sizable amounts of rice were exported (even informally) to the
neighboring countries of Thailand, China, India and Bangladesh, there would be inevitable
upward pressure on the domestic rice price. To prevent this, the authorities made every effort to
strictly regulate the volume of rice transacted with these remote regions. This regulation actually
made the people in these regions, which are rice deficit areas, pay a high price in relative terms
for the rice they consumed.32 Nevertheless, the government put tight controls on the transactions
of rice with these remote regions because it placed top priority on maintaining a stable price for
the domestic rice market as a whole.
The second situation was when the volume of procured rice fell below the government’s
31
For example, when rice wholesalers in Tanintharyi procured rice from Yangon, they had to submit the planned amount of procurement to the Tanintharyi Peace and Development Council every month. At the same time, the selling trader in Yangon also had to submit it to the Yangon Peace and Development Council. In the case of northern Shan State, buying traders in the state had to submit the volume of purchase to the Mandalay Peace and Development Council where the selling traders were located. For the sale of rice to traders in Chin State, traders had to submit the transacted amounts to the Peace and Development Councils where both the buying and selling traders were located. In Rakhine State as well, there were strict regulations when rice was transferred to townships in the northern part of the state. (This information is based on field surveys done by author in 2001-03).
32
According to the author’s survey in 2001, the retail rice price in these remote regions was higher by 10%-20% compared to the average rice deficit area in Upper Myanmar.