Sustainable Development
著者
OTA Tatsuyuki
雑誌名
アジア文化研究所研究年報
号
49
ページ
213-199
発行年
2014
URL
http://id.nii.ac.jp/1060/00007398/
Sustainable Development
OTA
Tatsuyuki
要旨: 持続的発展を考慮した海外投資の必要性が次第に高まっている。持続的発展にとって望ましい海 外直接投資は筆者が開発した相対的ランク指数(RRI)に基づいて分析した結果、比較的小規模で、 かつ国連の人間開発指数の高い先進国が上位の投資先であった。しかし多国籍企業が投資先として 優先する国は必ずしも人間開発指数の高くない BRICs や途上国を含む高成長が見込まれる国であ り、持続的発展の要請から乖離した現実の企業活動が問題視される。 IntroductionDuring the 1980s and 1990s there was a remarkable wave of internationalization of the world economy, maintained by an increasing flow of capital. Growing international capital flows have given rise to global interdependence of the economies, reinforcing the globalization process, leading to high economic growth in the 1990 while posing a limit to environmental preservation. Thus, the mobility of international capital flows has gained importance not only from development point of view but also from a point of sustainable development (henceforth=SD). The issue of sustainable development seeks to balance economic, environmental, and social dimensions of development in a global perspective in which foreign direct investment (FDI) is expected to play an important role.
Here in our survey, a tentative experiment is made by introducing a new approach to investigate into an appropriate location/ country for sustainable investment, using four available indicators, i.e. GDP per capita, Happy planet index(HPI), Human development index (HDI), Environmental performance index (EPI) as proxies for corresponding components of sustainable development. By applying our newly developed concept of Relative Ranking Index (RRI), provisional results suggest that rather small-sized, high income, developed countries tended to rank high for SD investment. Theoretically those countries are likely to attract FDI from investors willing to invest in the countries with prospects for sustainable development. However, still many of transnational corporations (TNCs) seem to prefer countries with higher business prospectives in their overseas operations. Even so TNCs as investors are increasingly pressurized to take into account the impacts of FDI on host states and to integrate the SD into their global strategies over the past decades while a growing number of developing countries as host states with their lower international rankings by economic, social and environmental indicators are requesing investors to observe ethical SD standards. For them, an inflow of FDI from TNCs is still indispensable for economic growth, and critically important for sustainable development to bring about fundamental changes in production and consumption that may alleviate environmental degradation. It was found that countries qualified for sustainable development with higher RRI indices were not necessarily regarded as prospective for TNCs.
There seems to be increasing needs for the conflicting interests to be reconciled between investors and host states, and between profit motives and sustainable development, thus some coordination at the industrial,
national and international levels, or some new type of regulatory frameworks of investment may become necessary for an increasingly interlinked network of globalized production.
I.1 Increased role of FDI as a Determinant of Sustainable Development
As more and more developing countries have paid an increasing attention to the issue of SD, a growing number of TNCs have attempted to integrate SD issue into their global strategies over the past decades. An inflow of foreign investment is critical for sustainable development in developing countries. Thus the role of foreign investment is of uttermost importance to achieve SD, though the nature of inflow of foreign capital is rather unstable and vulnerable.
Until toward the end of 1990s the weight of SD was rather limited as a determinant factor of FDI. The SD variable as a determinant itself was regarded as nominal and minor determinant of FDI. However, the concept of sustainable investment has gradually caught attention of both public and private sector, and the SD has become increasingly an important factor as a determinant of FDI though it is not easy to specify it quantitatively. While at the same time investing TNCs were increasingly pressurized to take into account the impacts of FDI on SD in the host states, such as to what extent FDI would generate effects upon SD, as well as on three components of SD, i.e. economy, environment, and society. Investment has produced various effects, both positive and negative, on SD in host countries. However, measuring and quantitative approach to the SD is entangled with complexities involving areas ranging from economy, environment to social concerns that are highly interrelated among them. It is widely observed that progress on one front will have positive or negative spillovers on the other in some areas.
As a result of a rapid increase in the FDI inflow into developing countries since the early 1990s partly aided by loosening their investment regulations, the combined shares of developing countries and transitional economies rose to over 50% of global FDI inflow in 2011 (UNCTAD, 2012 ) . The upsurge in FDI substantially changed the international economic landscape.
The growing importance of the developing countries as host states might be related to their rather lax regulations concerning pollution control compared with those of developed as the TNCs from developed countries have often taken advantage of less stringent pollution control by locating their plants in those developing countries (“Pollution haven” hypothesis).
As international production and consumption shifted to developing and transitional economies, TNCs are increasingly investing in both efficiency- and market-seeking projects in those areas, which have considerably brought forth substantial environmental degradation.
II.1 Changing Regulatory framework for International Investment
Confronting worsening environment world over, some kind of legal arrangements will need to be introduced in the regulation of international flow of foreign investment to achieve global sustainaible development.
The International Investment Agreement (IIA) that was first concluded over half a century ago1 when international investment began to increase, has undergone qualitative and quantitative transformation since then. The IIAs were initially designed for a much narrower role than present day agreements, since political and economic contexts were quite different from today’s. In the early 1960s there was almost no reference made to environmental problem in the IIA. The developed countries pushed the IIAs as investors with a view to providing legal protection to their investors who ventured riskier overseas investment without paying due
attention to environmental preservation.
Among various forms of IIAs, a bilateral investment treaty (BIT) that was basically intended to ensure legal protection of investors, was the most common form of investment agreement between developing host economies and industrialized countries.
It was from the late 1980s when things began to change as there was a significant increase in FDI throughout the world. Until then many of host developing countries were rather wary about inflow of FDI due largely to their colonial history. So they first imposed restrictions on the FDI inflow for the purpose of protecting and fostering domestic industries, and in part to prevent the outflow of foreign exchange reserves.
However, partly because of shortage of capital they began to sign BITs as perception of the role of FDI changed in recognition of its impact on economic growth, and their host country’s stance shifted from initial anxiety about FDI to a more welcoming one. Thus from the early 2000s, BITs proliferated despite the asymmetry of BIT benefits between foreign investors and host countries largely in favor of Western industrialized countries. In fact, more than half of world BITs were signed by Western European countries led by Germany until the early 2000s. Only PR China, one of major recipient countries, was only developing country in top five countries that had concluded BITs at the time. In Asian developing countries the BITs were almost non-existent in the early 1960s, though they had rapidly grown in number since the late 1980s (Asian Development Bank, 2004). Compared with industrialized countries, Asian developing economies had generally less strict domestic environmental regulations in their BITs 2.
However, along with a growing awareness of environmental conservation, a number of IIAs increased in the form of international environmental treaties at the bilateral, regional and interregional levels, reflecting voices and the momentum generated by series of international conferences such as the 1972 UN Conference on the Human Environment in Stockholm and the 1992 UN Conference on Environment and Development (UNCED) in Rio, the 2002 World Summit on SD in Johannesburg, the 2009 UN Climate Change Conference in Copenhagen, and the 2012 UN Conference on SD in Rio. As a result, there exist all together about 3100 IIAs agreements including 2800 BITs (as of end 2011) (UNCTAD, 2012).
When we look into global trend of regulatory framework of FDI, two simultaneous but conflicting moves are included in many investment laws since 1950s(UNCTAD 2010). One is, to further liberalize investment regimes to attract FDI, and the other; to regulate FDI in pursuit of broader policy objectives. Two distinct moves can be roughly contrasted between two periods: 1950s – 1980s and 1990s – late 2000s. The regulatory trends in FDI during the former period prevailed when environmental concerns were limited with little reference to SD, whereas an overall investment policy in general has shifted to liberalization- oriented during the 1990s – the late 2000 when the SD gradually caught attention. However, as Table II-1 shows, an overall world investment trend in terms of a number of changes made in the IIAs from the early 1990s is indicative of a rising percentage of regulatory/ restrictive national measures 3 installed with increased reference to the SD until 2009 when this percentage rose to over 30%, the highest since 1992 (UNCTAD, 2011). However it should be noted that investment trend which seems to be moving for restrictive direction is not necessarily contradictory to overall general FDI trend toward liberalization despite with their increasingly stricter environmental regulations installed.
Table Ⅱ-1 National Regulatory Changes in International Investment Agreement : 1992 - 2011
note: Percentages are derived by the author
source: Data from UNCTAD, World Investment Report 2010 & 2012
II.2 Development of Investment Treaty for Sustainable Development
The integration of environmental concerns into IIAs has been on the negotiators’ agenda for many countries since the mid 1990s due largely to an increased number of disputes 4. However, overall regulatory restrictiveness measures in the IIAs were in the direction for liberalization, loosening investment regulations since then as mentioned above. In fact, many of developing countries, long resistant as host states to certain principles embodied in those investment agreements, gradually shifted their strategies for attracting foreign investment that have considerably contributed to a rapid increase in FDI inflow. Some critics go far as to say that the growing importance of the developing countries as host states might be partly related to their rather lax regulations concerning pollution control compared with those of developed economies as the TNCs from industrialized nations have often taken advantage of less stringent pollution control by locating their plants in those developing countries (“Pollution haven” hypothesis) 5 since developing countries had long laid more emphasis in their development policies on inflow of FDI and less emphasis on control of pollution by regulation.
However, due to growing environmental concerns, a new type of IIA has been emerging with a number of features to ensure that it contributes to countries’ SD strategies focusing on the environmental and social impact of investment. As a general regulatory framework of the IIA of a host country has become increasingly stricter , investors are facing with an increasing pressure to pay attention to the SD. Nonetheless IIAs do not appear much to be promoting SD in their current form of agreement. Actually, it is said that the content of the law of sustainable development is still in the process of being articulated, and that not so many developing countries have incorporated SD norms in IIAs 6. In real business world, however, there are some signs indicating that things seem to be changing for the better. According to one recent survey (Rivera and Oh,
Item 1992-1993 1994-1995 1996-1997 1998-1999 2000-2001
Number of countries that introduced changes 99 112 142 125 141 T : Number of regulatory changes 177 222 264 284 357 A : Liberalization / Promotion 176 214 232 266 340 B : Regulation / restrictions 1 8 32 18 17 (B/T) X 100= % of Regulations (%) 0.01 0.04 0.12 0.06 0.05
Item 2002-2003 2004-2005 2006-2007 2008-2009 2010-2011
Number of countries that introduced changes 154 195 149 104 101 T : Number of regulatory changes 488 473 275 208 179 A : Liberalization / Promotion 452 396 216 154 127 B : Regulation / restrictions 36 77 59 54 52 (B/T) X 100= % of Regulations (%) 7.40 16.30 21.50 26 29.10
2013), TNCs are increasingly recognizing environmental values in their investment behavior as there was a higher level of TNC entry into foreign countries with environmental regulations that were more stringent than their home countries. This is indeed quite a change as many former studies found no evidence that IIAs alone will be effective in promoting sustainable development.
Thus New Model Agreement might be requested to refocus on the purpose and values for international investment agreements, confirming the linkages between investment and the imperative of sustainable development as its starting point (IISD, 2004), as was proposed by one Canadian Institute (International Institute for Sustainable Development ( = IISD)). More attention may need to be paid on this issue in light of growing importance of values, ethics and SD standards in the IIAs.
III.1 In search of FDI for Sustainable Development
Global investment climate seems to have drastically changed over the last two decades.
Today, an increasing number of corporations began to pay more attention to sustainable development than ever in the area of economic development, social equity, and environmental protection. Indeed, a new generation of investment is emerging that is mobilizing investment to ensure that it contributes to sustainable development (SD), which is a priority for all countries (UNCTAD, 2012). This change is quite noteworthy when we think that corporations had not generally taken SD so seriously until the early 2000s. However, since the early 2000s, there has been a significant proliferation of Corporate Social Responsibility (CSR) codes for global operations, both at individual TNC and at industry-level, reflecting increased awareness of the corporate responsibility for the SD, not to speak of newly organized international arrangements as well as a variety of governmental initiatives and reorganized policy frameworks for the SD.
As sustainable development seeks to balance economic, environmental, and social dimensions of development in a global perspective, it implies a broad view of human welfare, a long-term perspective about the consequences of today’s activities, and the full involvement of civil society. To achieve the SD,the role of foreign investment can be of uttermost importance,especially for developing countriess, as foreign investment is expected to bring about changes in developing countries with low levels of capital stock for achievement of the SD.
Here first we experimentally devise an alternative approach based on several available indicators in order to find out a proper country or location for international investment capable of contributing to the SD.
A number of indicators in economic, social and environmental areas have been introduced so far to measure economic development, social equity, and environmental protection by various institutions for international comparison. As the SD is composed of three pillars, i.e, economy, society and environment based on the definition made by Bruntland Report (1987), the extent of each of three pillars of SD might be represented by their respective corresponding indicators.
Here we review twelve representative indicators in the area of economy, society and environment with a view to evaluating their applicability to each component of three pillars of SD. Twelve possible indicators are, i.e. GDP, Gross National Happiness(GNH) 7, Net National Welfare (NNW) 8, Environmental Performance Index (EPI) 9, Human Development Index (HDI) 10, Genuine Progress Index (GPI) 11, Happy Planet Index (HPI) 12, Global Peace Index (GPI) 13, World Values Survey (WVS) 14, Better Life Index(BLI) 15, Corruption Perception Index (CPI) 16, and Dow Jones Sustainable Index(DJSI) 17.
However, among those indicators listed in the above no single reliable and comprehensive indicator can be found to be accountable for the SD. Since the concept of SD is rather broad, not a single indicator is able to capture a whole range of SD, which makes it difficult to measure SD itself. Sustainability is, indeed, a process which tells of a development of all aspects of human life affecting sustenance. As such it is a complicated process making presentation in a model difficult. Previous empirical studies were more or less not free from shortcomings because of their inability to measure SD (Petrovic-Randjelovic, 2007) and also because of varying stringency of environmental regulations in host states as well.
Thus it seems almost impossible to devise a single SD indicator capable of incorporating the exact definition of SD, therefore, the quantification of SD still remains unsolved. Hence it brings us to devise some alternative method to approach SD issue in pursuit of an appropriate pattern of FDI.
Here, in our experimental survey, four indicators, i.e., GDP, HPI, HDI and EPI are selected from the aforementioned twelve indicators after close examination of their applicability to components of the SD. Each of these four indicators is a proxy for one or two of the following seven areas, i.e. Economy, Environment, Well-being, Health & Longevity, Education, Income Distribution, and Corruption that are economic, social and environmental components of sustainable development.
III.2 Experimental approach to Sustainable Development
Based on the preceding argument, an attempt is made here to explore a proper location for SD investment, using new approach.
Since SD involves simultaneous pursuit of the following three pillars that are in accordance with the original definition of Brundtland Report(1987), three pillars which are “interdependent and mutually reinforcing“ can be referred to respectively as Economic development, Social development, and Environmental protection (UN 2005). Thus each of the above seven target areas can be categorized into three pillars of the SD as indicated below and in the Table III- 2.
Three Pillars of SD Components of Pillars
Economic growth : Economic prosperity (economic sustainability)--Economy, Well-being, Health & Longevity
Social development : Social equity (social
sustainability)---Education, Income Distribution, and Corruption.
Environmental protection : Environmental quality ( environmental sustain- ability) ---Environment, Health & Longevity
Table III-1 Targeted Areas for Selected Indicators
Four selected indicators Components of SD pillars
GDP (Gross Domestic Product) Economy
EPI (EnvironmentPerformance Index) Environment
HDI (Human Development Index) Economy, Health, Education Income distribution
HPI (Happy Planet Index) Environment, Well-being,
III.3 Country Rankings of Selected Indicators : Overview
When we investigate into international rankings of the above mentioned seven indicators in the Table III - 1, we can conclude that developed countries tend to have low HPI despite their high scores of HDI and EPI, indicating developed countries’ low HPI ranking and high HDI and EPI rankings as shown in the Table III -2.
According to the 2006 HPI survey, the US ranking of HPI was as low as 150th despite its top GDP ranking, while Russia ranked 172nd almost at the bottom out of 178 total countries(Nef.2009). This situation changed considerably in the 2009 HPI survey (Nef.2012). Many developed countries advanced to higher rankings in this survey. New Zealand ranked at the 28th, the highest ranking among developed countries, followed by Norway at the 29th out of 151 sample countries. The UK ranked 41st , a big jump from 108th in the 2006 HPI survey, while the US still ranked low at the 105th , Denmark at the 110th. One notable case is Luxembourg which ranked quite low at the 138th in the 2009 HPI survey with its one of the highest per capita GDP (PPP) in the world. Top 20 countries in the 2009 HPI ranking were accounted for mostly by Central American states and smaller-sized Asian countries because of less energy consumption and strong community bond prevailing in their countries, while developed countries’ lower rankings in the HPI survey in general were due to their heavy consumption of energy and resources.Vanuatu, a South Pacific small island country, was singled out as the most happiest country ranking top in the 2006 HPI survey. However the Pacific island countries were excluded in the 2009 HPI survey due to data problems, making it difficult to compare between the 2006 and 2009 survey outputs.
As for the Country ranking by Human Development Index (HDI) for 2010, countries with higher HDI index are almost without exception countries with higher per capita GDP, though not exactly associated with their larger size of GDP. Most of high HDI ranking countries within top 50 also ranked among top 50 high (per capita) income countries. To quote some notable cases, the 65th HDI ranking Russia’s per capita GDP ranking was 70th, Brazil with her 9th largest GDP ranked 84th in the HDI ranking and her per capita ranking was 101th in the world, China with the 2nd largest GDP ranked the 101st in the 2010 HDI ranking. Costa Rica’s HDI was ranked 62nd in the world despite her top ranking in the 2012 HPI. Other high ranking HPI countries generally ranked quite low often ranked as low as below the 70th ranking.
As for the selection of thirty sample countries in the Table III– 3, they were selected for international comparison based on the following criteria.
1) Countries that ranked relatively higher in one or more selected indicators, 2) Countries comparable to higher ranking countries in one selected indicator, 3) Priority is placed on higher GDP ranking countries, and
4) Smaller-sized countries with higher ranking in one selected indicator but were often omitted due to the paucity of data.
III.4 Analysis of SD Components for Overall Country Rankings
In a narrower sense of the SD, it thus can be approached by investigating into four indicators that are closely related to components of the SD, i.e. economic growth (GDP), environmental performance (EPI), social development (HDI), and social and ecological development (HPI). Among these four indicators, both HPI and HDI are composite indices. The HPI, developed by UK’s New Economics Foundation, is a composite index of life satisfaction, longevity and ecological footprints, whereas the UNDP’s HDI is composite of health (life expectancy), education, and income that is indicative of partial representation of social development.
However, it has a major drawback in that it takes no account of the environment. The HPI index is focused on the evaluation of ecological footprints produced by domestic consumption of energy and resources, while the EPI index, a joint product of Yale and Columbia University, is another environmental indicator that has emphasis placed on the protection of the environment. As a single indicator of environmental development, the EPI index ranks countries based on the performance and progress in environmental health and ecosystem vitality in 10 policy categories (such as pollution, biodiversity, fisheries, climate change, etc.) of the important environmental issues. A wide range of environmental sustainability performance is revealed by EPI ranking. Many countries are making progress on some of the challenges they face but performance on some challenges has declined. As the HPI seems to be a valuable indicator worth taking into account, here is how it is derived.
The HPI is derived by dividing Happy life years by Ecological footprint.. Happy life years are computed as the product of life satisfaction multiplied by life expectancy, i.e.
Happy life years = (Life satisfaction) X (Life expectancy) HPI = (Happy life years) ÷ (Ecological footprints)
Therefore a country with a higher HPI would imply a higher level of people’s life satisfaction living in good health yet consuming less amount of energy. The HPI indices of developed countries tended to score low because of high ecological footprints due to their heavy consumption of resources.
According to the 2006 HPI survey (nef.2009), Vanuatu, a small south Pacific island country ranked top in total 178 sample countries of the world. Many of small countries in Asia, the Pacific, and Central America areas ranked high, accounting for over 90% of the top ranking 30 countries, whereas the rankings of OECD member countries were relatively low. In fact, the 61st ranking Austria was the highest ranking OECD member country.
According to the nef HPI survey in 2006, most of Western developed countries ranked between 60th and 100th, and several other developed countries ranked below 100th, for example, the U.K ranked 108th, France 129th, the US as low as 150th (nef. 2009). However the HPI survey (151 samples) in 2009 (TableIII-2) presented significantly different country rankings from the 2006 survey(178 samples) because of reduced number of sample countries by 27 countries including small island countries that generally ranked higher in HPI country ranking due largely to their lower ecological footprints.
Looking over the above country ranking of selected indicators, we come up with some interesting results. Country rankings by selected indicators are based on the ranking of the indices of respective country. By and large, quality of life in the world improved as was substantiated by increased average HDI for the world as much as 18% during 20 year period (1990–2010), reflecting improvements in life expectancy, school enrollment, literacy and income(UNDP,2011). The HDI high ranking countries are mostly developed countries led by top ranking Norway in 2010 HDI survey. The HDI indices of developing countries are generally low. For example, China even with its second largest GDP ranked as low as at the 101th, India’s ranking was 134th, Brazil 84th, and the ranking of Russia was relatively low at the 65th. An interesting case is Vietnam. Though Vietnam ranked second in the 2009 HPI survey (nef. 2012), her HDI index ranking was as low as 113th and per capita ranked 166th.
Ⅲ.5 Derivation of Relative ranking index for appropriate location for FDI
In view of development of preceding arguments, four types of indicators, i.e. GDP per capita, HPI, HDI and EPI are selected here as essentially accountable for components in the area of the three pillars of the SD, that is, economy, society and environment. Higher ranking countries by these indicators can be regarded as better performing in one or more of these areas, developing towards sustainable development. It may be possible to choose better performing countries based on the rankings of the countries evaluated by respective component of the SD. Overall better performing countries can be selected by introducing a new concept “relative ranking index” (RRI), a comprehensive indicator developed based on the above four indicators by the author. This RRI is computed in the following manner.
First, the ranking of the country is divided by total number of sample countries for each of four indicators to identify the relative position, second, the figures obtained in this manner for each of four types of indicator (i.e., SD components ) will be added on. Table Ⅲ-2 shows country rankings of four indicators of 28 sample countries and their relative ranking indices computed in this manner. The total sum of relative rank indices of four SD component indicators are shown in the right side of the TableⅢ-2.
When this total sum (RRI) is arranged in the order of ranking, the smaller the relative ranking index (RRI), the higher the ranking of the country, indicating that the higher RRI ranking country is likely to become more sustainable in economic and social development as well as in environmental protection (TableIII-3).
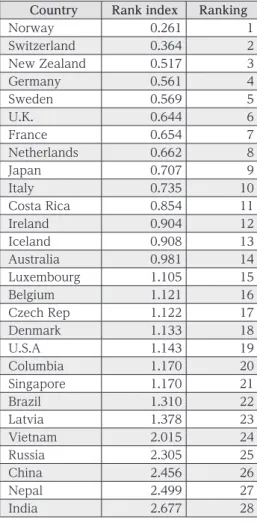
Table Ⅲ-3 shows the RRI country ranking. According to this table, out of 28 sample countries, Norway
ranked top, followed by Switzerland, New Zealand, Germany, and Sweden ranked 5th , the U.K ranked 6th, France 7th , the US 20th , while Russia, China, Nepal and India ranked within the lowest ranking group from the 26th ranking and below in the 28 sample countries.
The results seem to suggest that relatively small-sized, high-income developed western countries with high HDI index tended to rank high in the RRI rankings, whereas low per capita income, less developd countries with their lower HDI ranked low in the RRI country ranking.
Table Ⅲ-2
Country Ranking & Relative Ranking Indices for Selected Indicators
Note 1): Relative ranking indices (RRI) are obtained by dividing ranking in respective indicator by total samples. The lower indices suggest more appropriate location for sustainable development.
2): GDP per capita is PPP converted. GDP per capita was introduced as it seems to be relevant as an economic component of the SD indicative of economic development.
3): HPI index data of 2006 is excluded from this table, only 2009 HPI data is included. Source : GDP ranking from CIA & The World Factbook, HPI data from nef Report, nef website。 HDI data from UNDP Human Development Report 2010., EPI data from Yale Center. PI 2012
2011(sample:226) 2009(sample:151) 2011(sample:187) 2012(sample:132) Total Relative Ranking Indices GDP per capita(PPP) HPI HDI EPI
Countory Countory ranking Ranking Indices Ranking Indices Ranking Indices Ranking Indices Ranking Indices Ranking Indices Ranking Indices U.S.A 12 0.053 105 0.695 4 0.021 49 0.371 1.141 China 121 0.535 67 0.444 101 0.540 116 0.879 2.398 Japan 37 0.164 45 0.298 12 0.064 23 0.174 0.700 Germany 27 0.119 46 0.305 9 0.048 11 0.083 0.556 France 36 0.159 50 0.331 20 0.107 6 0.045 0.643 U.K. 34 0.150 41 0.272 26 0.139 9 0.068 0.629 Italy 44 0.195 51 0.338 24 0.128 8 .061 0.721 Brazil 101 0.447 21 0.139 84 0.449 30 0.227 1.262 Russia 70 0.310 122 0.808 65 0.348 106 0.803 2.268 India 164 0.726 32 0.212 134 0.717 125 0.947 2.601 Australia 23 0.102 76 0.503 2 0.011 48 0.364 0.979 Netherlands 18 0.080 67 0.444 3 0.016 16 0.121 0.661 Switzerland 15 0.066 34 0.225 11 0.059 1 0.008 0.358 Sweden 22 0.097 52 0.344 10 0.053 9 0.068 0.563 Belgium 28 0.124 107 0.709 18 0.096 24 0.182 1.111 Norway 9 0.040 29 0.192 1 0.005 3 0.023 0.260 Denmark 30 0.133 110 0.728 19 0.102 21 0.159 1.122 Columbia 108 0.478 3 0.020 79 0.422 27 0.205 1.125 Singapore 6 0.027 90 0.596 26 0.139 52 0.394 1.156 Ireland 24 0.106 73 0.483 7 0.037 36 0.273 0.900 Czech Rep. 49 0.217 92 0.609 27 0.144 18 0.136 1.107 New Zealand 47 0.208 28 0.185 3 0.016 14 0.106 0.515 Vietnam 166 0.735 2 0.013 113 0.604 79 0.598 1.951 Luxembourg 3 0.013 138 0.914 25 0.134 4 0.030 1.091 Costa Rica 100 0.442 1 0.007 62 0.332 5 0.038 0.819 Latvia 74 0.327 118 0.781 43 0.230 2 0.015 1.354 Nepal 203 0.898 58 0.384 157 0.840 38 0.288 2.410 Iceland 25 0.111 88 0.583 17 0.091 15 0.114 0.898 Bhutan 138 0.611 n.a n.a 141 0.754 n.a n.a n.a Vanuatu 153 0.677 n.a n.a 125 0.668 n.a n.a n.a
Table Ⅲ-3 Country Ranking by Relative Indices by four Selected Indicators
Ⅲ.6 Suggested criteria and evaluation of business prospective
From the preceding discussion the following SD criteria may be suggested.
Those countries with relative rank index (RRI) below 1.0 in the Table III-3 may possibly be indicative of proper locations for sustainable FDI, while countries with the relative rank indices above 2.0 can be interpreted as inappropriate for SD FDI. Five countries, i.e., Vietnam, Russia, China, Nepal and India are categorized into this group based on the criteria mentioned above. In the computation of relative rank index, such factors as wage level, market conditions , or corruption are not taken into account. When we take those into consideration, a whole picture may be different.
Here we introduce some of the FDI indicators compiled by the OECD survey with a view to evaluating our results. When we take into consideration other index such as OECD FDI Regulatory Restrictiveness Index (FRRI), FDI Confidence index(FCI), FDI Contribution index (UNCTAD.2012), the ranking order of country /location preference for FDI changes drastically.
According to the 2012 OECD Confidence Index ranking, for example, China came first (Brazil 3rd, U.S 4th, Germany 5th), suggesting that China is the most attractive country for investors(out of total 25 sample countries)18 (UNCTAD 2012), even though China ranked as the second most restrictive country (of total 50 sample countries) against foreign investors as indicated by the FDI Regulatory Restrictiveness Index (FRRI) (Thomsen, 2010). By other OECD FDI contribution index(FCI) which shows the extent of the contribution by foreign investment to the host country, Hungary ranked top, followed by Belgium, Czech Republic, Romania, and Hong Kong(OECD 2012). Relatively small countries seem to have received larger benefits from FDI inflows, whereas the impacts of FDI inflows on large countries were low as indicated by their lower FCI rankings of China’s 59th and the US’s 70th ( of total 79 sample countries) (OECD 2012).
Ⅲ.7 Changing business behavior of TNCs ?
When we take into consideration the Corruption Perception index (CPI) country rankings (Transparency International 2011), however, not a few countries with higher FCI are lower in CPI country ranking. Those
Country Rank index Ranking
Norway 0.261 1 Switzerland 0.364 2 New Zealand 0.517 3 Germany 0.561 4 Sweden 0.569 5 U.K. 0.644 6 France 0.654 7 Netherlands 0.662 8 Japan 0.707 9 Italy 0.735 10 Costa Rica 0.854 11 Ireland 0.904 12 Iceland 0.908 13 Australia 0.981 14 Luxembourg 1.105 15 Belgium 1.121 16 Czech Rep 1.122 17 Denmark 1.133 18 U.S.A 1.143 19 Columbia 1.170 20 Singapore 1.170 21 Brazil 1.310 22 Latvia 1.378 23 Vietnam 2.015 24 Russia 2.305 25 China 2.456 26 Nepal 2.499 27 India 2.677 28
Note1) : Relative ranking indices are obtained by dividing rankings in respective indicator by total samples. The lower indices suggest a proper location for sustainable development.
2) Vanuatu is included in the TableIII-2, but was omitted from TableIII-3 due to lack of data in 2009 HPI survey. Thus its total sample was reduced to 29 countries.
countries with lower scores of RRI ( less than 1.0) are generally high CPI ranking countries (indicating less corruputed), whereas those countries with RRI higher than 2.0 are all low CPI ranking countries, i.e., China 75th, India 95th, Russia 143rd (of total 183 sample countries), suggesting that they are rather corrupted according to the CPI definition.
Most clean and transparent country was New Zealand in 2011 according to the country rankings by CPI, followed by Denmark, Finland, Sweden, Singapore. The US was at 24th, France 25th (Transparency International, 2011).
Figure Ⅲ-1
TNCs’ TOP 20 Prospective Host Economies for 2012 - 2014
Our computational results suggest that developing countries with lower relative rank indices were not regarded as the appropriate location for SD investment, however still they are likely to attract FDI from investors willing to invest in the countries with prospects for business opportunity as shown by the Figure III-1.
All four BRICs countries, i.e., China, India, Brazil and Russian Federation are selected by TNCs as the top 10 most prospective host countries for 2012-2014 even though their HDI country rankings are quite low (Table III-3, Fig III-1). Despite growing recognition of sustainable development, many of TNCs seem to be still placing more emphasis on business prospective rather than on social and environmental incentives.
With all these country ranking indices, however, TNCs preference of host economies for FDI do not necessarily seem to be reflecting SD country ranking indices.
IV. Concluding remark
A surge of international investment over the last three decades enhanced by an increased liberalization of FDI has brought forth substantial environmental degradation, giving rise to global attention for sustainable development. Hence an appropriate pattern of foreign investment for sustainable development is sought by host states and investors as well as public institutions.
In our exploratory survey, the results suggest that rather high income, developed countries with lower ecological footprints but with high UNDP’s Human Development index (HDI), tended to rank high as appropriate locations for SD investment, indicating that they are more likely to attract FDI from investors willing to invest in the countries with prospects for sustainable development. However in the currently prevailing business world, some of the emerging countries such as BRICs are still regarded as prospective host locations for FDI from TNCs despite their low RRI(Relative ranking index) country ranking.
In view of increasing concerns for the SD, however, a new investment pattern seems to be on the rise at the investor level, bringing forth changes in international operation in the direction of sustainable development. In fact, an increasing number of governments in developed and developing countries are encouraging investors to invest in industries with higher prioritized interests in preservation of environment that produce social or environmental benefits.
1 2 3 4 5 6 7 8 9 10 11 12 13 14 15 16
The first bilateral investment treaty (BIT) signed as an investment treaty between host state and home state was concluded between Germany and Pakistan in 1959.
Vogel, David (1999). 1-39.
Since the late 1960s, environmental regulations have become progressively stricter in all industrial nations and a number of industrializing ones as well. Virtually all nations now devote substantially more resources both in absolute and relative terms to environmental protection than they did in 1970. (Vogel,1999 p.2).
Regulatory/restrictive national measures include various economic and business regulations, not limited to environmental preservation.
Fauchald, Ole Kristian (2011). International Investment Law and the environment.33-34.
Petrovic - Randjelovic, Marija(2007). “Foreign Direct Investment and Sustainable Development : An Analysis of the Impact of Environmental Regulations on Investment Location Decisions”, FACTA UNIVERSITATIS, Series Economics and Organization, Vol.4, No.2, pp.183-190.
Mayeda, Graham(2011). Sustainable International Investment Agreements: Challenges and Solutions for Developing Countries. 539-559.
GNH (Gross National Happiness) (1972) was introduced by Bhutan King as a national policy to achieve overall well-being of the nation. NHI(National Happiness Index) was developed in 2008.
NNW (Net National Welfare) (1973) was developed by Japanese government incorporating non-economic factors to evaluate national welfare.
EPI (Environmental Performance Index)(2000) was developed by Yale Center for Environmental Law and Policy, Yale University with Center for International Earth Science Information Network, Columbia University. This index is derived from ten environmental categories in each country, ranking 132 countries on 22 eco- performance.
HDI(Human Development Indicator)(1990) was adopted by UNDP to incorporate human development elements such as education, gender equality, etc., with environment excluded.
GPI(Genuine Progress Indicator) (1995) was developed by US Redefining Progress (NGO) as an alternative to GDP to supplement the drawbacks of GDP.
HPI (Happy Planet Index) (2006) was developed by UK’s New Economics Foundation (nef) to devise index based on life satisfaction, life expectation and ecological burden.
GPI(Global Peace Index)(2007) was developed by Institute for Economics and Peace (GPI), Sydney, Australia to measure degree of peace based on war involved, domestic crime, violence, corruption, etc.
WVS (World Values Survey)(1981) was developed by The Institute for Future Studies, Stockholm, Sweden. This survey is undertaken to investigate the impacts of economic and technological development on people’s values, social and political outlook.
BLI(Better Life Index) (2011) was developed by OECD to compare overall social and economic conditions and people’s satisfaction level of OECD member countries. No reference is made to developing countries in this index.
CPI(Corruption Perception Index)(1995) was developed byTransparency International, Berlin, Germany, to rank countries based on the perceived levels of public sector corruption, relating to bribery of public officials,
Notes: chapter II.
Reference
Asian Development Bank (ADB) (2004). Asian Development Outlook 2004 (Manila: ADB).
Boyle David & Andrew Simms(2009). The New Economics : A Bigger Picture Earthscan Publisher (London: New Economics Foundation (nef)).
CIA World Factbook 2011, 2012 https://www.cia.gov/library/publications/ the-world- fact-book/
rankorder/2004rank.html.
Ramus, Catherine A., and Ulrich Steger (2000). “The Roles of Supervisory Support Behavior and Environmental Policy in Employee Ecoinitiatives at Leadng-Edge European Companies.” Academy of Management
Journal 43 (4):605-25.
Dow Jones and Sam. DJSI (Dow Jones Sustainability Indices). www.sustainability- indexes.com.
Institute for Economics and Peace (2007). http://economicsandpeace.org/research/iep-
indices-data/global-peace-index.
International Institute for Sustainable Development (IISD)(2004).
Investment and Sustainable Development ---- A Guide to the Use and Potential of International Investment Agreements (IIAs) (Manitoba: IISD).
--- (2011). International Investment Law and SD: Key cases from 2000 –2010. (Manitoba: IISD). R. Makwana(2006). Multinational Corporations (MNCs): Beyond The Profit Motive.
http://www.stwr.org/multinational-corporations/multinational-corporations-mncs-beyond-the-profit-motive.html.
Mayeda, Graham (2011). “Sustainable International Investment Agreements: Challenges and Solutions for Developing Countries”, in Marie-Claire Cordonier Segger, Markus W. Gehring, Andrew Newcombe eds. Sustainable Development in World Investment Law (The Netherlands :Kluwer Law International ). Morgera, E. (2004). From Stockholm to Johannesburg: From Corporate Responsibility to Corporate Accountability
for the Global Protection of the Environment? RECIEL 13 (2). Nef (New Economics Foundation)(2009) . Happy Planet Index 2009 Report. --- (2012) . Happy Planet Index 2012 Report. www. happyplanetindex.org.
OECD Global Forum on International Investment (2001), Foreign Direct Investment and Sustainable Development ---- New Horizons and Policy Challenges for Foreign Direct Investment in the 21st Century. Mexico City, November. 26-27.
--- (2006). OECD’s FDI Regulatory Restrictiveness Index : Revision and Extension to More Economies. Working Papers on International Investment. No.2006/4, OECD Investment Division. Dec. 2006. --- (2011). OECD : Better Life Initiative (Paris: OECD Development Centre).
http://www.oecdbetterlifeindex.org/ .
Patchell, J. and R. Hayter(2013). ‘How Big Business can save the Climate ? : Multinational Corporations can succeed where Governments have failed’, Foreign Affairs. Vol.92, no.5. Sept/Oct. 17-23.
Petrovic - Randjelovic,, Marija(2007). “ Foreign Direct Investment and Sustainable Development : An Analysis of the Impact of Environmental Regulations on Investment Location Decisions”, FACTA UNIVERSITATIS, Series Economics and Organization, Vol.4, No.2, 183-190.
Rivera, J. and C.H.Oh(2013). “Environmental Regulations and Multinational Corporations’ Foreign Market Entry Investments” The Policy Studies Journal. Vol.41, No.2, 243-72.
17
18
kickbacks, embezzlement, etc..
DJSI (Dow Jones Sustainable Index) (1999) was developed by US Dow Jones(D-J) and SAM to evaluate the sustainability performance of the largest 2500 companies listed on the D-J and SAM to evaluate the sustainability performance of the largest 2500 companies listed on the D-J stock market index.
Top 6 ranked economies by FDI Attraction Index in 2009-2011 were Hong Kong, Belgium, Singapore, Luxemburg, Ireland, Chile. (UNCTAD, 2012).
Rivera, M. (2013).“Political Criteria for Sustainable Development Goal (SDG) Selection and the Role of the Urban Dimension”, Sustainability, 5, 5034-51.
Segger, M. C. and A. Kent(2011). ‘Promoting Sustainable Investment through International Law’ in M. C. Segger, M. W. Gehring and A. Newcombe (eds). Sustainable Development in World Investment Law (the Netherlands :Kluwer Law International ).
Sharp, Basil M. H.(2001). Sustainable Development: Environment and Economic Framework Integration. http://
ideas.repec.org/p/nzt/nztwps/01-27.html .
Thomsen, Stephen(2010). OECD FDI Regulatory Restrictive Index: A tool for bench- marking countries, measuring reform and assessing its impact. www. oecd.org/invest- ment/ index .
Transparency International(2011). , The Corruption Perceptions Index. (Berlin : Transparency International). www.transparency.org .
UN World Commission on Environment and Development (WCED)(1987). Report of the World Commission on Environment and Development (or Brundtland Report) “Our Common Future”, UN Doc A/42/427,online: www.un-documents.net/ oct-02. htm#1.
UN(1992). Rio Declaration on Environment and Development (UN Doc. A/CONF. 151/26, Vol.1, 1992); and Agenda 21 (UN Doc.A/Conf.151/26, 1992).
--- (2002). World Summit for Sustainable Development(WSSD): Plan of Implementatin,
World Summit for Sustainable Development, vol.UN Doc. A/CONF. 199/20, 2002). (Johannesburg, WSSD) . www.
un.org/esa/sustdev/documents/ WSSD_POI_PD/ English/ POIToc.htm.
U.N.(2005). U.N. Global Compact (New York: United Nations). http:// www.un.lt. UNCTAD(2003). World Investment Report(WIR)2003 (New York : UNCTAD). --- (2005). World Investment Report 2005 (New York : UNCTAD). --- (2008). World Investment Report 2008 (New York : UNCTAD). --- (2009). World Investment Report 2009 (New York : UNCTAD). --- (2010). World Investment Report 2010 (New York : UNCTAD). --- (2012). World Investment Report 2012 -- Overview : Towards a New Generation of Investment Policies (New York : UNCTAD).
--- (2013). World Investment Report 2013 (New York : UNCTAD).
UN Commission on Transnational Corporations (1993). Climate Change and Transnational Corporations : Analysis and Trends (UN Doc. E.92. II.A.7-ST/CTC/112) (New York: UN Commission on Transnational Corporations).
UNDP (2011). Human Development Report 2011 ----Sustainability and Equity: A Better Future for All. Vogel, David(1999). Environmental Regulation and Economic Integration.
Prepared for a Workshop on Regulatory Competition and Economic Integration:Comparative Perspectives. Yale Center for Environmental Law and Policy. Oct.
Yale Center for Environmental Law and Policy, Yale University and the Center for Earth Information Science Information Network at Columbia University (2012). EPI 2012 Environmental Performance Index and Pilot Trend Environmental Performance Index. www.epi.yale.edu & http://envirocenter.yale.edu/ programs/ environmental-performance- manage- ment/environmental-performance-index.
World Bank, World Development Report, various issues (Washington, D.C: World Bank). --- (2012). World Development Indicators 2012 (Washington, D.C: World Bank).