Measuring China’s Sustainability
An Evaluation with Green NNP and Ecological Footprint
CAI Dapeng*
Abstract
In this paper, we apply the measures of green NNP and ecological footprint to evaluate China’s current state of environment and the sustainability of its economic development. Our accounts indicate that the current economic development is approaching or has already exceeded China’s environmental regeneration capacity.
We also show the necessity for, and the possible components of, a development paradigm transformation in China.
Keywords: Sustainability, Green NNP, Ecological footprint, China
1. Introduction
China’s economic growth during the reform era that began in 1978 has been one of the great stories of successful economic development in the post-war era (OECD, 2002). Over the years, the government’s both pragmatic and gradualistic approach has effectively emancipated the creativity of the people, and has successfully transformed the country from a central planning economy into one that is largely market-oriented. Accordingly, China’s experience has now been widely regarded as a favorable model for developing economies, one that is “both efficient and productive”
(McGregor, 2002).
The accession of China to the World Trade Organization (WTO) in 2001 marks an important milestone along the reform path it has been following for the past two decades. However, accompanying augmented social wealth, problems like pollution and resource exhaustion are becoming increasingly prominent. Even the Chinese government acknowledges that “[the]
tremendous economic growth in recent years … has come at a cost to its land and its people. In its eagerness to develop, China has experienced numerous environmental problems” (ACCA 21, 2000).
Various signs have repeatedly shown that the current economic development has been straining the
* Research Fellow. Lingnan College, Sun Yat-Sen University and Graduate School of Economics, Nagoya University, Email: [email protected].
The author wishes to thank Prof. OKUMURA Ryuhei of Nagoya University, YABUTA Masahiro of Chuo University, participants at the Second International Conference of the Japan Economic Policy Association, and two anonymous referees for their helpful comments. The author is, of course, entirely responsible for all remaining errors.
environment and therefore, seems not being able to be sustained in the long run (Imura, 2002).
Accordingly, questions like “Has China been following a sustainable development path? And if not, how should policies be modified to readjust China to one that is sustainable?” have become the most urgent issues on the Chinese development agenda. Although there has been a large literature that examines environmental degradation and resource exhaustion in China, unfortunately, few papers have assessed the situation from the perspective of sustainability.
The official national strategy toward sustainable development has been China’s national Agenda 21, which is based on the Agenda 21 framework. However, as argued in the literature, developmental strategy based on the Agenda 21 framework is insufficient since it takes the economy’s material and biological environment as exogenous givens and thus fails to take account of vital constraints on economic development, such as environmental carrying capacity (Boulding, 1966; Daly and Cobb, 1989; Wackernagel et al. 2002). Therefore, it seems that a thorough examination of the development sustainability in China also needs to answer questions like “Is China’s national Agenda 21 sufficient? And if it is not sufficient, what else are needed to direct China to a sustainable future?” In this paper, we shall address these questions explicitly. We first present a preliminary assessment of the sustainability of China’s development process. Then, based on this assessment, we consider the effectiveness of China’s national Agenda 21.
This paper is organized as follows. In section 2 and 3, we apply an economic measure of sustainability, the green net national product (hereinafter green NNP) as in Hartwick’s framework (Hartwick 1990), and an ecological measure, the ecological footprint (hereinafter EF) proposed by Wackernagel and Rees (1996), to measure the sustainability of China’s recent development. Our accounts show that the current economic development is approaching or has already exceeded China’s regeneration capacity. Then, in Section 4, we study the essence and limitations of China’s Agenda 21, and show why it is insufficient. We show that this is so because the underlying theoretical base of the Agenda 21 framework, the neoclassical development wisdom, is insufficient when the country in consideration is approaching or has already exceeded its environment’s regeneration capacity. In Section 5, we consider how China could be redirected to a development path that is sustainable per se. We conclude this paper in Concluding Remarks by stressing the urgency of this historical transformation.
2. China’s green NNP
Green NNP, developed as an economic indicator of sustainable development, has its theoretical foundation firmly rooted in neo-classical economic theory. The literature concerning NNP dates from the seminal paper of Weitzman (1976), and the examination of green NNP emanates from the recognition that the NNP alone is not a satisfactory measure of sustainability.
Green NNP was first examined in Ahmed et al. (1989) and Repetto and Magrath (1989), and can also be found in Hartwick (1990). The literature concerning green NNP has mainly discussed two issues. The first centers on the theoretical backgrounds and interpretation of the green NNP, i.e.,
reasons behind making adjustments and what the resultant number actually tells. So far, although the suitability of NNP as an indicator of sustainability has been questioned by Asheim (1994), there seems to be an agreement in the literature that a rising green NNP indicates that an economy is becoming increasingly sustainable, and vice versa. This is so, as argued by Solow (1993) and Hartwick (1995), because green NNP is considered as an estimate of the Hicksian income, which represents the maximum consumption level that an economy can consume forever. However, concerning the second issue, how to derive the green NNP figures, or, how adjustments should be made, the literature remains largely in controversy. As noted in Hanley et al. (1999), “no universal agreement exists on how adjustments for … changes in pollution levels or changes in forest stocks should be made” (p.58). In this paper, to derive a green NNP figure for any year, we apply Hartwick’s framework (Hartwick, 1990, 1995), which mandates the deduction of depreciation of all forms of environmental and natural resources, valued by their Hotelling rents, and changes in environmental quality (pollution), valued at their marginal abatement costs, from the figure of Net National Product. Formally, it can be stated as
NDE, NDR
NNP NNP
Green = − −
where NDR is net depreciation of natural and environmental resources, and NDE is net depreciation of environmental quality. Accordingly, if the resource stocks rise or the pollution alleviates in the accounting period (for example, due to the capacity building activities such as afforestation), then the value of this improvement is added to NNP.
NNP has not been recorded officially in the Chinese statistical system. For those years that the data on capital depreciation is not available, the coefficients of depreciation in vicinity years are applied to calculate relevant figures. Given the facts that exact data on marginal extraction or production costs were not recorded for many resources in China, and that we have access only to partial data on pollution control costs, as in Hanley et al. (1999), we refer our estimation to Approximate Environmentally-Adjusted National Product (AENP) (Appendix I).
Figure 1 shows NNP, AENP and consumption in real prices (1995) over the period 1990-1999.
It can be easily observed that AENP is always less than NNP. Environmental depreciation in any year is large in absolute terms, but is small relative to NNP. Also, since consumption is less than AENP in all periods, the Chinese economy was largely sustainable as evaluated by this measure.
One can also observe that real AENP has been rising for the whole period, indicating continuous improvements in sustainability. Moreover, from Figure 1, it can be observed that the real NNP and AENP are growing at similar rates over the period, showing that the difference between the two, the absolute scale of resource use and pollution (depreciation of environmental and natural resource stock, and environmental quality), is also enlarging at the same rates over the years. It has to be noticed that the pollution recorded in the AENP is far from exhaustive. Due to data insufficiency, pollution due to households and a number of industrial pollutions were not recorded in the AENP, which implies that the actual green NNP would be much lower than the AENPs shown in Figure 1.
0 10000 20000 30000 40000 50000 60000 70000 80000
1990 1991 1992 1993 1994 1995 1996 1997 1998 1999 real NNP
real consumption AENP
Figure 1. China’s AENP in the period 1990-1999 (Unit: real 1995 RMB 100 million)
Source: Real NNP, real consumption and AENP of the period 1990-1999 was calculated using data from China Statistical Yearbook (NBS, 1990-2002), Report on the State of the Environment in China (SEPA, 1990-1999) and Input-Output Table of China (NBS, 1990, 1992, 1995, 1997).
Note: “Consumption” here refers to “final consumption expenditure,” a sum that includes both the household consumption expenditure and the government consumption expenditure.
Following insights can be drawn from the examination of AENPs. First of all, the Chinese economic development in the past two decades seems to be largely sustainable. Secondly, the absolute levels of resource use and environmental degradation have been increasing over the years, indicating the level of sustainability has been decreasing over the years. However, since it “allows the substitution of equivalent human-made capital for depleted natural resources” (Wackernagel and Rees 1996, p.37), it has been widely recognized that weak sustainability indices such as green NNP do not provide an adequate assessment of the state of the environment. Based on their estimation, Pearce and Atkinson (1993) show that countries like Japan and Netherlands are sustainable according to their weak sustainability indicator, which allows for “unconstrained elasticities of substitution” between natural and man-made capital, an index that is similar to the one adopted in the present paper (p.104). Obviously, weak sustainability indices fail to take account of the fact that monetary savings come from the depletion of natural resources that belong to other countries or future generations. Therefore, it is not appropriate to regard the analysis based on the evaluation of a weak sustainability index as final and definite. A thorough analysis on the state of environment can only be completed by an assessment using a strong sustainability index, which does not recognize the substitution possibilities between natural and man-made capital. In the next section, we are going to apply EF, a strong measure of sustainability, to complete our examination of the state of China’s environment.
3. China’s ecological footprints
Ecological footprint (EF) has been proposed by Wackernagel and Rees (1996) as an ecological indicator that measures economic activities in ecological units. EF is defined as a measure of the amount of the Earth’s biological productivity that a human population occupies in a given year using prevailing technology. In practice, for the purpose of international comparison, EF is recorded as ‘global ecological footprint’, which counts the size of the required biosphere by using international average of biosphere productivity.
0 0.2 0.4 0.6 0.8 1 1.2 1.4 1.6 1.8
1990 1991 1992 1993 1994 1995 1996 1997 1998 1999
Ecological Footprint, global ha/person Biocapacity, global ha/person GNP, with 1995 as 1.0
Figure 2. China’s ecological footprint (global ha/person), biocapacity (global ha/person), and GNP (with 1995 as 1.0) in 1990-1999 (Appendix II)
Source: Living Planet Report 2002 (WWF, 2002), pp. 24-25 (for the period of 1996-1999). For the period of 1990-1995, EF was calculated using data in China Statistical Yearbook (NBS, 1990-2002), Report on the State of the Environment in China (SEPA, 1990-1999), Input-Output Table of China (NBS, 1990, 1992, 1995, 1997) and Emissions from Fuel
Combustion 1971-2000 (IEA, 2002). 2
CO
0
Cropland footprint1.2
Grazing land footprint
Forest footprint Fishing ground footprint
Total energy footprint
China World Average Middle Income Countries
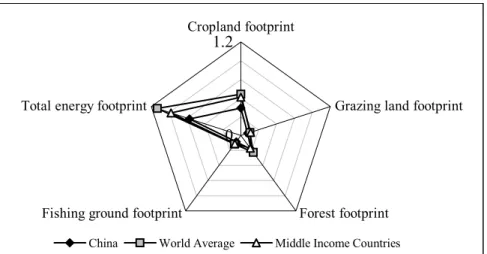
Figure 3. Area components of the ecological footprints (1999) of China, world average, and middle-income countries (Unit: global ha/person)
Source: Living Planet Report 2002 (WWF, 2002), pp. 21-29.
Figure 2 traces China’s ecological footprint, biocapacity, and real GNP (with 1995 as 1.00) in the period 1990-1999. The trend with real GNP is clear: it had increased continuously in those ten years, from 3262.10 billon RMB in 1990 to 7917.27 billon RMB in 1999 (in 1995 prices, calculated using data in NBS, 1990-2002). Over the years, the biocapacity, an index designed to record the total biological production capacity per year of a hectare, has been gradually rising, indicating a trend that is contrary to the world trend, which declines from 2.16 global ha/person in 1990 to 1.90 global ha/person in 1999 (WWF, 2002). Except in 1992 and 1995, the Chinese EF has largely been stable over this period. Moreover, starting from mid-1990, it seems to be following a declining trend. At the same time, the world average EF (per capita) has experienced a decline of 6.9%, down from 2.45 global ha/person in 1990 to 2.28 global ha/person in 1999.
China’s ecological footprint per capita in 1999 was 1.54 global ha, which was much lower than the world average of 2.28 global ha, even lower than the middle income countries’ average of 1.99 global ha (WWF, 2002). Figure 3 outlines area components of China’s ecological footprint in 1999, as well as those of world averages and the averages of middle-income countries. It can be easily identified that all components of China’s ecological footprint fall within the range of the world average and middle-income countries. China’s figures on the fishing ground footprint, forest footprint, and grazing land footprint are almost equal to those of the other two groups. However, for cropland footprint and total energy footprint, China’s figures are significantly less than those of the other two groups. For example, China’s total energy footprint accounts for only 60% of the world average and is 75% of middle-income countries’ average.
China’s continuously shrinking EF in late 1990 and the less significant cropland footprint and total energy footprint were achieved partly due to an improvement in the efficiency of economic activities. According to Worldwatch Institute (2002), since 1990, Chinese government has enacted an ambitious set of energy efficiency policies, including rewarding corporations that focused investments on equipment upgrades, the promotion of efficiency in new construction, building and appliance, and the establishment of efficiency standards and national energy conservation centers.
As a result, China has become “the world leader in producing energy and resource saving appliances such as the efficient compact fluorescent light bulbs pioneered in Europe and the U. S.”
(Worldwatch Institute, 2002, p.12). Over time, China’s energy demand growth rates “have been cut to half the rate of economic growth and China now has carbon intensities below the U. S. level”
(Starke, 2001, p.92).
The above analysis seems to suggest that China’s economic activities are still optimal: high speed of economic growth accompanied by a rising green NNP figure and a decreasing per capita ecological footprint. However, an examination of the aggregate national EF, an index that captures the overall EF of a country, reveals that this is not the case. China’s population has increased from 1.143 billon in 1990 to 1.272 billon in 1999, a positive increase of 5.93%. Adjusted by its population, China’s aggregated national EF has increased from 1.76 billon global ha in 1990 to 1.959 billon global ha in 1999, which accounts for a dramatic 11.26% increase. As a result, China’s ecological deficit in 1999 is 0.51 global ha/person. Ecological deficit is an index used to measure the amount by which the ecological footprint of a country exceeds the biological capacity of the
space available to that country. This indicates that China’s economic activity was at 149.5% of the carrying capacity of the biosphere that China was endowed with in 1999, i.e., roughly 1/3 of China’s economic activities were beyond what can be sustained with China’s biological and environmental resource endowments. Note this differs from our accounts of China’s green NNP.
However, since EF is a strong indicator of sustainability, and also given the fact the absolute scale of resource use and pollution has been enlarging over the whole period, it may be safe to conclude that China’s economic growth demand is approaching or has already exceeded China’s regional biosphere’s regeneration capacity. Given the fact that currently, nearly 1/5 of the world’s economic activities are already beyond the Earth’s regenerative ability (WWF, 2002), China’s increasing ecological deficit as depicted by EF is an extremely consequential trend that may influence the future of humanity as a whole. Taking actions to terminate the unsustainable aspects of the Chinese economic development and to prevent the “overshot”, therefore, has abundant political and economic implications not only to China, but also to the rest of the world.
4. The Agenda 21: its essences and limitations
Conventional development wisdom assumes no serious constraints on economic expansion. To some, this perspective is desirable in that it implies that people who are currently enjoying a comparatively high level of consumption do not have to compromise their lifestyles so that future generations can have a sustainable level of material standards. In fact, many economists argue that more consumption by the developed world is beneficial in that it accelerates growth and creates jobs by expanding the export markets of developing countries. As implied in the famous metaphor of Lawrence Summers, this view assumes “rising tides do raise all boats.” However, such a notion is not compatible with sustainable development as proposed in the Brundtland report.
Following the publication of WCED’s Our Common Future (WECD, 1987), world leaders met in Rio de Janerio in 1992 and adopted Agenda 21 as a global development guideline to solve the sustainability problem. It is stated that “Agenda 21 addresses the pressing problems of today and also aims at preparing the world for the challenges of the next century… [It] reflects a global consensus and political commitment at the highest level on development and environment cooperation (Clause 1.3, Preamble to Agenda 21, UN, 1992)”. Reinforced at the 2002 Johannesburg Summit, Agenda 21 has been regarded as the most effective and comprehensive action plans for future. It has been announced by the United Nations that the Agenda was sufficient in terms of philosophical or political consideration, and the worsened environmental degradation since the 1992 Earth Summit has been considered as resulted from not fully implementing Agenda 21. As a result, Johannesburg Plan of Implementation has then been proposed as an “action plan” to complement Agenda 21. However, as identified in the literature, ironically, Agenda 21 and the consequent Johannesburg Plan of Implementation, known as the Agenda 21 framework, will not lead the world into a sustainable future. As stated in Agenda 21, “more efficient allocation and use of resources thereby contributes to lessening demands on the environment (Item 2.19, Agenda 21,
UN, 1992)”, the Agenda 21 framework considers the improvement of economic efficiency as a fundamental solution to problems connected to sustainability. Agenda 21 is largely efficiency-oriented and is deeply rooted in the conventional development wisdom that emphasizes economic efficiency. As what has been argued by many, this view can only be justified when economic activities are within the environmental regeneration capacity (Boulding, 1966; Daly and Cobb, 1989). Unfortunately, as noted by Wackernagel et al (2002), that ‘sustainable’ state of development has become past history: “human demand may well have exceeded the biosphere’s regenerative capacity since the 1980s” (p.9266). This overshot, together with the fact that environmental resource base is limited (Arrow et al. 1995), implies that the issue of intergenerational distribution (or intergenerational equity considerations) should be given priority in the decision-making process. However, Agenda 21 shows little or no concern for future generations, which is at the core of the concept of sustainable development. It is therefore highly possible that under Agenda 21, the pursuance of economic efficiency is at the cost of weak parties, which includes those of the future generations who have no representatives today. Our challenge, then, is to develop and implement a new development paradigm that is largely within the natural regenerative capacity of the environment. The new sustainable development paradigm should be both equity- and efficiency-oriented: the costs and benefits should be fairly distributed among generations; and both the intertemporal distributive efficiency and the intertemporal productive efficiency should be attained simultaneously.
China’s Agenda 2l is China’s national response to the l992 Earth Summit. Together with Capacity 21, an action plan that aims to strengthen its institutional capacity to implement Agenda 21, China’s Agenda 21 forms the foundations for China’s national development strategy. As with the Agenda 21 framework, it is largely efficiency-oriented, and is in accordance with the government’s proclamation that the central task of governmental activities is to promote economic growth. The interests of future generations are recognized and protected only partially under China’s Agenda 21 and Capacity 21, as no institutions has been established explicitly to ensure that future generations could have an equal access to a natural and environmental resource base that is as “productive” as those of the current generation. Our accounts on the state of the China’s environment show that this efficiency-oriented approach is no longer applicable, and the following the Agenda 21 framework will not lead the Chinese economy into a sustainable development path.
A new development paradigm that puts more emphasis on the interests of future generations, therefore, is urgently needed. In order to introduce the elements of “equity” into the current development paradigm, institutions that effectively reallocate various resources stocks among generations should be established through a restructuring of the existing economic institutions. In the next section, we identify some reforms that are needed to complete this paradigm shift.
5. Redirecting environmental resources, reordering development priorities
The Chinese government has recently reinforced the existing environmental administration
regime by adopting a number of new environmental laws (such as the Law on the Environmental Impact Assessment, 2002.10; the Law on the Promotion of Clean Production, 2002.06; and the Law on Desert Prevention and Transformation, 2001.08) and including environmental targets in the national and regional plans (for example, the approval of the National Tenth Five-year Plan for Environmental Protection in 2001.12). These steps do represent a departure from the
“efficiency-oriented” development paradigm as stipulated in the Agenda 21 framework; however, they are still not complete. For example, in the National Tenth Five-year Plan for Environmental Protection, it is acknowledged that during the tenth five-year plan period (2000-2005), of the total planned investment for environmental protection, only 1.4% is allocated to “capacity building of environmental protection”, a category which is regarded as largely equity-oriented (SEPA, 2002).
Hence, a transformation that could direct China to a new development paradigm that is both equity- and efficiency-oriented is still urgently needed.
To achieve the historical transformation toward a sustainable development path in China, substantial reallocation of resources among different economic sectors and a major restructuring of the economic institution are needed. We have identified that the population growth is among the causes of the sustainability problem; however, given the strictness of the current “one child policy”, it seems hard for the government to implement policies on population control that are more effective. Therefore, this transformation shall be undertaken as a reform of China’s environmental administration regime, which is currently led by the State Environmental Protection Administration (SEPA), the governmental ministry charged with the responsibilities to protect China’s environment.
The reform, of course, shall not be limited only to the reform of SEPA itself but should also include the following parts:
(a) At the national level, a reordering of national priorities and short- and long-term policy objectives should be undertaken. Instead of focusing on short-term economic growth, emphasis should be placed on long-term economic performance and development sustainability.
Although similar arguments have been regarded as clichés in the literature, unfortunately, it is hard to say that they have been incorporated effectively in reality. Accordingly, instead of merely acknowledging that environmental conservation is a national strategy, it should be clearly specified that the ultimate objective of the environmental and resource policies is to restrain the economic activities within the carrying capacity of the environment. Specifically, instead of merely integrating environmental concerns into the decision-making process, the biological capacity should be regarded as a vital growth constraint, and should function as the ultimate criterion of whether a particular policy should be adopted. Meanwhile, there is also the need to include environmental NGOs and NPOs in the decision making process.
(b) The monitoring system within the existing SEPA regime should be reinforced. It should perform a comprehensive assessment of the biological capacity of the existing ecosystem and monitor economic performance based on such assessments. This would involve the design and control of a set of indictors that include economic, ecological and social development measures.
(c) For the use of renewable resources and energy, the emphasis should continuously be placed upon efficient utilization through the application of policy instruments such as environmental
tax and the three-synchronization policy. There is also the need for the government to increase the fund allocated to the research and development activities concerning the reuse of resources and energies. The ultimate goal is to turn the current unsustainable resource and energy consumption pattern into one that is recycle-based. At the same time, the government should continuously seek to enlarge the base of the resources through capacity building activities such as afforestation.
(d) For the use of exhaustible resources, the emphasis should be placed upon intergenerational equitable utilization. In practice, a special committee that functions as a trustee for future generations, as proposed in Gerlagh and Keyzer (2001) and Padilla (2002) should be established at the national level. The committee should establish intergenerational property rights allocation schemes and assign the property rights to future generations. It should also be given sanctioning power to act effectively against the practices that jeopardize the rights of future generations, and also to articulate the compensations to future generations. No known governmental agency with similar characteristics exist in any country, however, given our accounts of its state of environment, China seems to have a special need to take the initiative of such an agency.
(e) It also has to be noticed that currently, resource and energy use in the rural area is much less efficient than that of the urban area. Given the fact that 0.796 billion people are currently living in the rural area and the recent rise of township and village enterprises (TVEs), there is an urgent need to strengthen the enforcement of environmental administration in the rural area.
However, relevant reforms should be undertaken with great caution and care should be taken that the interests of the rural population are not hurt adversely by the reforms.
(f) As a national policy, the government should also promote a life style that can, to a large scale, be sustained by renewable resources and accretive resources, while at the same time, dramatically reduce the economy’s reliance on exhaustible resource stocks. At the same time, the government should continue to incentivate and finance the change to an environmentally friendly consumption mentality.
(g) Given the global dimension of environmental problems, the government should actively take the initiative in the creation of a supranational institution for controlling and negotiating the execution of the sustainability requirements at the global level, as proposed in Padilla (2002).
6. Concluding remarks
In barely two decades, rapid economic growth has transformed China into the workshop of the world. China’s economic performance now leads the developing world. However, our examination of the current state of environment and the sustainability of China’s economic development, which involves assessments based on the indices of Green NNP and ecological footprint, shows that the current development is approaching or has already exceeded China’s environmental regeneration capacity. Hence, the current development paradigm may not be capable of leading China to a
sustainable future as it is largely efficiency-oriented, which is only effective when economic activities are still within the environment’s regeneration capacity. Our accounts also show the necessity for, and the possible components of, a development paradigm transformation in China, where the challenge seems to be rather prominent.
Without doubt, the prescriptions provided in this paper are far from exclusive. We emphasize the need for a new development paradigm that is less efficiency-oriented, but more equity-oriented.
It may be argued that to effectively protect the welfare of future generations, detailed strategies and actions are indispensable. But debate such as the reordering of development priorities is the necessary first step. It is hoped that this paper could lay such needed foundations for any discussion on concrete action plans.
Appendix I
For resource stock depletion, we consider the domestic depletion of five natural resources:
coal, oil, natural gas, mineral resources and forests. Chinese mineral, coal, natural gas, and oil production and prices figures have been calculated using data in China Statistical Yearbook (NBS, 1990-1999) and Input-Output Table of China (NBS, 1990, 1992, 1995, 1997). Marginal cost figures were not found. According to Report on the State of the Environment in China (SEPA, 1990-1999), the increase in forest stock continues to surpass the consumption of forest resources since 1990.
Due to the lack of relevant data, the surplus in the forestry area has been assumed to be able to account for the loss of the grasslands and wetlands during the same period (both are experiencing a steady decrease), and forestry has since been treated as constant over time.
Environmental degradation considered for the calculation of the AENP includes the emission of pollutants from industrial waste gases, the discharge of industrial waste water, and the generation of industrial solid waste. Damage costs were applied to net emissions figures (gross emissions minus those emissions that are reported to have been treated and are meeting standards concerning discharge) to derive the aggregate environmental degradation for any year. Environmental degradation for any year also includes the figures for the economic losses due to industrial and fishery pollution accidents. The above data all come from Report on the State of the Environment in China (1990-1999). Due to data insufficiency, the effects on human health were not included.
Appendix II
According to Wackernagel et al. (2002), EF includes six types of biologically productive space.
They are (1) cropland, which is used to grow crops for food, animal feed, fiber, oil, and rubber; (2) grazing land, which is used to graze animals for meat, hides, wool and milk; (3) forest, which is used to plant and harvest timber for wood, fiber, and fuel; (4) fishing ground for marine and freshwater fishing; (5) total energy area for fossil fuel; and (6) built-up area, which is used to
accommodate infrastructure for housing, transportation, industrial production, and hydro-electric power. In this paper, we ignore the last category because of its insignificancy as compared with other five categories in China. For details on calculation methods of EF, refer to Wackernagel and Rees (1996), Hanley et al. (1999) and WWF (2002).
Estimated emissions of carbon dioxide come from Report on the State of the Environment in China (SEPA, 1990-1999) and Emissions from Fuel Combustion 1971-2000 (IEA, 2002).
Sources for population and areas of agricultural and forestry used come from Statistical Yearbook (NBS, 1990-2002). Total vehicular distances traveled (for transport) are calculated from Statistical Yearbook (Various years, up to 2002). Data for the world are obtained from the sources listed in Wackernagel and Rees (1996), Hanley et al. (1999) and WWF (2002). For lack of space, these data sources are not included in the References to this paper.
CO2
References
Administrative Center for China’s Agenda 21 (ACCA 21), 1993. China’s Agenda 21: Summary.
www. undp. org / seed / cap21 / china.html.
Ahmed, Y. A., El Sarafy, S., Lutz, E. (Eds.), 1989. Environmental Accounting for Sustainable Development. World Bank.
Arrow, K. J., Bolin, B., Costanza, R., Dasgupta, P. et al. 1995. Economic Growth, Carrying Capacity, and the Environment. Science, 268, 520-521.
Asheim, G. B., 1994. Net National Product as an Indicator of Sustainability. Scandinavian Journal of Economics, 96, 257-265.
Boulding, K., 1966. The Economics of the Coming Spaceship Earth. In: H. Jarrett, ed.
Environmental Quality in a Growing Economy, Johns Hopkins University Press.
Daly, H. E. and Cobb, J. B., 1989. For the Common Good: Redirecting the Economy toward Community, the Environment, and a Sustainable Future. Beacon Press.
Gerlagh R. and Michiel A. K., 2001. Sustainability and the Intergenerational Distribution of Natural Resource Entitlements. Journal of Public Economics, 79, 315-341.
Hanley, N. E., Moffatt, I., Faichney, R. and Wilson, M., 1999. Measuring Sustainability: a Time Series of Alternative Indicators for Scotland. Ecological Economics, 28, 55-73.
Hartwick, J. M., 1990. National Resources, National Accounting and Economic Depreciation.
Journal of Public Economics, 43, 291-304.
Hartwick, J. M., 1995. Constant Consumption Paths in Open Economies with Exhaustible Resources. Review of International Economics, 3, 275-283.
Imura, H., 2002. Asia’s Environmental Problems. In: F. Yoshida, K. Miyamoto, eds. Environment and Development, Iwanami Shoten, 91-120 (in Japanese).
International Energy Agency (IEA) , 2002. Emissions from Fuel Combustion 1971-2000.
OECD. CO2
McGregor, R., 2002. Study Debunks Myths Surrounding Manufacturing Miracle in China.
Financial Times. November 8, 2002, p.6.
National Bureau of Statistics of China (NBS), 1990-2002. China Statistical Yearbook (annually).
China Statistical Publishing House.
National Bureau of Statistics of China (NBS) , 1990, 1992, 1995, 1997. Input-Output Table of China. China Statistical Publishing House.
Organization for Economic Co-operation and Development (OECD) , 2002. China in the World Economy: the Domestic Policy Challenges. OECD.
Hanley, N., Moffatt, I., Faichney, R. and Wilson, M., 1999. Measuring Sustainability: a Time Series of Alternative Indicators for Scotland. Ecological Economics, 28, 55-73.
Padilla, E., 2002. Intergenerational equity and sustainability. Ecological Economics, 41, 69-73.
Pearce, D. and Atkinson, G., 1993. Capital Theory and the Measurement of Sustainable Development: An Indicator of ‘Weak’ Sustainability. Ecological Economics, 8, 103-108.
Repetto, R., Magrath, W. E., 1989. Wasting Assets: National Resources in the National Income Accounts. World Resource Institute.
SEPA (State Environmental Protection Administration of China), 1990-1999. Report on the State of the Environment in China (annually). SEPA.
SEPA (State Environmental Protection Administration of China), 2002. The National Tenth Five-year Plan for Environmental Protection. SEPA.
Solow, R. M., 1993. An Almost Practical Step towards Sustainability. Resource Policy, 19, 162-72.
Starke, L. (Ed.), 2001. State of the World 2001: a Worldwatch Institute Report on Progress toward a Sustainable Society. W. W. Norton and Company.
United Nations (UN), 1992. Rio Declaration on Environment and Development. United Nations.
United Nations (UN), 1992. Agenda 21. United Nations.
Wackernagel, M. and Rees, W. E., 1996. Our Ecological Footprint: Reducing Human Impact on the Earth. New Society Publishers.
Wackernagel, M., Schulz, N. B., Deumling, D., Linares, A. C., Jenkins,M., Kapos,V., Monfreda C., Loh, J. Myers, N., Norgaard, R. and Randers, J., 2002. Tracking the Ecological Overshoot of the Human Economy. Proceedings of the National Academy of Sciences, 99, 9266-9271.
Weitzman, M. L., 1976. On the Welfare Significance of National Product in a Dynamic Economy.
Quarterly Journal of Economics, 90, 156-162.
World Commission on Environment and Development (WCED), 1987. Our Common Future.
Oxford University Press.
Worldwatch Institute, 2002. Vital Signs 2002: The Trends that are Shaping Our Future. W. W.
Norton & Company.
World Wide Fund for Nature (WWF), 2002. Living Planet Report 2002. WWF International.