agglomerations of manufacturing industries in China
journal or
publication title
Keizaigaku‑Ronso (The Doshisha University economic review)
volume 61
number 1
page range 153‑172
year 2009‑07‑20
権利(英) The Doshisha Economic Association
URL http://doi.org/10.14988/pa.2017.0000012479
【研究ノート】
An Analysis of the Spatial Changes in the Agglomerations of Manufacturing Industries in China
Wang Qing
*1.Introduction
It is well known that great advances have been made in Chinese economic
performance after the 1978 reform and opening-up policy. China is the third biggest economy today next to US and Japan with a nominal GDP of US$3.42 trillion (2007). Since 1978 China’s GDP has grown on an average rate of 9.9% annually. With the development of Chinese economy, there has been clear trend of manufacturing industries clustering, especially in the coastal areas.This paper, beginning with section 2, makes a brief review of the studies of
the agglomerations of manufacturing industries in China. Section 3 will define geographical areas of China to analyze the agglomerations of manufacturing industries. Section 4 firstly presents a hypothesis that Core-Periphery pattern has shifted after 1978, and then tries to prove the hypothesis. Section 5 is conclusion.2.Review of the studies of agglomeration in China1)
Lu and Tao
(2006) calculated the Ellison and Glaeaser index to describe the industrial agglomeration in China. They analyzed the reason of industrial* The author is greatly indebted to Prof. Tokuoka Kazuyuki. The author also appreciates the valuable suggestions made by Prof. Shinohara Soichi.
1) This section is mainly based on Zhao (2006).
agglomeration and found that local protectionism and Marshallian externalities play a substantial role in forming industrial agglomeration in China.
Fan and Scott
(2003) calculated the Herfindahl index to describe the level of industrial agglomeration in China. They also checked the relationship between industrial agglomeration and productivity, and found there is positive relationship between them.Fei’
s study (1994)2) is one of the earliest researches on industrial cluster in China by Chinese scholars. He studied the industrial cluster in Shandong Province and proposed a method to study regional economy from the aspect of the industrial cluster.Wang and Zhao
(2001)3) analyzed the industrial clusters in traditional industries in Wenzhou, Zhejiang, China. They found that even these clusters can bring some competitive advantages.Jin and Zhu
(2002)4) analyzed the problem of the specialized industrial zones formed as the result of the large-scale cluster of the medium- and small-sized enterprises in a fixed location over several decades.Ying
(2002)5) studied about the industrial cluster in Wenling, Zhejiang, China and found that it has boosted the urbanization process in the local regions.Liang
(2003)6) analyzed the different degrees of industrial cluster in the different regions in China.2) Fei, H., (1994)“Towards Theory and Methodology of the Delimitation of the Industrial Belt,” Acta Geographica Sinica, Vol.49, No.3. Refer to Zhao (2006).
3) Wang, J., and J. Zhao, (2001)“Analysis on the Phenomenon of Industrial Cluster,” Management World, No.6. Refer to Zhao (2006).
4) Jin, X., and X. Zhu, (2002)“The Origin and Evolution of Specialized Industrial Districts: A Historical and Theoretical Approach,” Economic Research Journal, No.8. Refer to Zhao (2006).
5) Ying, H., (2002)“The Industrial Cluster Effect in the Process of Urbanization,” Enterprise Reform and Management, No.11. Refer to Zhao (2006).
6) Liang, Q., (2003)“GINI-coefficient of Chinese Manufacturing Industry,” Statistical Research, No.9.
Refer to Zhao (2006).
Wen
(2004) studied the industrial clusters in the different regions in China with the data of the Secondary and Tertiary Industrial Survey. The result shows that up to 1995, many of China’s manufacturing industries had been highly clustered in the few coastal provinces.Fan
(2004)7) proposed that the industrial cluster caused by the market unification tends to lead to the specialization of the region in a particular industry.Chen and Wang
(2005) studied the influence of the public policies on the development of the industrial cluster in China. They thought that the industrial clusters in China were based on the market development, the globalization and the industrial modernization.Luo and Cao
(2005)8) suggested that the degree of concentration of the electronic and telecommunication equipment manufacturing industry is highly and positively correlated with the gross value of the products.3.The definition of geographical areas in China
China is divided into 3 main areas, East China, West China and Central China
traditionally. Since China is a country with vast areas and population, it is difficult to generalize China’s economic characteristics accurately with only the 3 main geographical areas. Economics researchers sometimes divide China into six areas, seven areas, eight areas or nine areas depended on the problems they focus on.In
“The Characteristics Analysis on Regional Society and Economy Development
in China”(Development Research Center of State Council of China), China is divided into eight areas. In this case, the following 3 factors are taken into account. The first factor is the geographical proximity: the provinces which are close to each7) Fan, J., (2004)“Market Integration, Regional Specialization and Tendency of Industrial Agglomeration:
An Implication for Regional Disparity,” Social Sciences in China, No.6. Refer to Zhao (2006).
8) Luo, Y. and L. Cao, (2005)“A Positive Research on Fluctuation Trend of China’s Manufacturing Industrial Agglomeration Degree,” Economic Research Journal, No.8. Refer to Zhao (2006).
other are included in one group. The second factor is the similarity of provinces’
characteristics in reference to history, natural resources and social structure. The similarity of the level of economic development, which makes it easy to analyze economic development and policy, is the third factor.
The 8 geographical areas division based on the 3 factors mentioned above is
justifiable and used to separate China into five areas in this paper. Considering the research objectives in this paper, focusing on the agglomerations of manufacturing industries, the provinces which have the same industry characteristics should be put into one area. Table 1 is the comparison between the eight areas of division and the five areas of division used in this paper.Eight Areas (depended on the
State Council of China) Five Areas (in this paper) Difference Northeast Liaoning, Jilin,
Heilongjiang Northeast Liaoning, Jilin,
Heilongjiang Same
Norh Coastal Beijing, Tianjin,
Hebei, Shandong Three Cities Beijing, Tianjin, Shanghai
×Hebei,
×Shangdong,
◦Shanghai East Coastal Shanghai,
Jiangsu, Zhejiang
Coastal
Jiangsu, Zhejiang, Fujian, Guangdong, Hainan, Shandong
×Shanghai,
◦Shandong South
Coastal
Fujian, Guangdong, Hainan
Yellow River
Shannxi, Shanxi, Henan,
Inner-mongolia Central
Shannxi, Shanxi, Henan, Hubei, Hunan, Jiangxi, Anhui, Hebei
◦Hebei,
×Inner-Mongolia Yang Zi River Hubei, Hunan,
Jiangxi, Anhui Southwest
Yunnan, Guizhou, Sichuan, Chongqing, Guangxi
West
Yunnan, Guizhou, Sichuan, Chongqing, Guangxi, Gansu, Qinghai, Ningxia, Xizang, Xinjiang, Inner-Mongolia
◦Inner-Mongolia Northwest
Gansu, Qinghai, Ningxia, Xizang, Xinjiang
Table 1 Comparison between Eight Areas and Five Areas
The third column is the difference between them. The mark of “◦”
stands for provinces that are included in five areas but not in eight areas. Mark of“
×”
stands for the opposite case.(1)Beijing, Tianjin and Shanghai are the industrial centers in China before reform and opening-up policy. This paper put the three cities into one area called the Three Cities.
(2)Hebei province has similar characteristics as those of the provinces in the Central area. Provinces in the Coastal area in this paper have benefited from the special policy on opening to the world since the beginning of the reform and opening-up policy, but Hebei province has not enjoyed the benefit from that kind of policy. So Hebei province is put into the Central area in this paper.
(3)Shandong province is near to the sea and has benefited from the special opening-up policy since the beginning of the reform and opening-up policy. So Shandong province is considered to put into the Coastal area in this paper.
(4)Inner-Mongolia has made great development recently, but the average development level is still low. According to the China Western Development Policy, Inner-Mongolia is also included in the West area, and this paper also considers it part of the West area.
Table 2 shows the population and area information for five areas in 2006.
Table 2 Population and Area in Five Areas in 2006
Northeast Three Cities Coastal Central West Population
(10,000 people) 10817 4471 35537 45884 32422
Area
(10,000 square kilometers) 80.17 3.43 71.64 142.1 660.97 Population Share (%) 8.38 3.46 27.52 35.53 25.11
Area Share (%) 8.37 0.36 7.48 14.83 68.97
Data source: China Statistical Yearbook, 2007.
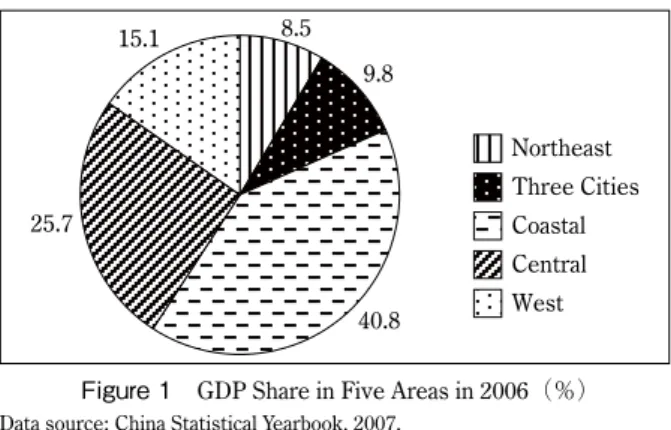
Figure 1 is GDP share of five areas in 2006. The Coastal area has the biggest
GDP share but only 27.5% of population. On the contrary, the West area has 25.11%of population but only 15.15% of GDP. It is clear that although China’s economy has greatly developed, the development level is not the same among five areas. Section 4 will show that Chinese manufacturing industries are mainly agglomerated in the Coastal area.
4.Shift of the Core-Periphery pattern in China 4. 1 Core-Periphery pattern
According to Krugman
(1991), Core-Periphery pattern tends to appear as industry clusters in geographical areas. He says as follows:“while the geographical
structure of production may be stable for long periods of time, when it does change it may change rapidly. …Change when it comes may be influenced strongly not only by objective conditions but also by expectations―expectations that may be self- fulfilling”(pp.26-27).Fujita et al.
(2004) argued that a sort of ‘flying geese pattern’ of inter-regional manufacturing relocation occurred in Japan.Figure 1 GDP Share in Five Areas in 2006(%)
Data source: China Statistical Yearbook, 2007.
Hypothesis
This paper suggests that before reform and opening-up in 1978, the
manufacturing industry center of China was the Three Cities and the Northeast.After that it shifted to the Coastal area. This could be thought as the dynamics of Core-Periphery pattern in China, which implies that the same kind of flying geese pattern of inter-regional manufacturing relocation occurred in China as in Japan.
4. 2 Dynamics of regional share in manufacturing industries from 1952 4. 2. 1 From 1952 to 1977
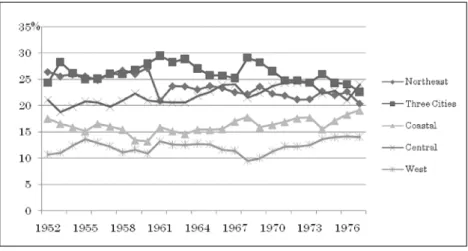
Figure 2 is the manufacturing industry value-added shares of five areas from
1952 to 1977.According to Figure 2, it is known that the Three Cities shared a quarter of
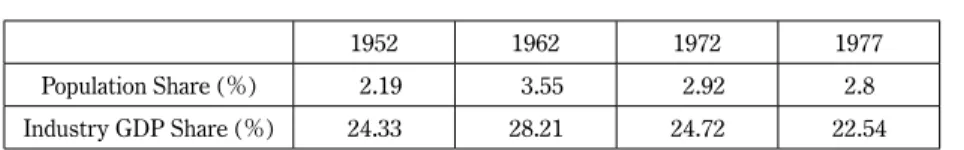
China’s manufacturing industry value-added constantly from 1952 to 1977. The Northeast is also the area which shared great part of manufacturing industry in China during the analyzed period.Table 3 and Table 4 are the manufacturing
Figure 2 Manufacturing Industry Value-added Shares from 1952 to 1977 Data source: New China Annual Year Book for 50 Years, 2003.
industry value-added shares and population share of the Three Cities and the Northeast in 1952, 1962, 1972 and 1977.
From Figure 2 and Table 3 we can know that the Three Cities has only about 2%
~
4% population share in China, but shares about 25 % manufacturing industry
GDP. Comparing Figure 2 and Table 4 we also notice that the Northeast shares about 20% industry GDP but it only has about 9% population.According to the discussion above, it can be said that the Three Cities and the
Northeast had played the role as the center of manufacturing industry in China from 1952 to 1977.4. 2. 2 From 1978 to 2004
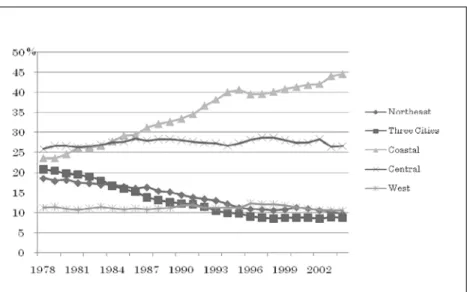
Figure 3 and Figure 4 are the manufacturing industry value-added shares and
secondary industry employment shares of five areas from 1978 to 2004.We can notice that Figure 3 is quite different from Figure 2. We can see clear
increasing development trends in the Coastal area and decreasing development trends in the Three Cities and the Northeast. At the same time, the Central area1952 1962 1972 1977
Population Share (%) 7.15 8.8 9.01 8.99
Industry GDP Share (%) 26.39 23.65 21.12 20.28
Table 4 Northeast
Data Source: New China Annual Year Book for 50 Years, 2003.
1952 1962 1972 1977
Population Share (%) 2.19 3.55 2.92 2.8
Industry GDP Share (%) 24.33 28.21 24.72 22.54
Table 3 Three Cities
Data Source: New China Annual Year Book for 50 Years, 2003.
Figure 3 Manufacturing Industry Value-added Shares from 1978 to 2004 Data source: New China Annual Year Book for 50 Years, 2003 and China Statistical Yearbook from 2000 to
2005.
Figure 4 Secondary Industry Employment Shares from 1978 to 2004
Data source: New China Annual Year Book for 50 Years, 2003 and China Statistical Yearbook from 2000 to 2005.
and the West area have remained on almost the same share level for 25 years.
(1)The Coastal area
The manufacturing industry value-added share has grown from 23.53% in 1978 to
44.55% in 2004. The industry employment share during the study period has changed from 28.36% to 38.65%.(2)The Three Cities and the Northeast
The opposite situation can be seen in the Three Cities and the Northeast. The
manufacturing industry value-added shares for the Three Cities and the Northeast in 1978 were 21.81%and 18.56%. And it decreased to 8.78% and 9.59% respectively in 2004. The industry employment share of the Three Cities fell from 8.24% in 1978 to 4.87% in 2004. In the Northeast, it changed from 15.85% to 6.86%.According to the discussion in 4.2.2, we can see clearly that after reform and
opening-up (1978), the center of the manufacturing industry has shifted from the Three Cities and the Northeast to the Coastal area.4. 3 Dynamics of LQ pattern
Location quotients
(LQ) for five areas were calculated to find which manufacturing industries are clustered and where they are.Five geographical areas in China are indexed by
i (=1 to 5). Each manufacturing industry is indexed by j (=1 to 19). Let Sij denote area i’s employment share of manufacturing industry j. The LQ for area i in manufacturing industry j is then defined as equation (1)LQ (i)=
Sij /
∑19j=1 ∑i=15 ∑19j=1Sij Sij / ∑i=15 Sij
(1)
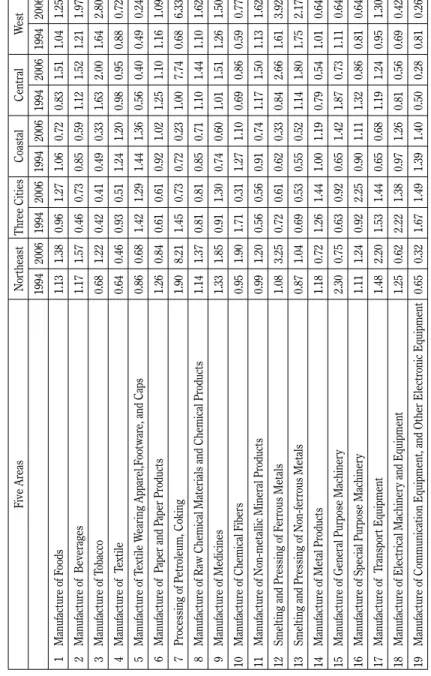
The LQs of 1994 and 2006 is showed in Table 5.
Five AreasNortheastThree CitiesCoastal CentralWest 1994200619942006199420061994200619942006 1 Manufacture of Foods1.131.380.961.271.060.720.831.511.041.25 2 Manufacture of Beverages1.171.570.460.730.850.591.121.521.211.97 3 Manufacture of Tobacco0.681.220.420.410.490.331.632.001.642.80 4 Manufacture of Textile0.640.460.930.511.241.200.980.950.880.72 5 Manufacture of Textile Wearing Apparel,Footware, and Caps 0.860.681.421.291.441.360.560.400.490.24 6 Manufacture of Paper and Paper Products1.260.840.610.610.921.021.251.101.161.09 7 Processing of Petroleum, Coking1.908.211.450.730.720.231.007.740.686.33 8 Manufacture of Raw Chemical Materials and Chemical Products1.141.370.810.810.850.711.101.441.101.62 9 Manufacture of Medicines1.331.850.911.300.740.601.011.511.261.50 10 Manufacture of Chemical Fibers0.951.901.710.311.271.100.690.860.590.77 11 Manufacture of Non-metallic Mineral Products0.991.200.560.560.910.741.171.501.131.62 12 Smelting and Pressing of Ferrous Metals1.083.250.720.610.620.330.842.661.613.92 13 Smelting and Pressing of Non-ferrous Metals0.871.040.690.530.550.521.141.801.752.17 14 Manufacture of Metal Products1.180.721.261.441.001.190.790.541.010.64 15 Manufacture of General Purpose Machinery2.300.750.630.920.651.421.870.731.110.64 16 Manufacture of Special Purpose Machinery1.111.240.922.250.901.111.320.860.810.64 17 Manufacture of Transport Equipment1.482.201.531.440.650.681.191.240.951.30 18 Manufacture of Electrical Machinery and Equipment1.250.622.221.380.971.260.810.560.690.42 19 Manufacture of Communication Equipment, and Other Electronic Equipment0.650.321.671.491.391.400.500.280.810.26
Table 5 Manufacture Industry Employment LQ for Five Areas Data Source: Annual Survey of Industry Firms 1995 and 2007.
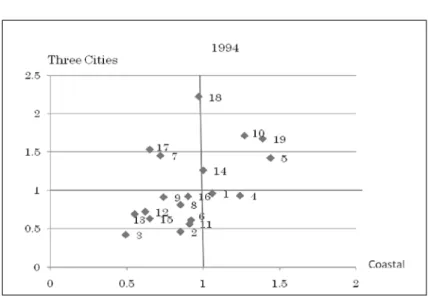
Figure 5 Three Cities against Coastal (1994)
Figure 6 Three Cities against Coastal (2006)
4. 4 Manufacturing industry movement
According to Table 5, manufacturing industry employment LQs have changed
from 1994 to 2006 in five areas.(1)
Figure 5 and 6 are the LQ comparison between the Coastal area and the
Three Cities in 1994 and 2006 respectively. The two figures tell us that industry 6 (paper and paper products), 10 (chemical fibers), 15 (general purpose machinery) moved to the Coastal area. And industry 1 (foods) and 9 (medicines) moved to the Three Cities. From these changes we can conclude that some of the machinery industries and city industries have been moving to the Coastal area. At the same time the Three Cities still has some advantages in machinery industries, such as industry 16 (special purpose machinery), 18 (electrical machinery and equipment) and 19 (communication equipment and other electronic equipment).In 1994, there was a positive correlation of LQ value between the Three Cities
and the Coastal area, but it appears to be uncorrelated in 2006.(2)
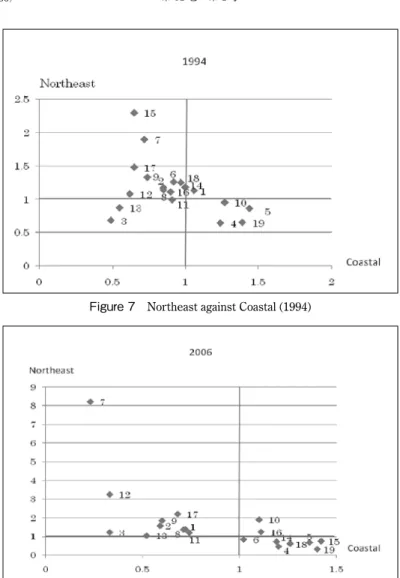
Figure 7 and 8 are the LQ comparison between the Coastal area and the
Northeast in 1994 and 2006. Comparing with the two figures, it is said that industry 3 (tobacco) has moved to the Northeast. Industry 6 (paper and paper products), 14 (metal products), 15 (general purpose machinery) and 18 (electrical machinery and equipment) have moved to the Coastal area. Most of the machinery industries (except 17, transport equipment) are clustered in the Coastal area now.The change in the LQ relation between the Coastal area and the Northeast from
1994 to 2006 is different from the case of the Three Cities. In 1994 the LQ value of the Northeast were negatively correlated with those of the Coastal area and in 2006 that negative correlation becomes much clearer. The industries in which the Coastal area specializes are less clustered in the Northeast. And the reversesituation also holds to be true.
(3)
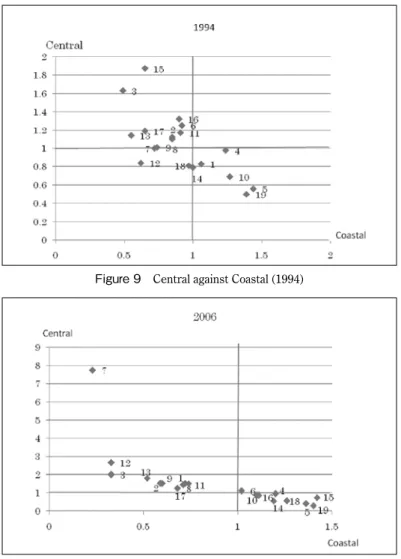
Figure 9 and 10 are the LQ comparison between the Central area and the
Coastal area in 1994 and 2006 respectively. From these figures, we can see thatFigure 7 Northeast against Coastal (1994)
Figure 8 Northeast against Coastal (2006)
industry 1 (foods), 7 (processing of petroleum, coking) and 12 (smelting and pressing of ferrous metals) moved to the Central area. Industry 6 (paper and paper products), 16 (special purpose machinery) and 18 (electrical machinery and equipment) moved to the Coastal area. These facts imply that industries based on natural resources have
Figure 9 Central against Coastal (1994)
Figure 10 Central against Coastal (2006)
relocated to the Central area and machinery industries and city industries have relocated to the Coastal area.
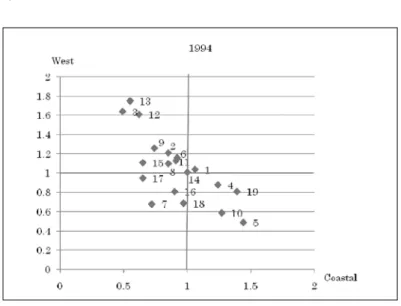
Figure 11 West against Coastal (1994)
Figure 12 West against Coastal (2006)
The pattern of the change in the LQ relation between the Coastal area and the
Central area is similar to the relation between the Coastal area and the Northeast.(4)
Figure 11 and Figure 12 are the LQ comparison between The West area
and the Coastal area in 1994 and 2006. The same conclusion as that in (3) can be drawn.4. 5 Shift of the Core-Periphery pattern
From the analyses of 4.2 and 4.4, we can conclude that the Core-Periphery
pattern of manufacturing industries from 1952 to 1977 in China was not clear though it had appeared that the core consisted of the Three Cities and the Northeast, with the Coastal area as the semi-core and the Central and West areas as the periphery.However, from 1978 to 2006 the Core-Periphery pattern has become much
clearer than before and the core had shifted to the Coastal area. The Central and West areas were still considered as the periphery.The shift of the Core-Periphery pattern of manufacturing industry, meaning a
shift of the core from the Three Cities and the Northeast to the Coastal area can be seen as the spillover from the old core to the new one. We can say that flying geese relocation occurred in China during that period.5.Conclusion
This paper studied the agglomerations of manufacturing industries in China
from 1952 to 2006. We calculated the employment LQ values of manufacturing industries and found that LQ values of five areas had changed between 1994 and 2006. It proves that the Core-Periphery pattern of manufacturing industries had shifted after the reform and opening-up policy in 1978, which implies that the socalled flying geese relocation also occurred in China during the period of the study.
It deserves much deeper research in the future to gain better understanding of this problem.
The reasons that caused the shift of the Core-Periphery pattern of manufacturing
industries are assumed as the following factors: (1) The reform and opening-up policy; (2) Foreign direct investment; (3) Transportation cost and market size.Statistical studies are greatly needed to prove these points in the future too.
【Reference】
Che n, J., and Q. Wang, (2005) “The Sustainable Development of China’s Industrial Clusters and Public Choices,” China Industrial Economy, No.9, pp.5-10.
Fan, C. C., and A. J. Scott, (2003) “Industrial Agglomeration and Development: A Survey of Spatial Economic Issues in East Asia and a Statistical Analysis of Chinese Regions,”
Economic Geography, Vol.79, No.3, pp.295-319.
Fujit a, M., T. Mori, J. V. Henderson, and Y. Kanemoto, (2004) “Spatial Distribution of Economic Activities in Japan and China,” in J.V. Henderson, and J.F. Thisse eds., Handbook of Regional and Urban Economics, Volume 4, Cities and Geography, Elsevier, pp.2911-2977.
Krugman, P., (1991) Geography and Trade, Leuven University Press and The MIT Press.
Lu, J ., and Z. Tao, (2006) “Determinants of Industry Agglomeration: Recent Evidence from China,” Working Paper, Center for China in the World Economy, Tsinghua University.
The State Statistics Bureau of PRC, (1998, 2000~2005, 2007) China Statistical Yearbook, China Statistical Publishing House.
The State Statistics Bureau of PRC, (2003) New China Annual Year Book for 50 Years, Japan Statistical Association.
The State Statistics Bureau of PRC, (1995, 2007) Annual Survey of Industry Firms, China Statistics Press.
Wen , M., (2004) “Relocation and Agglomeration of Chinese Industry,” Journal of Development Economics, Vol.73, No.1, pp.329-347.
Zhao , Z., (2006) “Industry Cluster in China -A Literature Review,” unpublished paper prepared for the seminar of “Formation of Industrial Agglomeration in China and Japanese Enterprises,” held at Doshisha University in January 14 & 15, 2006.
(オウ ケイ・同志社大学経済学研究科後期課程退学)
The Doshisha University Economic Review Vol.61 No.1 Abstract
Qing WANG, An Analysis of the Spatial Changes in the Agglomerations of Manufacturing Industries in China
This paper investigated the spatial changes in the agglomerations of China’
s manufacturing industries in the 1952–2006 period. For this study, China was divided into five areas. The changes in the areas