九州大学学術情報リポジトリ
Kyushu University Institutional Repository
Measurements of PVT and Vapor-Liquid
Equilibrium Properties of Low Global-Warming- Potential Refrigerants
江, 世恒
http://hdl.handle.net/2324/1959127
出版情報:九州大学, 2018, 博士(工学), 課程博士 バージョン:
権利関係:
Measurements of PVT and Vapor-Liquid Equilibrium Properties of Low Global-
Warming-Potential Refrigerants
Ph.D. Thesis Shiheng Jiang
Department of Mechanical Engineering Graduate School of Engineering
Kyushu University Japan
2018
Contents
Nomenclature... iv
Chapter 1 Introduction ... 1
1.1 Background ... 1
1.2 Refrigerants ... 2
1.2.1 First generation ... 3
1.2.2 Second generation ... 4
1.2.3 The third generation ... 5
1.2.4 The fourth generation ... 7
1.2.5 Numbering scheme ... 8
1.3 Literature review ... 10
1.3.1 Thermodynamic properties of R1234ze(Z)... 10
1.3.2 Thermodynamic properties of R1234yf and the binary mixtures with other refrigerants ... 12
1.3.3 Thermodynamic properties of R1123 and the binary mixture with R32. ... 16
1.4 Thesis objective ... 18
1.5 Thesis outline ... 19
Chapter 2 Burnett Method ... 21
2.1 Introduction ... 21
2.2 Fundamental equations ... 22
2.3 Experimental apparatus ... 23
2.3.1 Schematic diagram of the experimental devices ... 23
2.3.2 Pressure vessels ... 25
2.3.3 Isothermal bath and SPRT ... 25
2.3.4 Modification of the pressure transducer ... 28
2.4 Experimental procedure ... 29
2.4.1 Steps of measurement ... 29
2.4.2 Supplying method for R1234ze(Z) ... 30
2.5 Uncertainties of experimental data ... 32
Chapter 3 Vapor-Liquid Equilibrium Measurement ... 33
3.1 Experimental apparatus ... 33
3.1.1 Outline of the experimental facilities ... 33
3.1.2 Structure inside the thermostat bath ... 34
3.1.3 Temperature control system ... 35
3.1.4 Temperature measurement ... 36
3.1.5 Extraction system ... 37
3.1.6 Gas chromatograph ... 38
3.2 Correlation between the area ratio and concentration ... 39
3.2.1 R32 + R1123 ... 39
3.2.2 R32 + R1234yf ... 40
3.2.3 R1123 + R1234yf ... 41
3.4 Uncertainties ... 42
Chapter 4 Experimental Results on PVT Properties ... 43
4.1 PVT property measurements for helium ... 44
4.1.1 Experimental results... 44
4.1.2 Comparisons with the EOS by Ortiz-Vega et al. ... 47
4.2 PVT properties measurements for nitrogen ... 48
4.2.1 Experimental results... 48
4.2.2 Comparisons with the EOS by Span et al. ... 51
4.3 PVT properties measurements for R134a ... 52
4.3.1 Experimental results... 52
4.3.2 Comparisons with Tillner-Roth and Baehr’s EOS ... 55
4.4 PVT properties measurement for R1234ze(Z) ... 56
4.4.1 Experimental results... 56
4.4.2 Comparisons with other published data and the EOS by Akasaka et al. ... 59
Chapter 5 Experimental Results on VLE Properties ... 62
5.1 VLE properties for binary mixture of R32 + R1234yf ... 62
5.1.1 Experimental results... 62
5.1.2 Comparisons with the EOS and other published data. ... 63
5.2 VLE properties for the binary mixture of R32 + R1123 ... 65
5.2.1 Experimental results... 65
5.2.2 Comparisons with the EOS with default mixing parameters ... 66
5.3 VLE properties for the binary mixture of R1123 + R1234yf ... 69
5.3.1 Experimental results... 69
5.3.2 Comparison with the EOS with default mixing parameters ... 69
5.4 Discussion ... 72
Chapter 6 Conclusions ... 76
Reference ... 80
Acknowledgement ... 88
P Pressure
PEOS Calculated pressure by EOS
PEXP Experimental pressure
Z Compressibility factor
V Volume
VA Volume of sample cell
VB Volume of expansion cell
R Gas constant
m Mass
N Cell constant
k Coverage factor
y Concentration
ymass Mass fraction
x Area ratio of peaks
U kij
Uncertainty
Interaction parameters Greek symbols
𝜌 ω
Density
Acentric factor
Nomenclature
Chapter 1 Introduction
1.1 Background
Since 1980, the earth’s surface temperature rises at a step of average 0.74 K per year and in the 21st century the coldest year (2008) was warmer than all the years in the 20th century except for 1998. [1] The phenomenon of this climate change called global warming which is observed in the scale of century will cause enormous effect on the environment of human habitation. Although the periodic motion of the earth and the sun will cause climate change, the human activities such as emissions of greenhouse gases are also considered as a significant factors to accelerate the warming rate which is almost double in the last half century. Therefore some societal should response to global warming problem like mitigation by emissions reduction.
In the recent decades, the hydrofluorocarbons (HFCs) become the most widely used refrigerants which are known as nonozone depleting agents. However the greenhouses effect of these kinds are also substantial and their global warming potential (GWP) values are hundreds or thousands times larger than the carbon dioxide. To achieve the goal of emissions reduction of greenhouse gases, a global agreement signed in Kigali recently to limit the use of HFCs starting by 2019. Consequently, new active area of research has been promoted toward the development of low GWP new refrigerants.
Hydrofluoroolefins (HFOs) have been synthesized as a low GWP alternative to the third generation HFC refrigerants, but some HFOs have the problem of flammability. In order to maintain the safety of home refrigerators and air-conditioners, mixing a small amount of HFCs with HFOs may be effective.
The further study on fully characterizing them and their blends with other compounds is still required to fully assess their performance to replace the ones in current
Chapter 1 Introduction
Chapter 1 Introduction
use. The understanding of thermodynamic properties behavior of new refrigerants are of great importance as fundamental information for developing industrial equipment working fluids such as heat pump systems, organic Rankine cycles and refrigerators. In this study, an expansion method also called Burnett method was applied to measure the PVT properties. The apparatus has been developed and verified by measuring some substances which have published data and equation of state. The PVT properties of new low GWP refrigerant cis-1,3,3,3-tetrafluoropropene (R1234ze(Z)) have been measured at temperature from 353 K to 413 K. For the vapor-liquid equilibrium properties, binary mixture as shown in the Fig 1.1 of difluoromethane (R32), trifluoroethylene (R1123) and 2,3,3,3-tetrafluoroprop-1-ene (R1234yf) have been measured at temperature from 273 K to 313 K.
Figure 1.1 Binary mixtures of next generation of refrigerants in this study
1.2 Refrigerants
In the ancient times, human beings utilized the ice, vaporization of water, and other evaporation process to achieve the goal of refrigeration. From 1600s to 1700s, plenty of researches about phase change had been done in different countries to establish the foundation for artificial refrigeration. In 1830s, Perkins [2] invented the first vapor-
Chapter 1 Introduction
compression machine. To commemorate Perkins’ distinguished work, the mechanical vapor-compression approach is identified as the Perkins Cycle. Since then the time of the development of the refrigerants arrived. According to James M. Calm et al. (2008) [3]
description, the development of the refrigerants can be divided into 4 generations as shown in the Table 1.1.
Table 1.1 Generations of the refrigerants
1th generation 2nd generation 3rd generation 4th generation Times 1830 ~ 1930 1931 ~ 1990 1991 ~ 2010 2010 ~ Present Refrigerants CO2, NH3,
SO2, H2O, Air
CFCs, HCFCs, NH3, H2O
HFCs, NH3, HCs, CO2
HFOs, NH3. HCs, CO2
1.2.1 First generation
From 1830s to 1930s, almost all kinds of refrigerants were flammable, toxic, or both, and some had the potential of strong chemical reaction [4]. The only way to determine whether one substance can be utilized as refrigerant was if it can work. During this period, many kinds of technology of refrigeration were studied. The applications of steam compression refrigerators, air circulation refrigerators, absorption refrigerators and water evaporative refrigerators had worked through nearly the whole one hundred years.
Originally, the methyl ether (RE170) was applied in steam compression refrigerator.
Later period, ammonia (R717), carbon dioxide (R744), sulfur dioxide (R764) and chloromethane (R40) were applied. Especially, the development of utilizing the ammonia had promptly evolved the technology of this refrigerator. Around 1900s, the USA, England and German had promoted updating the refrigerants to ammonia and carbon dioxide [5].
Chapter 1 Introduction
The absorption refrigerator used ammonia water to produce ice. While the process of sulfur dioxide absorbing vapor water was applied in the water evaporative refrigerator to produce ice.
1.2.2 Second generation
Compared with the first generation, the second generation had better safety and durability. From 1931 to 1990, the fluorochemicals, one kind of the halohydrocarbon (CFCs, HCFCs), became the major refrigerants all over the world. The new refrigerants with the properties shown in the Table 1.2 [4, 6] of non-toxic and incombustibility (A1) had satisfied the demand of the increasing air conditioning industry for over 60 years. For the second generation, the ammonia was still applied due to the low price and the excellent thermodynamic property. [7] However the market shares of the ammonia was gradually decreasing because of the toxicity and pungent penetrating odor.
Among the second generation, the R12 was widely utilized in the household refrigerator, cabinet freezer and display cabinet. In addition, the R12 was the only refrigerant in the vehicle air conditioner. The R22 was applied in household air conditioner, large-scale heat pump. The R11 was used in large scale centrifugal water chiller.
Chapter 1 Introduction
Table 1.2 The second generation of refrigerants [4, 6]
Refrigerants Category Safety ODP
R12 CFC A1 1.0
R11 CFC A1 1.0
R114 CFC A1 0.6
R113 CFC A1 0.8
R22 HCFC A1 0.055
R13 CFC A1 1.0
1.2.3 The third generation
After 1970s, people realized that the CFCs did harm to the ozone in the stratosphere and caused the ozonosphere hole over the Antarctica. The oxygen reactions [8] in the atmosphere can be expressed as the following formulas, so called Chapman cycle:
𝑂 + 𝑂2 → 𝑂3 (1.1)
𝑂 + 𝑂3 → 𝑂2+ 𝑂2 (1.2)
𝑂3+ ℎ𝑣 → 𝑂2+ 𝑂 (1.3)
While the (1.1) ~ (1.3) are inadequate to explain the depletion of the ozone in the atmosphere. The reaction with other small components of the atmosphere, X:
𝑂 + 𝑋𝑂 → 𝑋 + 𝑂2 (1.4)
𝑂3+ 𝑋 → 𝑋𝑂 + 𝑂2 (1.5)
𝑂3+ 𝑂 → 𝑂2+ 𝑂2 (1.6)
Where X = OH, NO, ClO, BrO, etc. [9]Before the X is destroyed in other reactions, the molecule X can destroy thousands of ozone molecules. The X abounds in the halogen hydrocarbons which is the major category of the second generation of refrigerants.
Chapter 1 Introduction
The value of ODP (Ozone Depletion Potential) identifies the level of harmfulness to the ozone. The ratio of the impact on ozone of a chemical compared to the impact of a similar mass of R11. Thus, the ODP of R11 is defined to be 1.0. [10]
Therefore, according to the Montreal Protocol on Substances that Deplete the Ozone Layer and Vienna Convention for Protection of the Ozone Layer, the deadline of the utilization of CFCs had been proposed. And the third generation of refrigerants with low ODP value were demanded to gradually replace the second generations. Table 1.3 [4, 6]
shows the properties of some most widely used third generation refrigerants with non ODP values.
Table 1.3 The third generation of refrigerants [4, 6]
Refrigerants Category Safety ODP GWP
R32 HFC A2L 0 675
R23 HFC A1 0 14760
R125 HFC A1 0 3500
R134a HFC A1 0 1430
R143a HFC A2 0 4470
R152a HFC A2 0 124
R404A HFC A1 0 3900
R407C HFC A1 0 1800
R410A HFC A1 0 2100
R507A HFC A1 0 4000
Chapter 1 Introduction
1.2.4 The fourth generation
The third generation of refrigerants had successfully controlled the ozone depletion while the new researches and political debate of global warmings become the main problem. GWP is the short name for global warming potential which was firstly introduced in the Inter-governmental Panel on Climate Change (IPCC) [11] and the concept of GWP was further refined [12, 13] to guide and support decisions in industry and environmental policies. From the Table 1.3, almost all the third generation’s refrigerants have very large GWP values.
Consequently, United Nations Framework Convention on Climate Change (UNFCCC) had put forward the stipulation: Carbon dioxide (CO2), methane (CH4), nitrous oxide (N2O), HFCs, PFCs and sulfur hexafluoride (SF6) are the greenhouse gases.
And the advanced country should reduce to exhaust greenhouse gases.
Therefore the development of the next generation of refrigerant with low GWP values is extremely urgent. Table 1.4 shows the candidates for the fourth generation of refrigerants. Among all the candidates of next generation of refrigerants, HFOs were recently synthesized as alternatives of HFCs. The researches of the fundamental thermodynamic and kinetic properties are very few. Therefore, the development of new applications using the new low GWP refrigerants is limited by the lack of accurate experimental data.
Chapter 1 Introduction
Table 1.4 The candidates of the fourth generation of refrigerants
Candidates Considerations
Natural refrigerants Safety
Low GWP HFCs Flammability
HCs, HEs Flammability
HFOs Flammability, Toxicity, Compatibility
1.2.5 Numbering scheme
The current numbering scheme is based on ASHRAE Standard 34-67 [14] published by American Society of Heating, Refrigerating, and Air conditioning Engineers in 1967.
The first character of ‘refrigerant’–‘R’ is the prefix of identifying number of refrigerants and the structure of the molecular is the suffix.
a) Inorganic compounds
The first number of the suffix is ‘7’, so the code of inorganic compounds can be written as R7 + numbers. Within the brackets it is formed by relative molecular mass of compounds.
E.g. Carbon dioxide, CO2, the relative molecular mass is 44. So the code is R744.
b) Hydrocarbons and derivatives
The molecular formula of the saturated hydrocarbon is CmHm+2. When the atom of the hydrogen has been replaced by other atoms like fluorine (F), chlorine (Cl), bromine (Br) and others, the formula of the derivatives will be CmHnFxClyBrz, and
𝑛 + 𝑥 + 𝑦 + 𝑧 = 2𝑚 + 2 (1.7) The identification number is expressed as R(m-1) (n+1) (x) B (z), if z is 0, the B can be omitted. E.g. Molecular formula: CHF2Cl, m – 1 = 0, n + 1 = 2, x = 2, z = 0, therefore the identification number is R22.
Chapter 1 Introduction
Molecular formula: CH4, m – 1 = 0, n + 1 = 5, x = 0, z = 0, therefore the identification number is R50.
However the identification number of n-butane (n-C4H10) should be R600.
In addition, if the compound is allotropic substance, successive lowercase letters (i.e.
a, b or c) are appended. For example, R152a while the iso-butane is R600a.
For cyclic derivatives, the letter ‘C’ is added at the front of the identification number of the refrigerants. For example, the octafluorocyclobutane (C4F8), RC318.
For unsaturated hydrocarbons and its derivatives, the number ‘1’ is added before the refrigerant’s identification number. For example, the ethylene (C2H3), R1150.
For the fluorinated propene isomers, the numbering scheme is based on the ANSI/ASHRAE Standard 34 [14], agenda adopt nomenclature rules for the ethene (ethylene, R1150, CH2=CH2) and propene (propylene, R1270, CH3CH=CH2) based refrigerants that have been already implemented in industry and academia. Table 1.5 [15]
summarizes those rules that distinguish the propene isomers.
c) Azeotropic and zeotropic mixtures
Azeotropic mixtures is assigned an identifying number in the 500 series. And zeotropic mixtures is assigned an identifying number in the 400 series.
Chapter 1 Introduction
Table 1.5 Proposed suffix scheme for propene isomers [15].
First appended letter Second appended letter Group substitution Letter Group substitution Letter
–Cl x =CCl2 a
–F y =CCl2F b
–H z =CF2 c
=CHCl d
=CHF e
=CH2 f
1.3 Literature review
1.3.1 Thermodynamic properties of R1234ze(Z)
Brown et al. (2009) [16] first provided various estimated thermodynamic properties of R1234ze(Z) by using a cubic equation of state, which are used to predict the performance potential in high temperature heat pumping applications. Also in their work, the theoretical values of critical parameters and acentric factor were presented based on group contribution methods couple with some other estimation techniques. The normal boiling point used in the simulation was taken from Mukhopadhyay et al. (2008) [17].
Brown et al. [16] pointed out R1234ze(Z) deserves further consideration as a substitute for R114.
The experimental data of R1234ze(Z) was firstly published by Kayukawa et al.
(2012) [18]. They used Burnett apparatus and metal bellows volumometer to measure the
Chapter 1 Introduction
vapor pressure at temperature from 273 K to 373 K and 310 K to 410 K, respectively. In addition, the experimental data of single phase density for R1234ze(Z) were obtained by these two measurements. The vapor density was measured by Burnett apparatus at temperature from 283 K to 373 K and the metal bellows volumometer was employed for the liquid density from 310 K to 420 K.
Raabe (2012) [19] published evaluated data of vapor pressures and the saturated vapor and liquid densities from 283 K to 373 K that calculated by the Monte Carlo Gibbs ensemble (GEMC) [20].
Fedele et al. (2014) [21, 22] individually measured the vapor pressure data of R1234ze(Z) in two different laboratories, the Istituto per le Tecnologie della Costruzione of the Consiglio Nazionale delle Ricerche (ITC-CNR) and Università Politecnica delle Marche (UnivPM) for the temperature ranging from 283 K to 353 K and 238 K to 372 K, respectively. In addition, the PVT properties were measured in UnivPM for temperatures approximately from 303 K to 375 K and pressures from 0.082 MPa to 0.436 MPa.
Higashi et al. (2015) [23] determined accurate experimental data for the thermodynamic properties of R1234ze(Z). The critical temperature, critical density and critical pressure were measured on the basis of direct observation of the meniscus disappearance [24, 25]. Vapor pressures were measured at temperature region between 310 K and 420 K. Saturated liquid densities and saturated vapor densities were obtained at temperature from 368 K to 422 K and 356 K to 422 K, respectively. The PVT properties cover temperature from 360 K to 432 K and pressure up to 6 MPa for both single liquid and vapor phase, including some data points close to the critical point. The density was calculated from the mass of R1234ze(Z) and the inner volume of pressure cell.
Tanaka (2016) [26] performed measurements for the vapor pressures and saturated liquid density for R1234ze(Z) by using the extraction method in the temperature range from 300 K to 400 K.
Chapter 1 Introduction
Table 1.6 Summary of experimental data for R1234ze(Z)
Author Year Type of data Reference
Kayukawa et al. 2012
PVT Vapor pressure Vapor and liquid density
[18]
Fedele et al. 2014
Vapor pressure PVT
[21] [22]
Higashi et al. 2015
Critical point Vapor pressure
PVT
[23]
Tanaka 2016
Vapor pressure Saturated liquid density
[26]
1.3.2 Thermodynamic properties of R1234yf and the binary mixtures with other refrigerants
Di Nicola et al. (2010) [27] published the vapor pressure data of R1234yf in a temperature range from 224 K to 366 K and at pressures from 0.039 MPa to 3.218 MPa by using a constant-volume apparatus [28]. The data were fitted to the Wagner equation with an absolute deviation of 0.35 %. Tanaka et al. (2010) [29] conducted various measurements of several thermodynamic properties. The critical parameters were determined by the visual observation of the meniscus disappearance [24, 25]. The vapor pressures, saturated liquid density and saturated vapor density were measured by a batch- type calorimeter with a metal-bellows in the temperature range from 310 K to 360 K. Di
Chapter 1 Introduction
Nicola et al. (2010) [30] performed the PVT properties measurement in the vapor phase of R1234yf at temperature from 243 K to 373 K and pressure up to 3.716 MPa. Richter et al. (2011) [31] measured the vapor pressures from 250 K to 366 K. A two-sinker densimeter [32] was applied to determine the PVT properties in the temperature range from 232 K to 400 K and at pressures up to 10 MPa. Fedele et al. (2012) [33] published a total of 13796 compressed liquid density measurements based on a stainless steel vibrating tube densimeter for eight isotherms evenly space from 283.15 K to 353.15 K and for pressures from close to saturation point to 35 MPa. Klomfar et al. (2012) [34]
reported the liquid phase PVT properties in the temperature range from 217 K to 353 K with a constant volume apparatus [35] and at pressures from 1 MPa to 40 MPa. Yang et al. (2014) [36] presented vapor pressure measurements for R1234yf at temperature from 248.17 K to 361.05 K. Hu et al. (2017) [37] used single-sinker densimeter [38] to measure the PVT properties in the gaseous phase of R1234yf in the temperature range from 252 K to 345 K and pressures up to 1.91 MPa.
For the binary mixtures of R1234yf and other compounds. Kamiaka et al. (2013) [39]
measured vapor-liquid equilibria (VLE) properties for three binary refrigerant mixtures of R1234yf with R32, R125 and R134a at mass fractions of R1234yf from 25 % to 80 %.
The equilibrium pressures were obtained at temperatures from 273 K to 333 K at a step of 10 K for each mixture. Akasaka et al. (2013) [40] presented the measurements of saturated densities and critical parameters for binary mixture of R1234yf and R32 near the critical point at mass fraction at mass fraction of R1234yf with 50 %, 80.01 % and 90 %. Hu et al. (2014) [41] reported the VLE properties for binary mixture of R1234yf and R227ea at 10 K intervals from 283.15 K to 323.15 K over whole composition range.
Juntarachat et al. (2014) [42] published experimental data for the binary mixture of R1234yf and CO2 at seven temperatures ranging from 283.15 K to 353.15 K using a static- analytic type apparatus couple with two electromagnetic capillary samplers [43]. Chen et
Chapter 1 Introduction
the whole composition range at temperatures from 283.15 K to 323.15 K at an intervals of 10 K by a recirculation apparatus. Chen et al. (2015) [45] conducted an experiment of PVTx properties in the gas phase for binary mixtures of R1234yf and R134a in the range of temperature from 298.58 K to 403.24 K and pressures from 0.568 MPa to 3.171 MPa.
The compositions were mole fraction of R134a from 3.80 % to 86.41 % and the densities varied from 0.258 mol dm-3 to 1.258 mol dm-3. Yang et al. (2016) [46] carried out an experiment on the VLE properties for the binary mixture of R1234yf and R245cb system at temperature ranging from 283.15 K to 313.15 K covered all composition range. Higashi (2016) [47] measured various precise thermodynamic properties for the blend of 50 % R1234yf and 50 % R1234ze(E) including PVTx properties from 340 K to 430 K, saturated densities 100 kg m-3 to 900 kg m-3 and critical parameters. Hu et al. (2017) [48] conducted VLE measurements for binary mixture of R32 + R1234yf and R161 + R1234yf by using a quasi-static analytical apparatus [49] with a whole composition range at the temperature range of 283.15 K to 323.15 K and pressure up to 3.2 MPa and 1.8 MPa , respectively.
Cai et al. (2018) [50] measured the single gaseous phase of PVTx properties for blend of R1234yf and R32 by single-sinker magnetic suspension densimeter [38] at temperature from 279.8 K to 347.9 K, pressures from 0.10 MPa to 2.66 MPa and densities from 2.30 kg m-3 to 66.02 kg m-3. Mole fractions of R1234yf changed from 0.062 to 0.610.
All the experimental data are summarized in Table 1.7.
Chapter 1 Introduction
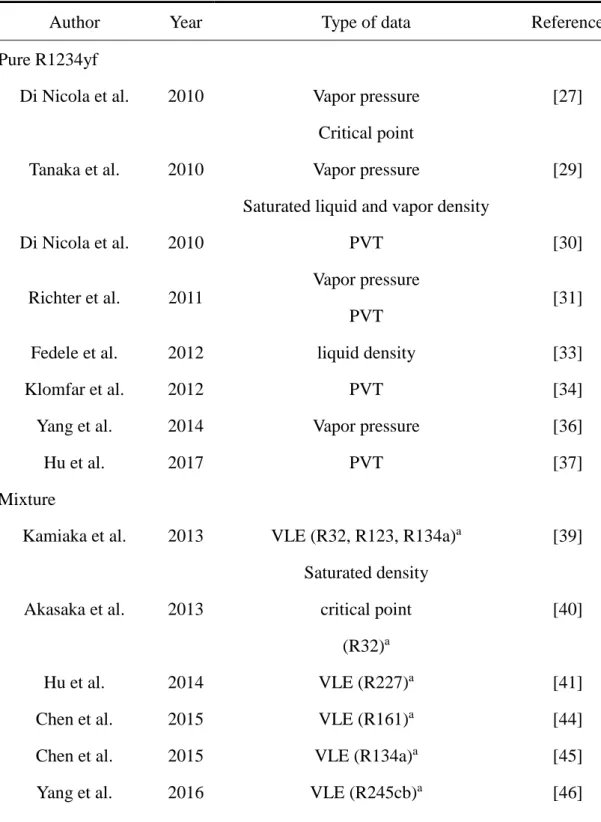
Table 1.7 Summary of experimental data for R1234yf and the mixture with other refrigerants
Author Year Type of data Reference
Pure R1234yf
Di Nicola et al. 2010 Vapor pressure [27]
Tanaka et al. 2010
Critical point Vapor pressure
Saturated liquid and vapor density
[29]
Di Nicola et al. 2010 PVT [30]
Richter et al. 2011
Vapor pressure PVT
[31]
Fedele et al. 2012 liquid density [33]
Klomfar et al. 2012 PVT [34]
Yang et al. 2014 Vapor pressure [36]
Hu et al. 2017 PVT [37]
Mixture
Kamiaka et al. 2013 VLE (R32, R123, R134a)a [39]
Akasaka et al. 2013
Saturated density critical point
(R32)a
[40]
Hu et al. 2014 VLE (R227)a [41]
Chen et al. 2015 VLE (R161)a [44]
Chen et al. 2015 VLE (R134a)a [45]
Yang et al. 2016 VLE (R245cb)a [46]
Chapter 1 Introduction
Author Year Type of data Reference
Higashi 2016
PVTx Critical point Saturate density
(R1234ze(E))a
[47]
Hu et al. 2017 VLE (R32, R161)a [48]
Cai et al. 2018 PVTx (R32)a [50]
a. The refrigerants in the bracket are the substances mixed with R1234yf.
1.3.3 Thermodynamic properties of R1123 and the binary mixture with R32.
R1123 is a new refrigerant first manufactured by Japanese refrigerant company [51]
which GWP value was estimated within 1. The thermodynamic properties of R1123 and its mixtures are very insufficient. Kayukawa et al. (2015) [52] reported the vapor pressures and PVT properties of R1123 in a wide temperature range. Fukushima et al.
(2015) [53] presented the thermodynamic properties of R1123 including the vapor pressures and critical parameters. Higashi et al. (2016) [54] measured PVT properties, vapor pressures, saturated densities and critical parameters. The measurement covered the temperature region from 300 K to 430 K, pressures up to 6.9 MPa and densities between 100 kg m-3 and 900 kg m-3 along seven isochores. Raabe (2016) [55] used the molecular simulation method to predict thermodynamic properties of R1123 including vapor pressures and saturated densities in the temperature range from 230 K to 300 K.
Higashi et al. (2018) [56] conducted saturation pressures measurement for R1123 at temperatures between 278 K and 377 K, and the critical pressures were also obtained.
For the blends of R1123 and other components, Higashi et al. (2016) [54] presented
Chapter 1 Introduction
the PVT properties, VLE properties and critical parameters for the binary mixture of R1123 and R32. The compositions of this mixture were mass fraction of R1123 with 40 % and 60 % and temperature ranges from 310 K to 430 K.
All the experimental data are summarized in Table 1.8.
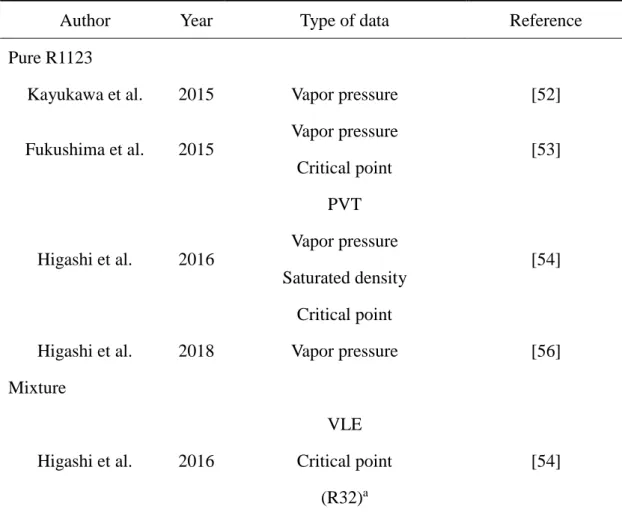
Table 1.8 Summary of experimental data for R1123 and the mixture with other refrigerants
Author Year Type of data Reference
Pure R1123
Kayukawa et al. 2015 Vapor pressure [52]
Fukushima et al. 2015
Vapor pressure Critical point
[53]
Higashi et al. 2016
PVT Vapor pressure Saturated density
Critical point
[54]
Higashi et al. 2018 Vapor pressure [56]
Mixture
Higashi et al. 2016
VLE Critical point
(R32)a
[54]
a. The refrigerants in the bracket are the substances mixed with R1123.
Chapter 1 Introduction
1.4 Thesis objective
In the response to the need of developing new low GWP refrigerants, we conducted two kinds of measurements for the PVT and VLE properties. Since some HFOs have insufficient information of thermodynamic properties, the main objective in this study is to provide high accurate data to contribute the development of equation of state.
A Burnett apparatus was modified to perform the PVT measurement for the pure substances in the single gaseous phase at temperature from 353 K to 473 K and pressures up to 10 MPa. The vapor pressure can also be determined if the initial state inside sample cell is vapor liquid equilibrium condition. To verify the apparatus at first step, some samples with known published data and existing EOS should be measured to test the reliability. The refrigerants utilized in the PVT measurements are the candidates for those used in the high temperature heating pump system.
For the measurement on VLE properties of binary mixtures, the apparatus was designed for the temperature region between 253 K and 423 K. The composition was determined by a gas chromatograph. First the conversion factors that transfer the area ratio of each peaks to concentrations were calculated by measuring the target samples with known mass fraction. Then target samples were measured and the results were compared with existing data and EOS to verify the reliability of the apparatus and needed for the determination of the mixing parameters in mixing models.
The scopes of the present work are as follows:
(1) The apparatus of PVT and VLE properties measurements are designed to provide accurate data for developing accurate EOS. PVT measurements were conducted at high temperature region and VLE measurements were for the low temperature systems.
Chapter 1 Introduction
(2) Helium, nitrogen and R134a were measured by Burnett apparatus to verify the reliability. The densities of each compounds were calculated and discussed.
(3) The conversion functions of gas chromatograph were determined by measuring the binary mixtures of R32+R1123, R32+R1234yf and R1123+R1234yf at room temperature.
(4) R1234ze(Z) was measured by Burnett method at temperature from 353 K to 413 K at an interval of 20 K.
(5) Binary mixture systems of R32, R1123 and R1234yf were measured to determine the VLE properties at temperature from 273 K to 313 K at a step of 10 K.
1.5 Thesis outline
The following is the brief description of the contents of each chapter.
Chapter 1 presents the scientific background and literature review about the thermodynamic properties of HFOs in this study. The vapor pressures, saturated liquid densities, saturated vapor densities, critical parameters and PVT properties are described.
The historical development of refrigerants are also introduced and numerical scheme is presented.
Chapter 2 presents the details of the Burnett apparatus and briefly introduced the Burnett method. The temperature measurement by standard platinum resistance thermometer (SPRT) and pressure measurement by absolute pressure transducer are
Chapter 1 Introduction
discussed. The basic mathematical analysis is introduced for the calculation of densities and determination of compressibility factors. The experimental procedure and special supply system are described. The uncertainties of the experiments are analyzed.
Chapter 3 presents the details of the apparatus for VLE measurement. The temperature and pressure measurements are described and the composition measurement is introduced. Experimental procedure is carefully described. The uncertainties of the experiment are analyzed.
Chapter 4 presents the experimental results from Burnett method. The data of PVT properties of Helium, nitrogen and R134a are introduced and compared with existing EOSs. The deviations of the density and pressure are given. The results of R1234ze(Z) are discussed and compared with other published data and the EOSs. The distribution of the existing data are described.
Chapter 5 presents experimental results for VLE properties. The conversion factors for the composition measurement are introduced. The data of binary blend of R32 + R1234yf is compared with Kamiaka et al.’s data and the existing EOS. Deviations of bubble and dew point pressure are given. The data of binary mixtures of R32 + R1123 and R11234 + R1234yf are discussed and compared with mixing model. The data are correlated with the Peng-Robinson equation.
Chapter 6 presents the overall conclusion of this thesis.
Chapter 2 Burnett Method
In this chapter, the principle, apparatus and experiment processes of Burnett method are introduced in the following subsections. The fundamental equations are shown and pictures of the experimental devices are attached. The experimental procedure are described in details and a supplying method is introduced.
2.1 Introduction
To acquire more accurate PVT properties data at high temperatures and high pressures, E.S. Burnett (1936) [57] invented a method for determining compressibility factors without directly measuring volume or mass. The schematic diagram of the Burnett method is show in Fig. 2.1.
Figure 2.1 The schematic diagram of the Burnett method.
Chapter 2 Burnett Method
Chapter 2 Burnett Method
Two vessels are installed, one is called the sample cell and another is called the expansion cell. Firstly, the substance is filled in the sample cell and then expanded into the evacuated expansion cell repeatedly. After several expansions, the state of the substance remains in the system can be considered as the ideal gas which means the fundamental equation of state of the ideal gas can be applied into calculating the PVT properties. The densities at each state are evaluated by measuring the equilibrium pressures before and after the expansions. The advantage of this method is that mass measurement is not necessary, so that makes this method one of the most effective measurements for PVT properties for the gas phase region.
2.2 Fundamental equations
The PVT relation of the sample in the system can be expressed by the following equation with the compressibility factor, Z
𝑃𝑉 = 𝑍𝑚𝑅𝑇 (2.1)
Where 𝑃 is the pressure, 𝑇 is the temperature, 𝑅 is the gas constant, 𝑉 is the volume, 𝑚 is the mass of the substance. The subscript i denotes the times of expansions, therefor, for ith expansion at constant temperature, the PVT relation of the sample in the sample cell is expressed by
𝑃𝑖−1𝑉𝐴 = 𝑍𝑖−1𝑚𝑅𝑇 (2.2)
The PVT relation after expansion is expressed by
𝑃𝑖(𝑉𝐴+ 𝑉𝐵) = 𝑍𝑖𝑚𝑅𝑇 (2.3) Where 𝑉𝐴 is the volume of sample cell and 𝑉𝐵 is the volume of the expansion cell.
When 𝑖 = 1, 𝑃0 denotes the initial pressure and 𝑍0 denotes the initial compressibility of the sample before the first expansion. Dividing Eq. 2.3 by Eq. 2.1 gives
𝑃𝑖(𝑉𝐴+𝑉𝐵) 𝑃𝑖−1𝑉𝐴 = 𝑍𝑖
𝑍𝑖−1 (2.4)
Here, with the definition of volume ratio 𝑁 = (𝑉𝐴+ 𝑉𝐵)/𝑉𝐴, which is also called
Chapter 2 Burnett Method
the cell constant determined by the sample and expansion cells. Eq. 2.4 gives
𝑃𝑖
𝑃𝑖−1𝑁 = 𝑍𝑖
𝑍𝑖−1 (2.5)
After infinite times of expansions, the cell constant is expressed by 𝑁 = lim
𝑖→∞
𝑍𝑖 𝑍𝑖−1
𝑃𝑖−1 𝑃𝑖 = lim
𝑖→∞
𝑃𝑖−1
𝑃𝑖 (2.6)
From Eq. 2.5,
∏ [ 𝑃𝑖
𝑃𝑖−1𝑁]
𝑛𝑖=1 = ∏ [ 𝑍𝑖
𝑍𝑖−1]
𝑛𝑖=1 (2.7)
is obtained and rewritten as
𝑃𝑛
𝑃0𝑁𝑛 =𝑍𝑛
𝑍0 (2.8)
After expanding the sample infinitely, it is considered as the ideal gas state, the compressibility factor,𝑍𝑛 = 1 and the initial compressibility factor 𝑍0 is determined by
𝑛→∞lim(𝑃𝑛
𝑃0𝑁𝑛) = 1
𝑍0 (2.9)
Thus, for each expansion the compressibility factor 𝑍𝑛 is calculated from 𝑍𝑛 = 𝑍0(𝑃𝑛
𝑃0𝑁𝑛) (2.10)
According to the definition of the compressibility factor, the density of the sample 𝜌𝑛 is calculated by
𝜌𝑛 = 𝑃𝑛
𝑍𝑛𝑅𝑇 (2.11)
In practice, infinite expansion is not reachable. To obtain the value of the volume ratio from the Eq. 2.6, a polynomial equation, which independent variable is Pi and dependent variable is 𝑃𝑖−1/𝑃𝑖, is developed to determine the N as the intercept of the equation.
2.3 Experimental apparatus
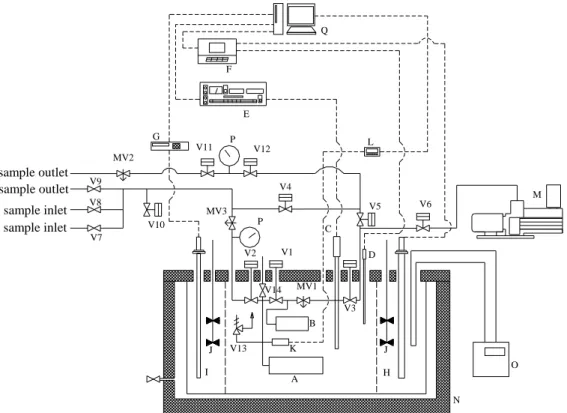
2.3.1 Schematic diagram of the experimental devices
Chapter 2 Burnett Method
2.2. This apparatus was originally designed for the PVT measurement of hydrogen [58].
In this research, a modification was conducted to adjust the apparatus for the measurement of refrigerants. The device of pressure measurement for the sample is an absolute pressure transducer (Paroscientific Co. Ltd. Model 42K-101, maximum pressure region is 13.8 MPa). Isothermal oil bath with the heat transfer media of silicone oil is utilized, and the temperature of the oil bath is measured by a standard platinum resistance thermometers (SPRT, NETSUSHIN Co. Ltd. Model NSR – 660) and a precise thermometer AC bridge (ASL Co. Ltd. Model F700B) according to the International Temperature Scale 1990 (ITS90).
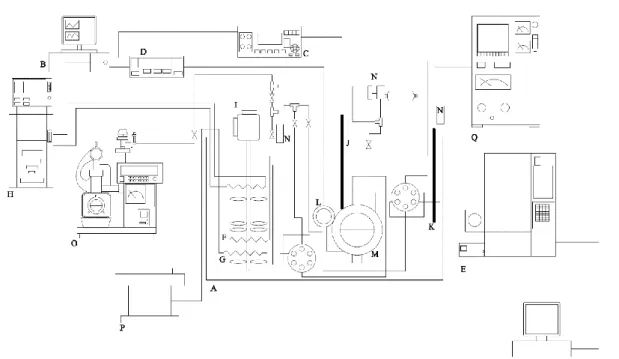
Figure 2.2 The schematic diagram of the apparatus.
A: sample cell B: expansion cell C: platinum resistance thermometer D: thermometer E: thermometer bridge F: temperature controller G: DC power supply H: main heater I: subheater J: stirrer K: quartz pressure transducer L: digital pressure indicator M: vacuum pump N: constant temperature bath O: circulation bath P: pressure gauge Q: personal computer V1~V14, MV1~3: valves
A B
C D E
F
G
I H
J K J
L
M
N
O P
Q
V2 V1
V3 V4
V5 V6
V7 V8 V9
V10 V11
P V12
sample inlet sample inlet
V13
MV1 MV2
sample outlet
MV3
V14
sample outlet
Chapter 2 Burnett Method
2.3.2 Pressure vessels
Two cylindrical pressure vessels are installed, one is the sample cell and another is the expansion cell. The inner volumes of the two cells are 250 cm3 and 100 cm3, respectively. The maximum designed temperature and pressure of the two vessels are 523 K and 100 MPa. The inner and external diameters of the two cells are the same, 35mm and 85 mm. Thus the only difference between the two cells are the length, the length of sample cell is 412 mm and the length of the expansion cell is 256 mm. To make the cells smaller, the Inconel alloy 625 is used because of the larger strength compared with stainless steels at high temperatures.
2.3.3 Isothermal bath and SPRT
Since the experimental condition is isothermal, the constant temperature bath is required. The sample and expansion cell are immersed in the silicon oil for the isothermal expansions. The silicon oil is constantly stirred by four motors (Oriental motor Co. Ltd.
Model 5IK40A-SYN, 40 W) to increase or maintain the temperature.
The temperature of the oil bath is measured by the standard platinum resistance thermometer (SPRT), the specification is shown in the Table 2.1. At the vertical direction, the SPRT is installed which is connected with the precision AC bridge (ASL model F700B). The Model F700B is a high accuracy resistance bridge designed specifically for use in resistance thermometry. Its unique AC bridge circuitry eliminates thermal EMF effects to provide fast, reliable measurements under a wide range of real operating conditions, the specification of the F700B is shown in the Table 2.2.
Chapter 2 Burnett Method
Table 2.1 Specification of the SPRT
Model NSR 660
Resistance at 273.15 K 25 Ω
Specified Current 1 mA
Resistance Ratio R(Ga)/R(0.01) ≥ 1.11807
Temperature Region 273 K ~ 933 K
Basic Accuracy ± 0.001 K
Sensitivity 0.1 Ω/K
Insulation Resistance DC 100V/100 MΩ
Texture of the Protective Tube SUS316 Diameter of the Protective Tube Ф 6.0 mm Length of the Protective Tube 600 mm
Table 2.2 Specification of F700B
Accuracy ± 0.25 mK
Resolution 0.25 mK
Linearity ± 0.25 mK
Warm up time < 30 seconds
According to the ITS90 [59], the relationship between the resistance ratio of the standard platinum resistance thermometer and the triple point of the water is expressed by:
Chapter 2 Burnett Method
W(𝑇90) = 𝑅(𝑇90) 𝑅(273.16 K)
Where R (273.16 K) is resistance of SPRT at the triple point of water,T90refers to the temperature on ITS-90.
The deviation of the SPRT can be expressed by the following interpolated equation,
𝑊𝑟(𝑇90) = 𝑊(𝑇90) − ∆𝑊(𝑇90)
𝑊𝑟(𝑇90) is a correction to 𝑊(𝑇90). ∆𝑊(𝑇90), called the deviation function for the SPRT, depends on the temperature range and can be determined during calibration. In this experiment, the deviation function is expressed as,
∆𝑊(𝑇90) = 𝑎(𝑊(𝑇90) − 1) + 𝑏(𝑊(𝑇90) − 1)2 + 𝑐(𝑊(𝑇90) − 1)3
Here a, b and c are the adjustable parameters which are the calibration constants for the SPRT. Once the value of 𝑊𝑟(𝑇90) has been determined, the temperature can be calculated. For the temperature region above 273.16 K, the reference function can be expressed as:
𝑇90 − 273.15 = 𝐷0 + ∑ 𝐷𝑖[𝑊𝑟(𝑇90) − 2.64 1.64 ]
9 𝑖
𝑖=1
The constants of the formula are given in the Table 2.3.
(2.13) (2.12)
(2.15) (2.14)
Chapter 2 Burnett Method
Table 2.3 Constants
D0 439.932854 D5 0.005184
D1 472.418020 D6 - 0.963864
D2 37.684494 D7 - 0.188732
D3 7.472018 D8 0.191203
D4 2.920828 D9 0.049025
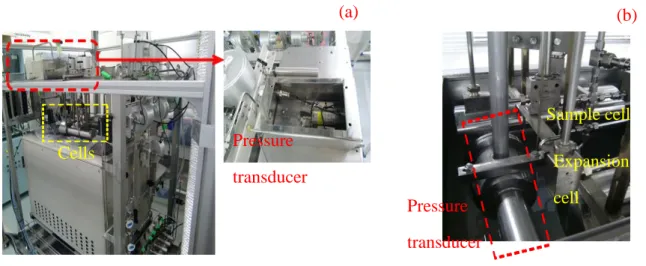
2.3.4 Modification of the pressure transducer
The pressure transducer was firstly installed on the top of the apparatus as shown in the Fig. 2.3 (a). However, during the measurement of refrigerants, the pressure was difficult to get to stable state and large deviation was observed. The main reason was the effect from the dead space between the pressure transducer and the cells. Therefore, a modification was conducted as shown in the Fig 2.3 (b). The pressure transducer was immersed in the thermostat bath close to the sample cell at the same horizontal position.
After this modification, the effect of the dead space was eliminated.
Chapter 2 Burnett Method
Figure 2.3 (a) The initial position of pressure transducer (b) modification of the pressure transducer.
2.4 Experimental procedure
2.4.1 Steps of measurement
The first step of this experiment is to turn on the vacuum pump to evacuate both the sample cell and expansion cell before supplying the objective substance.
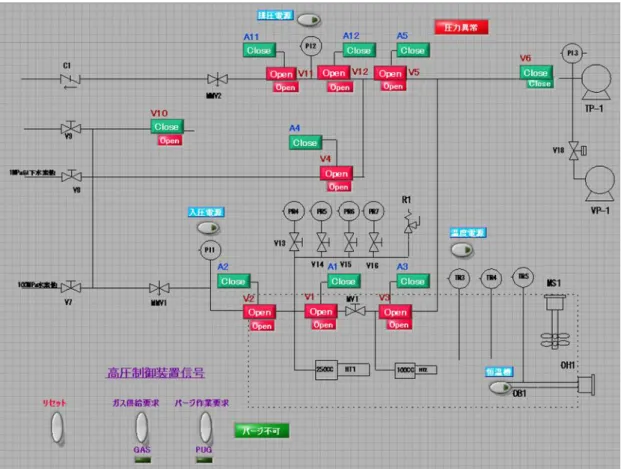
Fig. 2.4 shows the operation panel to control the system. Opening the valve V2 and closing V1 by clicking the icon, the sample will flow into the sample cell. After waiting for several minutes until the pressure is stable, all the opened valves should be closed, release the sample that remains in the pipe and evacuate it. Then the temperature of the oil bath will be increased to the target temperature. Waiting for several minutes until the pressure is stable, the times of expanding should be estimated based on the initial pressure at the each temperature.
Opening V1, the sample expands into the expansion cell, and then V1 closes waiting for the pressure become stable. Afterwards, evacuating the expansion cell to prepare for the next expansion. All the data of the pressure and temperature is recorded automatically
(a) (b)
Cells
Sample cell
Pressure transducer
Expansion cell
Pressure transducer
Chapter 2 Burnett Method
estimated times.
Figure 2.4 The operation panel of the control system
2.4.2 Supplying method for R1234ze(Z)
The sample of R1234ze(Z) is stored in a cylinder at room temperature (297 K) and at saturated vapor pressure up to 0.17 MPa in vapor-liquid phases. In this experiment, there is no pressure pump installed. Therefore when the sample is filled into the sample cell at room temperature, the maximum pressure that we can achieve inside the cell is limited by 0.17 MPa. After the temperature was increased, the pressure inside the cell decrease to an extremely low value. Limited by the accuracy of the absolute pressure
Chapter 2 Burnett Method
transducer, the data obtained at the extremely low region is not accurate enough that uncertainty of the experiment shall become too much.
Therefore, a new procedure is developed. The schematic diagram of this supplying method is shown in the Fig. 2.5.
Figure 2.5 The schematic diagram of supplying method
The gas cylinder of the R1234ze(Z) is placed in a tray. The pressure sensor PI-8 is used to monitor the pressure in the pipe. V-A, V-1 and V-8 are closed, V-7 and V-2 are open at the initial state. The procedure is described as follows.
(1) The valve V-A is opened to fill the sample into the sample cell (HT-1, 250cc) at room temperature (297 K) and at pressure up to saturated vapor pressure (0.17 MPa).
PI-8
Gas cylinder
40 ℃ water
Ice
V-A V-7
V-2 V-1
Oil bath
PI-10 High accurate pressure transducer
HT-1 250 cc
250 cc Sample cell Pressure sensor
V-8
Chapter 2 Burnett Method
(2) V-2 closed and 313 K water is filled into the tray to increase the temperature of sample inside the cylinder. The pressure rises to 0.3 MPa which is the saturated vapor pressure at 313 K.
(3) Some plastic bags full with ice are placed upon the external surface of the sample cell to decrease the temperature inside.
(4) Closing V-A and opening V-2, the sample in the pipe flows into the sample cell and wait for several minutes until the pressure is stable.
(5) Closing V-2 and opening V-A the sample of high pressure inside the cylinder flows into the pipe.
(6) Repeat step 4 and 5 several times until the objective pressure is achieved.
(7) V-A and V-2 are closed, V-8 opens to release the gas remains in the pipe and then replace the gas cylinder.
2.5 Uncertainties of experimental data
The uncertainty of temperature measurement is evaluated to be within 6 mK and for the pressure measurement the uncertainty is estimated to be within 0.3 kPa. In this study, the coverage factor k is chosen to be k = 2 [60]. Therefore the uncertainty of density was expressed as [61]:
2 / 2 1 2
2 ( )
) ) (
( ) (
N N i u u m
u
m m i
i
(2.15)
Where is the density and subscripts i and m denote the times of expansion, respectively.
u(N) presents the uncertainty in the cell constant [58]. In this study, the uncertainties are lowest at final expansion and highest at initial state and estimated to be 0.05 % and 0.12 %.
Chapter 3 Vapor-Liquid Equilibrium Measurement
In this chapter, the details of the apparatus and experimental procedure are introduced. The correlation for composition measurement has been determined. The uncertainties are discussed.
3.1 Experimental apparatus
3.1.1 Outline of the experimental facilities
A schematic diagram of the apparatus is shown in Fig. 3.1. The apparatus has been developed from previous work [62, 63] and consists of a thermostated bath, an equilibrium cell, two cells for vapor and liquid side, and some measuring devices. The inner dimensions of the bath are length 640 mm × width 400 mm × height 470 mm and 5 mm for the wall thickness except the top wall. The equilibrium cell is immersed in the thermostated bath and its temperature was controlled by means of an electric subheater and a cooling pump. Two stirrers are utilized to flow the medium inside the thermostat bath and ensure the uniform distribution of temperature. Silicon oil (Shinetsu, KF-96- 20CS) of low viscosity due to low experimental temperature region was used as the heat transfer medium. The sample filled in the equilibrium cell in the vapor-liquid equilibrium state and isothermally extracted to the vapor-side and liquid-side cells through the hexagon valves, respectively. The sample temperature was detected by a standard platinum resistance thermometer (Netsushin, NSR-LT40) placed on the equilibrium cell wall with a precise thermometer bridge (ASL, F650). The sample pressure was measured by a quartz pressure transducer (Paroscientific, 42K-101) located inside the thermostated bath.
Chapter 3 Vapor-Liquid Equilibrium Measurement
Chapter 3 Vapor-Liquid Equilibrium Measurement
Figure 3.1 Schematic diagram of the VLE property measurement apparatus: A, Liquid bath; B, R, personal computer; C, thermometer Bridge; D, pressure computer; E, gas chromatograph; F, G, electric heaters; H, cooling pump; I, stirrer; J, standard platinum resistance thermometer; K, hexagon valve;
L, pressure transducer; M, equilibrium cell; N, sample vessel; O, vacuum pump; P, power supply; Q, PID controller.
3.1.2 Structure inside the thermostat bath
As shown in the Fig 3.2 (a), the equilibrium cell with an inner volume of 163 cm3 was directly connected to two hexagon valves, circulation pumps, pressure transducer and a vapor-side expansion vessel. The sample was supplied into the cell from top in liquid- vapor equilibrium phase condition. At the front and back of the cell, two glasses installed through which one can observe the phase change as shown in the Fig. 3.2 (b). All of these devices are immersed into the thermostat bath to eliminate the influence of condensation.
Chapter 3 Vapor-Liquid Equilibrium Measurement
Figure 3.2 The pictures of the equilibrium cell; (a), main system of the VEL apparatus;
(b), the equilibrium cell with sample inside.
3.1.3 Temperature control system
The target experimental temperature region is from 253 K to 323 K. Consequently, a liquid-cooling system was applied. As shown in the Fig. 3.1, the cooling pump (Julabo, F32-HE) is connected to the thermostat bath and value of the cooling pump was set 10 K lower than the target temperature as a basement temperature. A main heater and a subheater are installed to increase the temperature. The PID controller (CHINO, SU) is applied to control the temperature of the thermostat bath.
(a)
(b)
Chapter 3 Vapor-Liquid Equilibrium Measurement
3.1.4 Temperature measurement
A standard platinum resistant thermometer (NSR-LT40) is installed at the outer surface of the equilibrium cell and connected with a precision AC bridge. The specifications of the SPRT and bridge are shown in the Table 3.1 and 3.2.
Table 3.1 Specification of the SPRT
Model NSR-LT40
Resistance at 273 K 100 Ω
Specified Current 1 mA
Resistance Ratio R(Ga)/R(0.01) ≥ 1.11807
Temperature Region 233 k~ 433 K
Basic Accuracy ± 0.003 K
Sensitivity 0.4 Ω/K
Insulation Resistance DC 100V/100 MΩ
Texture of the Protective Tube SUS316
Diameter of the Protective Tube Ф 4.8 mm & Ф 6.0 mm Length of the Protective Tube 600 mm
Chapter 3 Vapor-Liquid Equilibrium Measurement
Table 3.2 Specification of F650
Accuracy ± 0.25 mK
Resolution 0.25 mK
Linearity ± 0.25 mK
Warm up time < 30 seconds
The details of calibration method for the temperature measurement was described in chapter 2 for the SPRT.
3.1.5 Extraction system
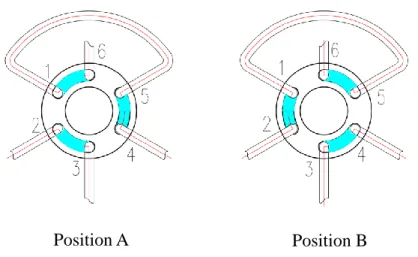
Two cells are prepared, one is for the vapor side with an inner volume of 25 cm3 and another is for the liquid side with an inner volume of 50 cm3.There are two hexagon valves installed among the paths for both vapor and liquid sides. The working principle is shown in the Fig. 3.3, the flowing direction will be changed by turn handle. For the vapor side, among path 1 and 5 there is an expansion cell and for the liquid side, between path 1 and 5 there is a coil pipe. The paths 2 and 3 are directly connected with the sample cell at liquid and vapor side, respectively. The path 4 connects to the gas chromatograph. The position A is the initial state when no expansion conducted, and when the position turns to B, the sample will be extracted to the coil pipe in liquid phase and vapor-side cell in vapor phase simultaneously. Then turn the vales back to position A, the sample in the coil pipe expanded to liquid-side cell and become single gaseous phase. At this time, sample can be supplied to the gas chromatograph and the compositions in the liquid and vapor side can be determined.
Chapter 3 Vapor-Liquid Equilibrium Measurement
Position B
Figure 3.3 The schematic diagram for the working principle of hexagon valves.
3.1.6 Gas chromatograph
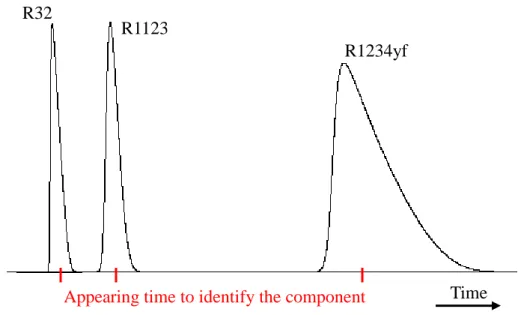
The composition of substances are measured by a gas chromatograph (GC-2014) manufactured by Shimadzu co. Ltd. The inlet connected to the VLE apparatus is covered by an air-controlled valve. It is operated automatically by applying nitrogen. The sample of gaseous compounds is adhered to the inside of a solid matrix inside a large metal tube (a packed column) and analyzed. In this study, the detection of thermal conductivity is utilized with the carrier gas of helium. The results obtained from gas chromatograph are in the peaks diagram and the appearing time and area of each peak can also be recorded as shown in the Fig 3.4. However the area ratio of each peak can’t represent the concentration directly. To calculate the composition, the correlation between the area ratio and concentration should be determined by measuring standard mixtures with known concentration. In this study, the standard binary mixtures are made by measuring the weight before and after supplying the components into a sample cell. An electronic balance precisely weighed to 0.1 mg was used. The correlations of the target mixtures are
Position A
Chapter 3 Vapor-Liquid Equilibrium Measurement
determined and the details are described below.
Figure 3.4 The schematic diagram of the results from gas chromatograph
3.2 Correlation between the area ratio and concentration
3.2.1 R32 + R1123
The mass concentration of R1123 the binary mixtures in gaseous phase were weighed to be 39.52 % and 59.96 %, respectively. Standard samples were supplied to the gas chromatograph and the results are summarized in the Table 3.3. By applying the molar mass of R32 and R1123, the mole fraction can be calculated and presented in the Table 3.3. As shown in the Fig. 3.5, the conversion functions have been determined by analysis of polynomial fitting. The functions are expressed as:
𝑦𝑚𝑎𝑠𝑠 = −0.0024𝑥2+ 1.2375𝑥 + 0.0268 (3.1) Where y denotes the concentration, x is the area ratio of R1123 obtained from gas chromatograph.
R32
R1123
R1234yf
Time Appearing time to identify the component
Chapter 3 Vapor-Liquid Equilibrium Measurement
Table 3.3 Results from gas chromatograph for binary mixture R32 + R1123
Area ratio of R1123 Mass fraction of R1123
34.455 39.952
54.152 59.96
Figure 3.5 The correlation curve of area ratio and concentration for R32 + R1123
3.2.2 R32 + R1234yf
Procedures are the same as R32 + R1123. The mass fraction of R1234yf of standard mixtures are 50 % and 80 %. Results are shown in Table 3.4 and Fig. 3.6. The functions are expressed as:
0 25 50 75 100
0 25 50 75 100
Concentration of R1123
Area Ratio of R1123
Chapter 3 Vapor-Liquid Equilibrium Measurement
𝑦𝑚𝑎𝑠𝑠 = −0.0034𝑥2+ 1.3398𝑥 + 0.0694 (3.2) Where x denotes the area ratio of R1234yf in this mixture.
Table 3.4 Results from gas chromatograph for binary mixture R32 + R1234yf
Area ratio of R1234yf Mass fraction of R1234yf
41.542 50.100
73.879 80.052
Figure 3.6 The correlation curve of area ratio and concentration for R32 + R1234yf
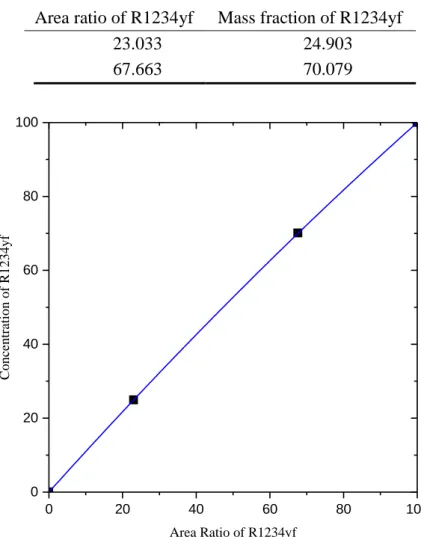
3.2.3 R1123 + R1234yf
The mass fractions of R1234yf are 70.079 % and 24.903%. Results are shown in Table 3.5 and Fig. 3.7. The functions are expressed as:
0 20 40 60 80 100
0 20 40 60 80 100
Concentration of R1234yf
Area Ratio of R1234yf
Chapter 3 Vapor-Liquid Equilibrium Measurement
The functions are expressed as:
𝑦𝑚𝑎𝑠𝑠 = −0.0011𝑥2+ 1.1092𝑥 − 0.0218 (3.3) Table 3.5 Results from gas chromatograph for binary mixture R1123 + R1234yf
Area ratio of R1234yf Mass fraction of R1234yf
23.033 24.903
67.663 70.079
Figure 3.7 The correlation curve of area ratio and concentration for R1123 + R1234yf.
3.4 Uncertainties
The uncertainties of the measurements are analyzed. In this study the coverage factor k is chosen to be k = 2. The uncertainties of the temperature and pressure measurement are estimated to be 9 mK and 1.38 kPa, respectively. And the relative uncertainty of the calibration curve is about 0.1 % in mass fraction and 0.12 % in the repeatability. The relative uncertainty of the composition measurement is estimated to be 0.15 %.
0 20 40 60 80 100
0 20 40 60 80 100
Concentration of R1234yf
Area Ratio of R1234yf
Chapter 4 Experimental Results on PVT Properties
In this chapter, the experimental PVT data of helium (He), nitrogen (N2) and 1,1,1,2- tetrafluoroethane (R134a) are described and compared with the existing EOSs to verify the reliability of the new modified apparatus. Twenty-nine PVT properties data of target refrigerant cis-1,3,3,3-tetrafluoropropene (R1234ze(Z)) are obtained and compared with other experimental data and EOS. The information of the sample used in this measurement is given in the Table 4.1.
Table 4.1 Sample Information
Sample Purity Manufacture
Helium 99.995% Japan Helium Center Co., Ltd.
Nitrogen 99.995% Fukuoka Oxygen Co., Ltd.
R134a 99.98% Daikin Industries, Ltd.
R1234ze(Z) 99.96% Central Glass Co., Ltd.