Stature: Key Determinants of Positive Height Trends―
The Cases of Japan and South Korea
Hiroshi Mori
AbstractHuman stature is determined largely by genetics. It is, however, hampered by various adverse effects during the early years of life, such as malnutrition and diseases. In comparing the growth patterns of children in the neighboring two countries, Japan and South Korea, this paper suggests that intakes of vegetables and fruit, particularly oranges, not necessarily meat and milk, during the adolescence period should be beneficial to stature growth of children. The insight was furnished by the findings of the longitudinal cohort studies of residents of Mikkabi-machi by the Fruit Tree Science Institute in conjunction with Hamamatsu School of Medicine that intakes of fruit, particularly mandarins, proved effective in lowering risks of bone loss and osteoporosis in post-menopausal female subjects. Keywords: stature, growth patterns, food consumption, fruit & vegetables, Japan
vs. S. Korea
"It (stature) is a net measure that captures not only the supply of inputs to health but
demands on those inputs." (Steckel, 1995, p. 1903)
Introduction
By casual observation, children tend to grow tall, when mothers and/or fathers are tall in stature. This contention may apply to individuals within the same race, say the north-eastern Asians and between different races, say the Europeans and Asians. This aspect of the key determinants of human height, genetics, is not the subject of this review article. Majoring in agricultural economics, the author will focus on "the supply of inputs to health," food consumption as a main theme.
People in northern Europe are tall in body stature. The Dutch particularly are often considered to be among the world's tallest. Young male adults in the Netherlands averaged 184 cm in height in the mid-1990s (Schonbeck et al., 2013; J. Amos, 2016; eLife, 2016; etc.). But a look back into the 19th century provides a much different perspective. The mean height of conscripts in the Netherland in 1850 was 164 cm, 3 cm shorter than their French peers (Steckel, p.1919),and even 7 cm shorter than current Japanese young men in their 20s (National Nutrition Surveys).
to a combination of genetics and environmental factors" (Silventoinen, 2003, p.263; Blum, 2013; Baten and Blum, 2014; etc.) which include hygienic and medical circumstances, food intakes, housing conditions, life styles, education, physical training, labor conditions, possibly climate, etc. Before reaching certain stages of economic and social development, these environmental conditions can be represented by the rates of infant mortality in the relevant societies as proximate indicators (Rona, 2000; Reidpath and Allotey, 2003; Hatton and Bray, 2010; Hatton, 2013; etc.).
Having drafted a couple of notes on secular trends in body stature of Japanese youths after WW II, particularly in comparison with South Korea (Mori, June 2016; Mori, July, 2016; Mori, November 2016), the author has reviewed a number of relevant articles on the growth of body size. Many, if not the majority of which emphasize the importance of early life, the first one or two years after birth, post-neonatal period (Schmit et al., 1995; Deaton, 2007; etc.), for example. There is a saying in Japan, “chiisaku unde, okiku sodateru” (small at birth but raise it grow big). The author, however, is not denying the importance of a healthy pregnancy, well-nourished breast-feeding and well- balanced supplements to infants, etc. But he also believes naively in the importance of intakes of nutrients desirable for every stage of growth of children in life. Qi and Niu (2015) state based on the 2008 national survey in China that the respondents who had less access to nutrients-rich diets during late childhood, at age 14 tend to be shorter when they grow up (p.664).
Personally, the author has two male children, both of whom are 175-6 cm in height, 5cm taller than their contemporaries and approximately 10 cm taller than father and nearly 20 cm taller than mother. When their mother was pregnant, she was advised rigorously by her doctors to refrain from eating much. The babies were both not big at birth. Whether this was a consequence of her doctor’s dietary restrictions is not certain. The younger one in particular was very ill, when he was 19-20 months old. As the author recalls, his entire family may have eaten substantially more meat and fruit than the contemporary Japanese middle-class families in the late 1960s and the 1970s, since they lived for some time in the United States and the children often spent months with their parent’s friends in the United States, when they were in primary schools and high- schools. They were not homeschooled nor participated in jyukus (private after-schools).They were engaged in sports and other activities so they were far from “the sedentary lifestyles” (Murata, 2000).
Is the Secular Increase in Adult Height Mainly Determined by an Increase in Growth during the First Years of Life?
Table 1 Secular Changes in Mean Height of Japanese Boys by Age, 1950 to 2010 (cm) age/year 1950 1955 1960 1965 1970 1975 1980 1985 1990 1995 2000 2005 2010 4-6 ave 102.6 104.1 105.0 107.4 108.1 108.6 109.1 109.4 110.2 109.9 109.9 110.1 109.8 9-11 ave 126.9 129.0 131.0 133.4 134.9 136.1 136.9 137.2 138.0 138.6 138.4 138.6 138.6 14-16 ave 152.1 155.6 157.8 161.6 163.0 164.2 165.7 166.1 166.6 167.5 167.6 167.4 167.7 19-21 ave 161.4 162.0 162.8 165.4 166.5 167.4 169.6 170.6 170.8 171.3 171.7 171.5 170.6 24-25 ave 161.8 162.2 163.0 164.5 165.5 166.5 168.3 169.9 170.7 171.6 170.8 170.9 170.5 Notes: All years represent three year averages, such as 1950=(1949-1951)/3; except 1975=(1975+ 1976)/2.
Sources: National Nutrition Survey, various issues.
Table 2 Secular Changes in Mean Height of Japanese Girls by Age, 1950 to 2010 (cm) age/year 1950 1955 1960 1965 1970 1975 1980 1985 1990 1995 2000 2005 2010 3-4 ave 92.7 94.0 95.1 97.4 98.3 98.8 98.8 99.2 99.3 99.2 99.1 99.9 98.9 8-9 ave 119.7 121.4 123.3 125.3 127.0 127.7 128.5 129.3 129.7 130.5 130.2 130.3 130.6 13-14 ave 143.9 146.5 148.7 151.2 152.2 153.6 154.3 154.8 155.4 155.3 155.1 156.1 155.2 18-19 ave 150.8 151.6 152.5 154.0 154.2 155.4 156.5 157.2 158.1 158.2 158.0 158.3 157.8 23-24 ave 150.5 150.7 151.7 153.0 153.7 153.9 155.6 156.8 157.6 157.9 157.9 158.4 157.6 Notes: the same as Table 1.
Sources: the same as Table 1.
biological and social sciences (Ruel.,1995; Silventoinen,2003; Deaton, 2007; Hoddinott et al., 2013; etc.).Cole (2003), depending on the case of secular increase in height of Japanese children by age over the period of 40 years from 1950 to 1990, states that the secular trend in adult height occurs during the first 2 years of life and it is restricted to this period (p. 164).
The young Japanese adults of both sexes increased remarkably in height over the period from 1950 to 1990, nearly 10 cm for males and 7 cm for females and stopped growing any taller since the mid-1990s. Many researchers in anthropology, clinical nutrition, pediatrics, etc., seem to presume that the current Japanese may have reached their genetic potentials (Kouchi, 1996; Murata and Hibi, 1992; Murata, 2000; A. Ali et al., 2000; T. Mizu et al., 2015; etc.). Tables 1 and 2 provide the secular changes in mean height of Japanese children classified by 5 year bracket, with boys from 4-6 to 9-11, 14-16, 19-21 and 24-26 and girls from 3-4 to 8-9, 13-14, 18-19 and 23-24 years old, respectively over the period from 1950 to 2010 by every 5 year. These cohort tables are decomposed into age, period and cohort effects in mean height by means of the Nakamura’s Bayesian cohort model (Nakamura, 1986; Clason; Mori et al., 2009; Mori, 2014; etc.), which are provided in Tables 3 and 4. Quick visual inspections of Tables 1 and 2, fortified by the results of our cohort analyses, the period effects and cohort effects, in particular, clearly suggest that the Japanese youths, both males and females, may have ceased to grow any taller in the mid-1990s (The basic cohort model is provided in equation (1) below.).
Hit : mean height of i years old at period t B : grand mean effect
Ai : age effect to be attributed to age i Pt : period effect to be attributed to period t Ck : cohort effect to be attributed to birth cohort k eit : random error
Table 3 Boys’ Height Decomposed into Age/Period/Cohort Effects
Grand Mean Effect= 148.2(0.13) (cm)
Age Effects Period Effects Cohort Effects
Age (y. old) Annual Years Born in
4-6 -41.2(.52) 9-11 -13.6(.32) 14-16 15.0(.22) 19-21 19.9(.32) 24-26 19.8(2.9) 1949-51 -4.0(1.5) 1954-56 -2.8(1.3) 1959-61 -1.9(1.0) 1964-66 -0.5(0.8) 1969-71 -0.3(0.6) 1974-76 -0.1(0.5) 1979-81 0.7(0.4) 1984-86 1.0(0.5) 1989-91 1.4(0.6) 1994-96 1.8(0.8) 1999-01 1.6(1.0) 2004-06 1.6(1.3) 2009-11 1.4(1.5) 1923-27 -2.5(2.0) 1928-32 -3.0(1.7) 1933-37 -4.2(1.5) 1938-42 -3.6(1.3) 1943-47 -2.2(1.0) 1948-52 -1.1(0.8) 1953-57 -0.3(0.6) 1958-62 0.8(0.5) 1963-67 1.5(0.4) 1968-72 1.6(0.5) 1973-77 1.6(0.6) 1978-82 1.8(0.8) 1983-87 1.9(1.0) 1988-92 1.8(1.3) 1993-97 2.2(1.5) 1998-02 2.0(1.7) 2003-07 1.6(2.0) Note: Values in parentheses denote standard errors.
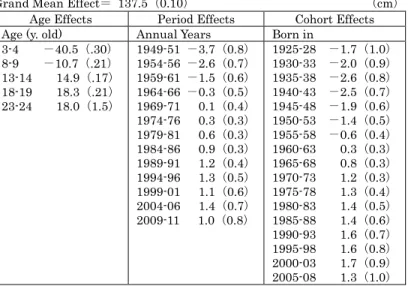
Source: Decomposed by the author, using the Nakamura’s model. Table 4 Girls’ Height Decomposed into Age/Period/Cohort Effects
Grand Mean Effect= 137.5(0.10) (cm)
Age Effects Period Effects Cohort Effects
Age (y. old) Annual Years Born in
3-4 -40.5(.30) 8-9 -10.7(.21) 13-14 14.9(.17) 18-19 18.3(.21) 23-24 18.0(1.5) 1949-51 -3.7(0.8) 1954-56 -2.6(0.7) 1959-61 -1.5(0.6) 1964-66 -0.3(0.5) 1969-71 0.1(0.4) 1974-76 0.3(0.3) 1979-81 0.6(0.3) 1984-86 0.9(0.3) 1989-91 1.2(0.4) 1994-96 1.3(0.5) 1999-01 1.1(0.6) 2004-06 1.4(0.7) 2009-11 1.0(0.8) 1925-28 -1.7(1.0) 1930-33 -2.0(0.9) 1935-38 -2.6(0.8) 1940-43 -2.5(0.7) 1945-48 -1.9(0.6) 1950-53 -1.4(0.5) 1955-58 -0.6(0.4) 1960-63 0.3(0.3) 1965-68 0.8(0.3) 1970-73 1.2(0.3) 1975-78 1.3(0.4) 1980-83 1.4(0.5) 1985-88 1.4(0.6) 1990-93 1.6(0.7) 1995-98 1.6(0.8) 2000-03 1.7(0.9) 2005-08 1.3(1.0) Note: the same as Table 3.
About a year ago, the author came across a newspaper article that senior high-school male students in South Korea have stopped growing taller in the mid-2000s at mean height of 173.7 cm, 3 cm higher than their Japanese peers (Chosun Ilbo, February 25, 2016). The statistical data, collected by the courtesy of Professor S-W Park (2016), revealed the fact that the Korean youths leveled off in mean height with their Japanese peers in the mid-1980s and became 2.0 cm taller in the mid-1990s and 3.0 cm taller in the mid-2000s than their Japanese peers.
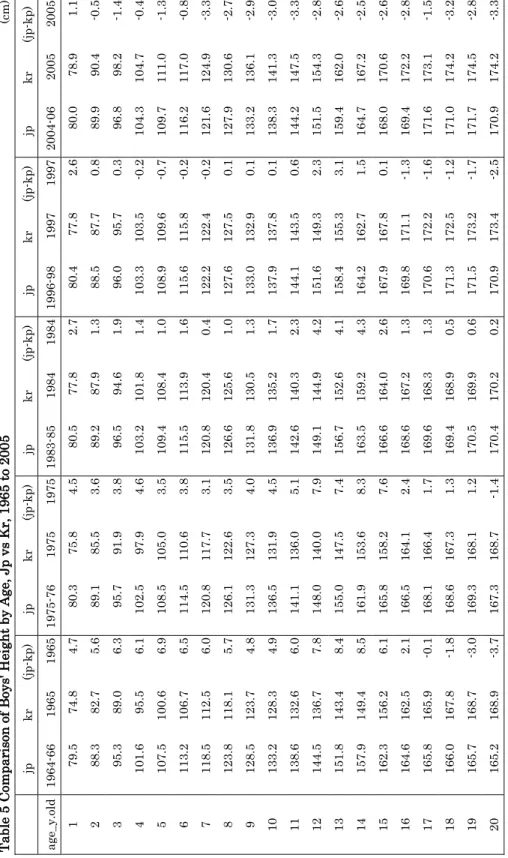
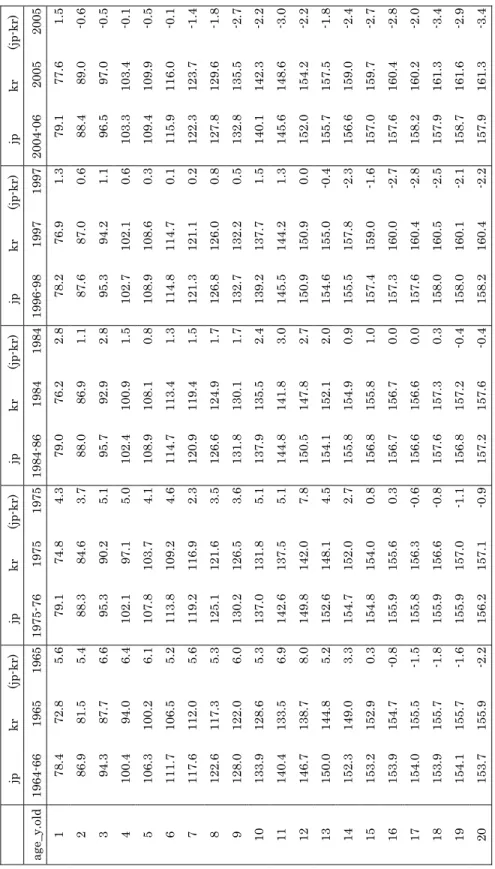
Tables 5 and 6 compare the Japanese children, by both sexes, by age from 1 to 20 years old with their Korean peers in mean height over the period from 1965*1 to 2005. The Japanese boys at 2-3 years of age were nearly 4.0 cm, approximately 4% taller than their Korean peers in the mid-1970s and those at age of 13-14 were 4.0 cm taller than the latter in the mid-1980s. But the Japanese boys at age 20 were 2.5 cm shorter than their Korean peers in the mid-1990s. The Japanese boys at 3 years of age were 1.9 cm taller than their Korean peers in the mid-1980s but the first at 20 years of age in the mid-2000 were 3.3 cm shorter than the latter. Almost the same phenomena are observed with the girls from 1 to 20 years of age in the two countries over the corresponding period.
What draws the author’s attention is the statistical fact that the Korean boys tend to grow remarkably faster than the Japanese boys past the age of 14-15 and similarly the Korean girls grow much faster than their Japanese peers past the age of 13-14. Can this be explained by the supposed differences in “net nutrition in the first years of life” (Deaton, p. 13232) between the two countries over the period in question? Given the fact that South Korea was far behind Japan in terms of per capita GNI and per capita food supply, meat and milk, in particular, in the 1970s and 1980s*2, this presumption cannot be taken as a plausible explanation for the taller Korean youths than their Japanese peers in the 1990s through 2000s.
Food Consumption as Key Determinants of Human Statue
Normally, men reach their peak in height around the age of 20 and women around the age of 18 in the modern societies. Changes in socio-economic and hygienic conditions may not affect human physical height any further after one has passed these maturity ages. Children in the same country or even within the limited areas of the country should vary distinctly in the growth pattern of height, e.g., some children grow fast when they are in junior high-schools, while others grow distinctly fast after they finish senior high-schools,
*1 The years 1965, 1975, 1984, 1997, and 2005 are only available for the body size data for children by
age in South Korea. J-Y Kim et al., 2008; J-S. Moon, 2011.
*2 S. Korea achieved a rapid and steady economic progress since the beginning of the 1970s, where per
although either type should stop growing normally after they have reached the age of maturity, boys at 20 years of age and girls at 17-18. When children grow bigger in stature, they tend to eat more and less likely, though, they tend to grow bigger in statue, when they eat more. It is practically plausible that they should only be heavier, as they eat more. This premise applies to individual children but to a mass of growing children, as well.
What factors are behind the statistical facts observed in the preceding section that the Japanese children in their early life were distinctly taller in height than their Korean peers during the 1970s through 1980s but they were distinctly shorter than their Korean peers 10 to 20 years later after they passed their adolescent period lately in the 1990s and 2000s. One straightforward answer should be the alleged differences in genetics that the Japanese had long been shorter than the Koreans “ethnically (S. Pak, 2016). The author came across a journal article which confirms this contention. Choi and Schwekendiek(2009) show the data that average height of Korean Seodaemun Prison male inmates, 20-40 years of age in the early1930s during the period of Japanese colonization were recorded at 164-65 cm, 4-5 cm taller than the Japanese male adults in their 20s to 40s then. The National Nutrition
Surveys by the Japanese government, 1949-1951, show that males in their 30s in 1950
averaged 160.4 cm and those in their 40s and 50s 159.2 and 157.7 cm in height, respectively, indicating that Japanese young men in the 1920s through 1930s should have been slightly lower than160 cm in mean height*3.
The average height differences of these magnitudes should not be overlooked to presume too easily that Koreans and Japanese ethnically belong to the same race. There exist, however, a number of academic observations to show that people in the north-eastern regions of Honshu, Japan are a few cm taller than those in the south-western regions (Akiyama et al., 2006; Yokoya, 2010; Hamazaki, 2016; etc.). The regional differences in height may apply to Korea (M. Kimura, 1993, Table 6, p.645). It is often remarked with good evidence that people in the southern parts of China are remarkably shorter than those in the northern regions such as Manchuria. As stated in the Introduction, young Dutch men were shorter than their French peers one and half centuries ago but they are now more than 7-8 cm taller on average than the latter. As a personal inclination, the author would like to refrain from attributing all the differences in body size easily to the ethnic origins, whether the Westerners or the Asians, or between the regions in question. Moradi and Hirvonen (2016), in exploring "the African Enigma: the mystery of tall African adults", state that environmental factors are more likely candidates to explain the catch-up growth, rather than genetics (p.17). Over the long spurn of time, say 50 years or a century, the average body height of a chosen ethnical origin can be affected appreciably by changes in
*3 According to different data sources, statistically more comprehensive than ad hoc observations of
the standard of living, including food intakes, particularly for this review note.
There seem to exist almost unanimous agreements in bio-medical and social sciences that under the given genetic and early life health conditions, human adult stature is largely determined by nutritional intakes, in terms of total calories and animal proteins, in particular, across the countries over the long-spun of time, say 50 years or a century or two (Fogel,1994; Silventonien, 2003; Cole, 2003; etc.). Above all, milk and dairy products and meat are considered as major determinants of growth in stature (Hoppe et al., 2006; Baten, 2009; Berkey et al., 2009; Beer, 2012; Grasgruber et al., 2014 and 2016; etc.). Needless to mention, people cease growing in height at the ages of maturity, as mentioned above. Anything in any amount taken after one passes this maturity does not contribute to any further increases in height. It is therefore desirable to take the nutrient-intakes by age groups, say under 5, 6-10, 11-15 and 16-20 during the children's growing period, in place of simple per capita supply of any food products based on food balance sheets, to explain the secular changes in body height by countries or regions. When one compares countries which differ much in the age structure of populations with apparent cohort effects present (Mori, Inaba, and Dyck., 2016), this consideration is important, if not crucial for the correlation analyses of adult height by countries or regions.
Tables 7, 8 and 9 provide per capita at-home consumption of fresh meat, fresh fish and fluid milk by age groups in Japan from 1980 to 2010, derived by the author from the annual consumption data classified by the age groups of household head, Family Income and
Expenditure Surveys, using the TMI model (Mori and Inaba, 1997; Tanaka, Mori, and
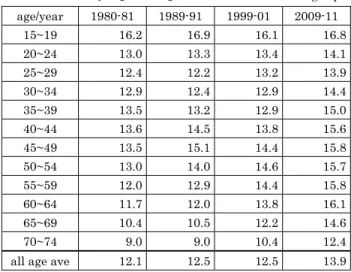
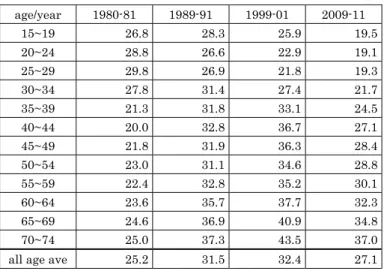
Inaba, 2004), built after “the behavioral equations” (Prais,1953). As regards fresh meat consumption, children in their high-teen age years consume substantially more than those in their middle and old age but their per capita consumption kept unchanged over the 30 year period from 1980 through 2010, whereas per capita consumption of household members in the middle and old age groups increased remarkably over the same period. In regard to fresh fish consumption, total average per capita consumption deceased steadily from 14.3 kg to 11.0 kg and the children in their high-teen age group, in particular, drastically decreased their fresh fish consumption from 10.9 kg to 2.9 kg from 1980 to 2010. Total per capita fluid milk consumption at-home increased steadily from 25.2 l in 1980 to 31.5 l in 1990 and kept growing to 32.4 l in 2000, whereas the children in their high-teens decreased their at-home consumption from 28.3 l in 1990 to 25.9 l in 2000 and further down to 19.5 l in 2010.
Table 7 Changes in per capita At-home Consumption of Frsh Meat by Age Groups, 1980 to 2010 (kg/cap)
age/year 1980-81 1989-91 1999-01 2009-11 15~19 16.2 16.9 16.1 16.8 20~24 13.0 13.3 13.4 14.1 25~29 12.4 12.2 13.2 13.9 30~34 12.9 12.4 12.9 14.4 35~39 13.5 13.2 12.9 15.0 40~44 13.6 14.5 13.8 15.6 45~49 13.5 15.1 14.4 15.8 50~54 13.0 14.0 14.6 15.7 55~59 12.0 12.9 14.4 15.8 60~64 11.7 12.0 13.8 16.1 65~69 10.4 10.5 12.2 14.6 70~74 9.0 9.0 10.4 12.4
all age ave 12.1 12.5 12.5 13.9
Notes: 4 age groups, 0~4, 5~9, 10~14, and 75+ not shown. Sources: estimated by the author.
Table 8 Changes in per capita At-home Consumption of Fresh Fish by Age Groups, 1980-2010 (kg/cap)
age/year 1980-81 1989-91 1999-01 2009-11 15~19 10.9 7.9 5.0 2.9 20~24 11.4 7.9 5.9 3.7 25~29 12.2 7.9 6.6 4.8 30~34 14.1 10.2 7.9 6.1 35~39 15.4 12.3 9.8 7.4 40~44 15.6 14.6 12.5 8.7 45~49 16.7 17.1 15.2 10.2 50~54 18.6 18.5 18.3 12.1 55~59 19.8 19.1 20.2 14.6 60~64 19.9 19.3 20.3 17.2 65~69 18.5 18.8 19.9 18.2 70~74 17.1 17.8 18.7 17.2
all age ave 14.3 13.4 13.3 11.0
Table 9 Changes in per capita At-home Consumption of Fluid Milk by Age Groups, 1980-2010 (lt/cap)
age/year 1980-81 1989-91 1999-01 2009-11 15~19 26.8 28.3 25.9 19.5 20~24 28.8 26.6 22.9 19.1 25~29 29.8 26.9 21.8 19.3 30~34 27.8 31.4 27.4 21.7 35~39 21.3 31.8 33.1 24.5 40~44 20.0 32.8 36.7 27.1 45~49 21.8 31.9 36.3 28.4 50~54 23.0 31.1 34.6 28.8 55~59 22.4 32.8 35.2 30.1 60~64 23.6 35.7 37.7 32.3 65~69 24.6 36.9 40.9 34.8 70~74 25.0 37.3 43.5 37.0
all age ave 25.2 31.5 32.4 27.1
Notes: the same as Table 7. Sources: the same as Table 7.
to be 2 cm taller in height than their Korean peers from the model variables of actual per capita intakes of "high-quality proteins" in the two countries (ibid. Fig. 12, a). To repeat, it does not seem plausible to explain the above observed differences in young adult height between Japan and South Korea in recent years by the commonly alleged differences in consumption of animal proteins. As proximate indicators, simple per capita net supply (= consumption), based on food balance sheets, of meat, fish, and milk in the two countries from 1965 through 2000 is provided in Table 10. As mentioned earlier, footnote *2, South Korea was substantially behind Japan until the mid-1990s in terms of per capita consumption of animal protein foods, milk in particular. As compared with the Netherlands, however, per capita consumption of milk both in Japan and South Korea is substantially smaller in amount. Therefore, it does not seems convincing to attribute any differences in height growth between the two countries to changes in milk intakes.
Table 10 Changes in per capita Supply of Animal Protein Food Products in
Japan and South Korea, 1965 to 2000
(kg/capita)
meat fish milk referenence: Netherlands
jp kr jp kr jp kr meat fish milk
Fruit and Vegetable Consumption and Bone Mineral Density
NARO Institute of Fruit Tree Science, in conjunction of Hamamatsu University School of Medicine, has been conducting the longitudinal cohort studies of the residents of Mikkabi-cho, known for production of quality mandarin oranges, to ascertain intakes of fruit, particularly mandarins, to be associated with bone mineral density continuously for 10 years since 2003. The major and consistent findings include that high intakes of fruits, particularly mandarins, tend to reduce the risk of developing osteoporosis and related fractures among post-menopausal female subjects, by contributing to keeping high serum concentrations of β-cryptoxanthin and β-carotene in blood for better bone health. In a few words, high intakes of fruit and vegetables are clinically found in strong positive associations with bone mineral density, among menopausal female subjects in their cohort studies (Sugiura et al., 2008; Sugiura et al., 2012; Sugiura et al., 2015; etc.). There exist several clinical studies overseas which provide good evidence for positive associations between intakes of fruit and vegetable and bone mineral density for male and female adolescents (McGartland et al., 2004; whiting et al., 2004; Vatanparast et al., 2005; Prynne et al., 2006; J-J Li et al., 2012; etc.).
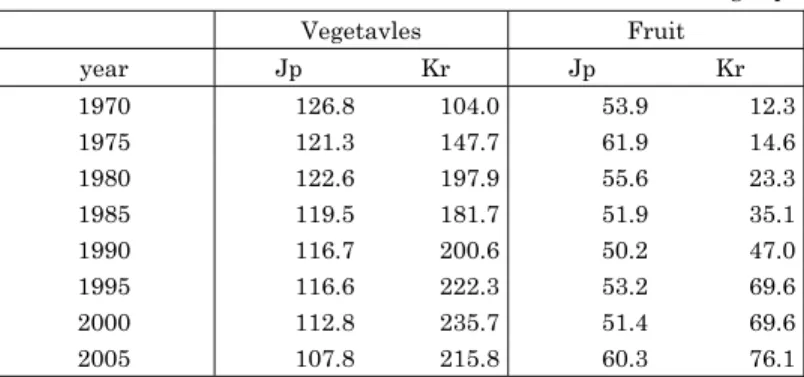
Traditionally, people in South Korea have been consuming lots of vegetables typically in the form of Kimchi, "largest contributor to vegetable consumption". It is estimated that consumption of Kimchi has risen steadily since 1969 increasing from 58 g to 117 g/person/day in 2009 (Lee, Duffey, and Popkin, 2012, p.619; Kim, E-K et al., 2016; etc.). As shown in Table 11, people in South Korea have been consuming substantially more vegetables than people in Japan since the early 1970s, whereas South Koreans' consumption of fruit was substantially less than Japanese in the 1970s but has risen remarkably since 1980 to the comparable level of Japanese in 1990 and exceeded the latter by 30% in the mid-1990s.
Table 11 Changes in per capita Net Supply of Vegetables and Fruit in Japan and South Korea, 1970 to 2005 (kg/cap)
Vegetavles Fruit year Jp Kr Jp Kr 1970 126.8 104.0 53.9 12.3 1975 121.3 147.7 61.9 14.6 1980 122.6 197.9 55.6 23.3 1985 119.5 181.7 51.9 35.1 1990 116.7 200.6 50.2 47.0 1995 116.6 222.3 53.2 69.6 2000 112.8 235.7 51.4 69.6 2005 107.8 215.8 60.3 76.1
At-home consumption of fruit in Japan reached its peak on per capita basis in the mid-1970s and has kept declining steadily by 25-30% toward the beginning of the 2000s, whereas that in S. Korea has more than tripled over the same period. Commodity-wise, mandarins (= tangerine) were by far the largest item in Japan, accounting for 45.8% of total fresh fruit consumed at-home in 1974 and 39.4% in 1980. The percentage rapidly dropped down to 18.6% of steadily declining total fruit consumption over the period in question. On the contrary, tangerine was in South Korea a minor item in 1980, accounting for 18.8% in 1980 and steadily up to 26.3% of drastically risen total fruit consumption in the early 2000s.
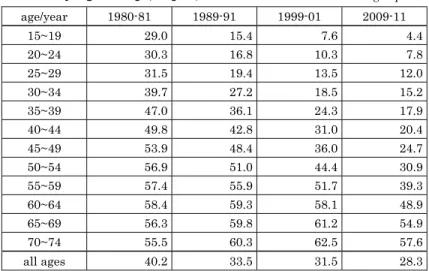
Tables 12 and 13 provide the author's estimates of at-home consumption of fresh fruit and mandarins by age groups of individual household members from 1980 to 2010. Some 20 years ago, White Paper on Agriculture-1994 officially expressed a concern on declining fruit consumption, particularly wakamono-no-kudamono-banare (moving away from fruit by the young). Table 12 demonstrates that those in their 20s decreased their fruit consumption from 30kg per person in the early 1980s to a little over 10kg in 2000 and less than 10kg in 2010 and those in the high-teens more drastically reduced it from 29kg to 4.4kg over the same period, while those elderly groups above 60 years of age kept their fruit consumption at fairly high level of 55kg throughout the period. As shown in Table13, the young under their 40s decreased their consumption of mandarins more dramatically from 20kg in 1980 to less than 2.0kg in 2010 and those in their high-teens seem to have quit eating mandarins in the past 20 years or so. As compared to Japan, fruit as a whole and particularly tangerine, grapes, and pears are new comers in the market in the South Korean society
Table 12 Changes in per capita At-home Consumption
of Fruit by Age Groups, Japan, 1980-2010 (kg/capita) age/year 1980-81 1989-91 1999-01 2009-11 15~19 29.0 15.4 7.6 4.4 20~24 30.3 16.8 10.3 7.8 25~29 31.5 19.4 13.5 12.0 30~34 39.7 27.2 18.5 15.2 35~39 47.0 36.1 24.3 17.9 40~44 49.8 42.8 31.0 20.4 45~49 53.9 48.4 36.0 24.7 50~54 56.9 51.0 44.4 30.9 55~59 57.4 55.9 51.7 39.3 60~64 58.4 59.3 58.1 48.9 65~69 56.3 59.8 61.2 54.9 70~74 55.5 60.3 62.5 57.6 all ages 40.2 33.5 31.5 28.3
Table 13 Changes in per capita At-home Consumption of Mandarins by Age Groups, Japan, 1980-2010 (kg/capita) age/year 1980 1985 1990 1995 2000 2005 2009-11 15~19 9.31 4.82 2.26 1.79 1.18 0.96 0.79 20~24 9.54 4.85 2.69 2.02 1.48 1.01 1.06 25~29 9.60 5.09 3.27 2.25 1.84 1.20 1.34 30~34 11.68 8.82 6.55 2.83 2.74 2.74 1.68 35~39 19.66 9.74 10.12 3.18 3.35 3.45 2.06 40~44 19.39 13.96 11.10 8.13 6.76 4.21 2.49 45~49 20.37 14.52 12.26 8.36 7.42 4.69 3.00 50~54 21.24 14.59 12.70 9.12 8.29 7.34 3.67 55~59 20.52 15.57 14.03 11.72 8.82 8.45 4.58 60~64 20.51 16.51 14.60 12.11 11.70 9.23 7.18 65~69 20.54 16.26 13.91 12.63 12.31 9.92 8.45 70~74 20.59 16.13 13.63 12.86 13.02 10.44 8.90 all ages 14.50 9.60 7.80 6.30 5.90 5.13 4.14
Sources: the same as Table 12. Notes: the same as Table 12.
Table 14 Changes in per capita Consumption of Fresh Fruit by Variety in South Korea,
1980-2001 (kg)
Year Fruit Apples Pears Peaches Grapes Kaki Tangerine Others
1980 22.3 10.8 1.5 2.3 1.5 0.2 4.2 1.8 1985 36.0 13.0 3.1 3.2 3.7 1.6 9.1 2.3 1990 41.8 14.5 3.6 2.7 3.1 1.5 11.5 4.9 1995 54.8 15.8 3.9 2.9 7.0 3.4 14.0 7.8 1999 56.1 10.5 5.5 3.4 10.2 4.6 13.9 8.9 2000 58.4 10.4 7.6 3.6 10.3 4.8 14.0 8.6 2001 59.2 8.4 8.6 3.5 9.7 4.1 15.5 9.4 Source:S-M Son, "Food Consumption Trends," 2003, Table 3.
Original sources:MAF (2002): The Basic Statistics.
(Table 14). The author, with some 20 year experience in cohort analyses of various food products (Mori et al., 2009; Mori and Saegusa, 2010; Mori and Stewart, 2011; Mori, 2014; etc.), suspects that the young, more precisely the newer generations in Korea are prone to eat more fruit, particularly tangerine, pears and grapes than the older generations, as opposed to the cases of fruit and mandarins in Japan observed in Tables 12-13 above. Brief Concluding Remarks
in the two countries, Japan and South Korea, intuitively presumed to be very close in genetic potentials, we have come to notice the crucial differences in food intakes in the past few decades, when the South Korean youths began to exceed their Japanese peers in stature. The young, more precisely the newer generations, in Japan started to eat less and less fruit, particularly mandarins, in and around 1980, whereas people in South Korea started eating fruit, particularly tangerine and grapes, about the same time and in the mid-1990s exceeded Japan by 35% in terms of per capita fruit consumption. As mentioned earlier, the author's gut feeling is that the younger generations in South Korea should be eating more tangerine, the new comer in the market as compared to apples, than the older generations, just opposed to the cases in Japan, shown in Table 13.
The author is not contending vigorously that the children would grow taller in height, if they eat more fruit, mandarins, in particular, or more directly, Japanese children would catch up with their Korean peers in height, if they begin to eat more mandarins. He is, however, seriously concerned that Japanese children have been consuming so little fruit, particularly mandarins in the past few decades, to face possible adverse effects on their health. In the words of Steckel, cited at the outset, "inputs to health" seem to have been somehow inadequate.
References
Akiyama, S. et al. (2006) “A Study on Correlates of Body Height of School Children: Why are School Children in Niigata Tall?” Niigata Medical J., 120(6), 329-336 (in Japanese). Alderman, H., J. Hoddinott, and B. Kinsey (2003) "Long-Term Consequences of Early
Childhood Malnutrition," Food Discussion Paper No. 168, International Food Policy Research Institute, Washington, D.C.
Ali, A. , T. Uetaka, and F. Ohtsuki (2000) "Secular Changes in Relative Leg Length in Post-War Japan," American Journal of Human Biology 12, 405-416.
Amos, Jonathan (2016) "Dutch men revealed as world's tallest," Science & Environment, BBC, 26 July.
Baten, Joerg (2009) "Protein supply and nutritional status in nineteenth century Bavaria, Prussia and France, Economics and Human Biology, 7, 165-80.
Baten, J. and M. Blum (2014) "Why are you tall while others are short? Agricultural production and other proximate determinants of global heights, " European Review of
Economic History, 18, 144-65.
Beer, Hans de (2012) "Dairy products and physical statue: A systematic review and meta-analysis of controlled trials," Economics and Human Biology, 10, 299-309. Berkey C.S. et al., (2009) "Dairy consumption and female height growth: prospective cohort
study," Cancer Epidemiol Biomarkers Prev, 18 (6), 1881-87.
Choi, Seong-Jin and D. Schwendiek (2009) "The Biological Standard of Living in Colonial Korea, 1910-1945,"Economics and Human Biology, 7, 259-264.
Chosun Ilbo. Chosun Online, Japanese edition.
Clason, Dennis D. Professor, Statistics Center, New Mexico State University, Las Cruces, NM (program building: the cohort models, 1998-2009).
Cole, T. J. (2003) " The secular trend in human physical growth: a biological view,"
Economics and Human Biology, 1, 161-168.
Deaton, Angus (2007) "Height, Health, and Development," PNAS, vol. 104, no. 33, 13232-13237.
eLIFE 2016. "A century of trends in adult human height," NCD Risk Factor Collaboration, July 26.
FAO of the United Nations. FAOSTAT, Food Balance Sheets, by country and year, on line. Fogel, Robert W. (1994) "Economic Growth, Population Theory, and Physiology: The
Bearing of Long-Term Process on the Making of Economic Policy, The American
Economic Review, Vol. 84, No. 3, 369-395.
Grasgruber, P., J. Cacek, T. Kalina, and M. Sebera (2014) “The Role of Nutrition and Genetics as Key Determinants of the Positive Height Trend,” Economics and Human
Biology, 15, 81-100.
Grasgruber, P., M. Sebera, E. Hrazdira, J. Cacek, and T. Kalina (2016) “Major correlates of male height: A study of 105 countries,” Economics and Human Biology, 21, 172-195. Hamazaki, Toshihide (2016) “Technical Supplements” to H. Mori, “Secular Changes in Body
Height of Children in Japan” Senshu University Economic Bulletin, 51(2), 86-88 (in Japanese).
Hankook Research (2014) Food Consumption Trend in Korea, GAIN Report, #: KS1426, Seoul.
Hatton, T. J. and B. E. Bray (2010) "Long run trends in the heights of European men, 19th-20th centuries," Economics and Human Biology 8, 405-413.
Hatton, Timothy J. (2013) "How have Europeans grown so tall?" Oxford Economic Papers (Advance Access published September 1), Oxford University Press, 1-24.
Hodinott, J, J. Behrman et al. (2013) "Adult consequences of growth failure in early childhood," Am.J. Clin. Nutr., 98, 1170-1178.
Hoppe, C., C. Molgaard, and K.F. Michaelsen (2006) “Cow’s milk and linear growth in industrialized and developing countries,” Annu Rev Nutr, 26, 131-73.
Japanese Government. Ministry of Health, Labor and Welfare. National Nutrition Survey
in Japan, various issues, Tokyo.
――― Ministry of Agriculture, Forestry and Fisheries (1995). White Paper on Agriculture-1994, Tokyo.
――― Ministry of General Affairs, Bureau of Statistics. Annual Report of Family Income
Kim, E-K, A-W Ha, E-O Choi, and S-Y Ju (2016) “Analysis of Kimchi, vegetables and fruit consumption trends among Korean adults: data from the Korean Health and Nutrition
Examination Survey (1998-2012), Nutrition Research and Practice, 10(2), 188-197.
Kim, Ji-Yeong, Choi, J-M, Jin-Soo Moon, S-H. Shin et al. (2008) “Anthropometric Changes in Children and Adolescents from 1965 to 2005 in Korea,” American Journalof Physical
Anthropology, 136, 230-236.
Kim, S-Y, Y-K Ban, and M. A. Myers (2014) Food Consumption Trends in Korea, GAIN Report #: KS 1426, Seoul.
Kimura, Mitsuhiko (1993) "Standard of Living in Colonial Korea: Did the Masses Become Worse Off or Better Off Under Japanese Rule?" The Journal of Economic History, Vol. 53, 629-652.
Kouchi, Makiko (1996) ""Secular Change in Socioeconomic Difference in Height in Japan,"
Anthropol. Sci., 104(4), 325-340.
Lee H-S, K.J. Duffey, and B.M. Popkin (2012) “South Korea’s entry to the global food economy: shifts in consumption of food between 1998 and 2009,”Asia Pac J Clin Nutr, 21(4), 618-629.
Li, J-J, Z-W Huang et al. (2012) “Fruit and vegetable intake and bone mass in Chinese adolescents, young and postmenopausal women,” Public Health Nutrition: 16(1), 78-86.
Matsuda, Hirotaka (2003) "A Study of Japanese Heights in the Meiji-Taisho-Pre-War Showa Period―Human Heights Data as an Indicator of Quality of Life―The Review of
Agricultural Economics, Vol. 59, Hokkaido University, 69-79 (in Japanese).
McGartland, C.P., P.J.Robson et al. (2004) “Fruit and Vegetable Consumption and Bone Mineral Density: Northern Ireland Young Hearts Project,” AmJ Clin Nutr, 80, 1019-23. Mizu, Tamako, Sakamoto Seiji et al.(2015) "Studies on secular changes of Japanese
population," Shimane Prefectural University, Matsue Campus Bulletin, Vol. 53, 77-84 (in Japanese).
Moon, Jin Soo (2011) "Secular trends of body size in Korean children and adolescents: 1965 to 2010,"Korean J. Pediatr., 54(1), 436-442.
Moradi, A. and K. Hirvonen (2016) "The African Enigma: The mystery of tall African adults despite low national incomes revisited," in J. Komlos and I.R. Kelly (eds.), The Oxford
Handbook of Economics and Human Biology, Oxford, Oxford University Press.
Mori, H. and T. Inaba (1997) "Estimating Individual Fresh Fruit Consumption by Agefrom Household Data, 1979 to 1994," Journal of Rural Economics, 69(3), 175-85.
Mori, H. and Y. Saegusa (2010) “Cohort Effects in Food Consumption: What They Are and How They Are Formed, “Evolutionary and Institutional Economics Review, 7(1), 43-63. Mori, H., D.L. Clason, K. Ishibashi, Wm. D. Gorman, and J. Dyck (2009) Declining Orange
Consumption in Japan ― Generational Changes or Something Else? Economic
Mori, H. and H. Stewart (2011) "Cohort Analysis: Ability to Predict Future Consumption- The Cases of Fresh Fruit in Japan and Rice in Korea," Annual Bulletin of Social
Science, No. 45, Senshu University, 153-173.
Mori, Hiroshi (2014) Cohort Analyses for Social Sciences, Tokyo, Center for Academic Publications (in Japanese).
Mori, Hiroshi (2016) “Secular Changes in Body Height and Weight of Population in Japan since the End of WW II in Comparison with South Korea,” The Monthly Bulletin of
Social Science, No.636, Senshu University, June, 13-25.
――― (2016) “Changes in Food Consumption and Secular Changes in Stature in Japan― Comparison with S. Korea," Economic Bulletin of Senshu University, Vol. 51, No. 1, Senshu University, July, 113-127 (in Japanese).
――― (2016) “Secular Trends in Body height of Children in Japan―Food Consumption Perspectives,” Economic Bulletin of Senshu University, Vol. 51, No. 2, Senshu University, November, 67-84 (in Japanese).
Mori, H., T. Inaba, and J. Dyck (2016) "Accounting for structural changes in demand for foods in the presence of age and cohort effects: the case of fresh fish in Japan," Evolut
Inst Econ Rev, published on line: 19 September 2016.
Murata, M. and I. Hibi (1992) "Nutrition and the Secular Trend of Growth," Hormone
Research in Paediatrics, Vol. 38, Suppl. 1, 89-96.
Murata, Mitsunori (2000) "Secular trends in growth and changes in eating patterns of Japanese children," Am. J. Clin. Nutr. vol. 72, no. 5, 1379-1383.
Nakamura, Takashi (1986) "Bayesian Cohort Model for General Cohort Tables," Annals of
the Institute of Statistical Mathematics, 38, 353-370.
Pak, Sunyoung (2004) "The biological standard of living in two Koreas," Economics and
Hyman Biology, 2, 511-521.
―― (2016) Professor at Dept. of Anthropology, Seoul National University (personal correspondence).
Park, Soon-Woo (2016) Professor, Dept. of Preventive Medicine, Catholic University of Daegu School of Medicine, Daegu, Republic of Korea (personal correspondence). Prais, S.J. (1953) "The Estimation of Equivalent-Adult Scales from Family
Budgets,"Economic Journal, 63, No.252, 791-810.
Prynne, C.J., G.D. Mishra et al.(2006) “Fruit and Vegetable Intakes and Bone Mineral Statues: A Cross Sectional Study in 5 Age and Sex Cohorts, "Am. J. Clin. Nutr., 83, 1420-1428.
Qi, Yaqiang and Jianlin Niu (2015) "Does Childhood Nutrition Predict Health Outcomes during Adulthood? Evidence from a Population-Based Study in China," Journal of
Biological Science, 47/05, 650-666.
Reidpath, D.D. and P. Allotey (2003) "Infant mortality as an indicator of population health,"
Rona, Roberto J.(2000) REVIEW "The Impact of the environment on height in Europe: conceptual and theoretical considerations," ANNALS OF HUMAN BIOLOGY, 27(2), 111-126.
Ruel, M.T., J. Rivera, J.P. Habicht, and R. Martorell (1995) "Differential Response to Early Nutrition Supplement: Long-Term Effects on Height at Adolescence," International
Journal of Epidemiology, 24, 404-12.
Schmidt, I.M., M.H. Jorgensen, and K.F. Michaelsen (1995), "Height of conscripts in Europe: is postneonatal mortality a predictor?" Annals of Human Biology, published on line: 09 Jul. 2009.
Schonbeck, Y., Talma, H., van Dommelen, P., Bakker B.,Buitendijk, S.E., HiraSing, R.A., van Buren, S.(2013) “The world’s tallest nation has stopped growing taller: the height of Dutch children from 1955 to 2009,” Pediatr Res. 73(3), 371-7.
Silventoinen, Karri (2003) "Determinants of Variation in Adult Body Height," Journal of
Biosocial Science, Cambridge University Press, 265-285.
Son (2003), Sook Mee (2003) “Food Consumption Trends and Nutrition Transition in Korea,”
Malay J Nutr 9(1): 7-17.
Steckel, Richard H. (1995) "Statue and the Standard of Living," Journal of Economic
Literature, XXXIII, 1903-1940.
Sugiura, M., M. Nakamura, K. Ogawa, Y. Ikoma, F, Ando, and M. Yano (2008) “Bone mineral density in post-menopausal female subjects is associated with serum antioxidant carotenoids,” Osteoporosis International 19-2, 211-219.
Sugiura, M., M. Nakamura, K. Ogawa, Y. Ikoma, and M. Yano (2012) “High Serum Carotenoids Associated with Lower Risk for Bone Loss and Osteoporosis in Post-Menopausal Japanese Female Subjects: Prospective Cohort Study,” PLOS ONE, December, 7(12), 1-9.
――― (2015) “High serum carotenoids associated with lower risk for the metabolic syndrome and its components among Japanese subjects: Mikkabi prospective cohort study, British
Journal of Nutrition, 114, 1674-1682.
Tanaka, M., H. Mori, and T. Inaba (2004) "Re-estimating per capita Individual Consumption by Age from Household Data," Japanese Journal of Rural Economics, 6,20-30.
Umemura, Mataji et al.(1981) Long-Term Statistics on Japanese Economy: Labor Force, Tokyo, Toyo-Keizai-Shimposha (in Japanese).
Vatanparast, H., A. Baxter-Jones, R.A. Faulkner, D.A. Bailey, and S.J. Whiting (2005) “Positive effect of vegetable and fruit consumption and calcium intake on bone mineral accrual in boys during growth from childhood to adolescence: The University of Saskatchewan Pediatric Bone Mineral Accrual Study,”Am J Clin Nutr, 82, 700-706. Whiting S., H. Vatanparast et al. (2004) "Factors that Affect Bone Mineral Accrual in the
Yokoya, Masana (2010) “Geographical Variation in Body Size of Japanese Students and Its Analysis by Mesh Climate Data,” Jpn.J. Nutr.Diet, 68(4), 263-269 (in Japanese). Acknowledgment: