Image Similarity Estimation based on Relevance Feedback using Eye Information
A Thesis Submitted to the Department of Computer Science and Communications Engineering,
the Graduate School of Fundamental Science and Engineering of Waseda University
in Partial Fulfillment of the Requirements for the Degree of Master of Engineering
July 19
th, 2016
By Mario Saputra (5114FG13-9)
of
KAMEYAMA Laboratory
(Professor KAMEYAMA Wataru)
ii
Acknowledgment
First, I want to thank to Professor Wataru Kameyama for accepting me in his lab and also guide and support me during research and studies. I have learned a lot during these times as Kameyama Laboratory member.
I also would like to thank Dr. Suganuma Mutsumi for support to my research and guidance on discussions during the seminars.
A special thanks to Monbukagakusho (MEXT) Scholarship for amazing opportunity.
Without the support from the MEXT, it is impossible for me to finish the Master course and living in Japan.
I would like to thank to all lab members for being friends, having discussion, and giving time for experiment.
And last but not least,I would like to thank my great parents for supporting me always.
iii
Table of Contents
Acknowledges ... i
List of Figures ... iv
List of Tables ... vii
1. Introduction ... 1
1.1 Motivation ... 1
1.2 Objective ... 1
1.3 Organization of the Thesis ... 2
2. Related Works on Image Retrieval Methods ... 3
2.1 Image Retrieval Methods ... 3
2.2 Semantic Gap and Human Subjectivity Issues ... 3
2.3 Relevance Feedback... 4
3. Eye Movement and Pupil Diameter ... 6
3.1 Eye Movement and Pupil Diameter Features ... 6
3.2 Eye Movement as Implicit Feedback ... 6
3.3 Previous and Related Research ... 7
4. Image Similarity Estimation Based on Eye Information ... 8
4.1 Visualization of Image Similarity ... 8
4.2 Proposed Method ... 9
4.3 Dimension Reduction Algorithm ... 12
4.3.1 Principal Component Analysis (PCA) ... 12
4.3.2 Singular Value Decomposition (SVD) ... 13
5. Experiment and Analysis ... 15
5.1 Introduction ... 15
iv
5.2 Experiment ... 17
5.2.1 First Experiment... 18
5.2.2 Second Experiment ... 18
5.3 Experiment Results ... 20
5.3.1 First Experiment Results ... 20
5.3.2 Second Experiment Results ... 27
5.3.2.1 Semantic Experiment Results ... 27
5.3.2.2 Visual Experiment Results ... 32
5.4 Analysis and Consideration ... 36
6. Conclusion ... 40
6.1 Summary ... 40
62. Future Works ... 40
Bibliography ... 42
Appendix A: Publications ... 44
Appendix B: Summary of Master Thesis... 45
v
List of Figures
Figure 2.1 Example of human subjectivity when choosing similar images [3] ... 1
Figure 4.1 Example of Image similarity map for 12 images ... 8
Figure 5.1 Physical appearance of the Eye Tribe eye tracker [15]... 15
Figure 5.2 Correct placement of the Eye Tribe eye tracker [17] ... 16
Figure 5.3 The experiment setting in laboratory ... 16
Figure 5.4 Example of Experimental Pages [3] ... 17
Figure 5.5 Example of semantic similarity images [3] ... 19
Figure 5.6 Example of visual similarity images [3] ... 19
Figure 5.7 PCA Map and Ranking by subject 1 First Experiment ... 20
Figure 5.8 SVD Map and Ranking by subject 1 First Experiment ... 21
Figure 5.9 PCA Map and Ranking by subject 2 First Experiment ... 21
Figure 5.10 SVD Map and Ranking by subject 2 First Experiment ... 21
Figure 5.11 PCA Map and Ranking by subject 3 First Experiment ... 22
Figure 5.12 SVD Map and Ranking by subject 3 First Experiment ... 22
Figure 5.13 PCA Map and Ranking by subject 4 First Experiment ... 22
Figure 5.14 SVD Map and Ranking by subject 4 First Experiment ... 23
Figure 5.15 PCA Map and Ranking by subject 5 First Experiment ... 23
Figure 5.16 SVD Map and Ranking by subject 5 First Experiment ... 23
Figure 5.17 PCA Map and Ranking by subject 6 First Experiment ... 24
Figure 5.18 SVD Map and Ranking by subject 6 First Experiment ... 24
Figure 5.19 PCA Map and Ranking by subject 7 First Experiment ... 24
Figure 5.20 SVD Map and Ranking by subject 7 First Experiment ... 25
Figure 5.21 PCA Map and Ranking by subject 8 First Experiment ... 25
vi
Figure 5.22 SVD Map and Ranking by subject 8 First Experiment ... 25
Figure 5.23 PCA Map and Ranking by subject 9 First Experiment ... 26
Figure 5.24 SVD Map and Ranking by subject 9 First Experiment ... 26
Figure 5.25 PCA Map and Ranking by subject 10 First Experiment ... 26
Figure 5.26 SVD Map and Ranking by subject 10 First Experiment ... 27
Figure 5.27 PCA Map and Ranking by subject 1 Semantic Experiment ... 27
Figure 5.28 SVD Map and Ranking by subject 1 Semantic Experiment ... 27
Figure 5.29 PCA Map and Ranking by subject 2 Semantic Experiment ... 28
Figure 5.30 SVD Map and Ranking by subject 2 Semantic Experiment ... 28
Figure 5.31 PCA Map and Ranking by subject 3 Semantic Experiment ... 28
Figure 5.32 SVD Map and Ranking by subject 3 Semantic Experiment ... 29
Figure 5.33 PCA Map and Ranking by subject 4 Semantic Experiment ... 29
Figure 5.34 SVD Map and Ranking by subject 4 Semantic Experiment ... 29
Figure 5.35 PCA Map and Ranking by subject 5 Semantic Experiment ... 30
Figure 5.36 SVD Map and Ranking by subject 5 Semantic Experiment ... 30
Figure 5.37 PCA Map and Ranking by subject 6 Semantic Experiment ... 30
Figure 5.38 SVD Map and Ranking by subject 6 Semantic Experiment ... 31
Figure 5.39 PCA Map and Ranking by subject 7 Semantic Experiment ... 31
Figure 5.40 SVD Map and Ranking by subject 7 Semantic Experiment ... 31
Figure 5.41 PCA Map and Ranking by subject 1 Visual Experiment ... 32
Figure 5.42 SVD Map and Ranking by subject 1 Visual Experiment ... 32
Figure 5.43 PCA Map and Ranking by subject 2 Visual Experiment ... 32
Figure 5.44 SVD Map and Ranking by subject 2 Visual Experiment ... 33
Figure 5.45 PCA Map and Ranking by subject 3 Visual Experiment ... 33
Figure 5.46 SVD Map and Ranking by subject 3 Visual Experiment ... 33
Figure 5.47 PCA Map and Ranking by subject 4 Visual Experiment ... 34
vii
Figure 5.48 SVD Map and Ranking by subject 4 Visual Experiment ... 34
Figure 5.49 PCA Map and Ranking by subject 5 Visual Experiment ... 34
Figure 5.50 SVD Map and Ranking by subject 5 Visual Experiment ... 35
Figure 5.51 PCA Map and Ranking by subject 6 Visual Experiment ... 35
Figure 5.52 SVD Map and Ranking by subject 6 Visual Experiment ... 35
Figure 5.53 PCA Map and Ranking by subject 7 Visual Experiment ... 36
Figure 5.54 SVD Map and Ranking by subject 7 Visual Experiment ... 36
viii
List of Tables
Table 1 Features used in the comparison ... 11
Table 2 Correlation results from 1st experiment for all subjects ... 37
Table 3 Correlation results from 2nd experiment for all subjects ... 37
Table 4 Most contributing features from 1st experiment for all subjects ... 38
Table 5 Most contributing features from semantic experiment for all subjects ... 38
Table 6 Most contributing features from visual experiment for all subjects .... 39
Table 7 Most important features based on overall experiments ... 40
Chapter 1 Introduction
1.1 Motivation
In recent years, the number of image content increasing greatly especially because of the Internet and large number of images sharing by websites. Because there are abundant of the images available right now, image retrieval method should be improved.
However, there are also some major issues on the current image retrieval method, such as semantic gap between low level visual features, high-level human perception, and subjectivity of human perception. Because of the subjectivity of human, an image can be interpreted differently among different people. That is why, in content based retrieval method, subjectivity is important factor to be considered. One of the ever- studied methods that can measure the subjective image similarity is implicit feedback.
In this research, the main motivation is to utilize implicit feedback using eye information in order to improve current image retrieval method and create better image retrieval experience for users.
1.2 Objective
One way to improve the current content based retrieval method is by finding the similarity of different images according to human subjectivity. To understand about human subjectivity, we can use explicit and implicit feedback. The explicit feedback for example by asking the subject to label the images manually. While the implicit feedback is more natural way to get the information from user, without getting realized by user, for example by using human bio-feedback such as eye-movement. Recent years, since eye-tracking device is easier to get and the accuracy has improved a lot, there are a few researches that utilize eye-movement as implicit feedback for their research. In this research, the main objective is to utilize implicit feedback using eye information to produce the image similarity map reflecting user subjectivity.
2
1.3 Organization of the Thesis
This thesis consists of the six chapters including this one.
Chapter 1: Introduction
This chapter describes motivation, background, and objectives of this research.
Chapter 2: Related Works on Image Retrieval Methods
This chapter explains about text based image retrieval, contents based image retrieval, and some issues about current image retrieval methods.
Chapter 3: Eye Movement and Pupil Diameter
This chapter covers about human biofeedback, eye movement and pupil diameter features, utilization of those information as implicit feedback, and previous and related researches.
Chapter 4: Image Similarity Estimation Based on Eye Information
This chapter presents how we can use eye information to get image similarity estimation, the proposed methods, and also dimension reduction algorithms such as Principal Component Analysis (PCA) and Singular Value Decomposition (SVD).
Chapter 5: Experiment and Analysis
This chapter explains general information about the experiment, such as experiment objectives, set-up, issues, and result as well. Analysis and discussion also covered in this chapter.
Chapter 6: Conclusions
In this chapter, conclusions and future works are explained.
3
Chapter 2
Related Works on Image Retrieval Methods
2.1 Image Retrieval Methods
With the abundance of current available images, for more efficient image searching, current image retrieval method should be improved. Currently, there are two main image retrieval method: text-based and content-based [1]. In text based image retrieval, the images are manually annotated by text descriptors or keywords. So when images searching is performed, users need to input query as text to the system. After that, the system will search images that has same or related keywords with query in the database and retrieve such images. Text based image retrieval is fast and less time consuming, but the main drawback for this method is sometimes it is difficult to describe an image with text due to subjectivity of human perception. Because of that difficulty, in early 1980s, content-based image retrieval was introduced. Content based image retrieval (CBIR) retrieves relevant images from image query. In CBIR, images are indexed by their visual content such as color, texture, shapes. So the user does not need to describe visual content. In CBIR, human interaction is principal part of the system. But with the current system, the result will be same no matter who perform the search. Because of the human subjectivity, it is not clear if the image search results are really what user interested in or intend to search or not. This is the major drawback from current CBIR systems.
2.2 Semantic Gap and Human Subjectivity Issues
Human tend to use high-level features to understand images, such as keywords, label, context, to measure similarities. While computer use low-level features such as color, texture, shape, spatial, etc. to make algorithm to describe the high-level semantic concept for human. However, current algorithms still not adequate to model image semantics and have many limitations when dealing with broad content images [2].
Therefore, it is quite difficult task to bridge semantic gap between low-level and high- level features.
4
Another main issue of CBIR system is the subjectivity of human perception. In this research, we want to improve the CBIR system by studying human behaviors to solve human subjectivity issue. One of the CBIR problem is the search results will be same without considering people who doing the search. For example, in Figure 2.1, if we ask people which one between four images on the right that is most similar with left image, we can get different answers due to human subjectivity. We tried to solve the human subjectivity issue by analyzing human behavior as relevance feedback during images retrieval. We will discuss about relevance feedbacks in the next section.
Figure 2.1 Example of human subjectivity when choosing similar images [3]
2.3 Relevance Feedback
Relevance feedback is a technique to establish the link between high-level concepts and low-level features from user's feedback [4]. So, in relevance feedback based approach, the interaction between human and computer is a very important part. Relevance feedback can be categorized into two. Implicit feedback and explicit feedback. Explicit feedback means the feedback explicitly provided by the user during the task. The example of explicit feedback is by explicitly asking the user which images are similar with query images. The drawback of this method is it burdens the user.
5
The other relevance feedback is implicit feedback. In implicit feedback, the feedback implicitly provided by the user during the task. User will not consciously aware that some feedbacks are collected during the task. Example of implicit feedbacks are human bio-feedback, face expressions, user's behavior, etc. when the user performing the task.
Implicit feedback approach will not add burden to the user and also make the task can be conducted in more natural way. In this research, we focus on human bio-feedback which is eye movement as implicit feedback while performing the image similarity judgement task.
6
Chapter 3
Eye Movement and Pupil Diameter
3.1 Eye Movement and Pupil Diameter Features
Eye tracking is technique to measure eye movement so the researcher can get information where user is looking at, position of the eyes on screen at any given time, the sequence in which their eyes move from one position to another, and also pupil size.
Recent years, eye movement is increasingly employed in Human Computer Interaction (HCI) research because eye tracking device is getting more accurate, not hard to get, and also cheaper.
One of important features that can be collected from eye tracking is information about eyes' fixation. Eye fixation is the moment when the eyes are relatively stationary, taking in or "encoding" information. Fixations last for 218 milliseconds on average, with a range of 66 to 416 milliseconds [5]. Higher fixation frequency can indicate the greater interest in the target. A longer duration of fixation may indicate the difficulty to extract the information or the user somehow more interested with the target.
Pupil size can also be used as an indicator of cognitive workload, emotions and physiological reactions. For example, it has been shown that females with larger pupils evoked more positive feelings in males [6]. Emotion is important factor in human behavior. Therefore, in HCI research, pupil size information can be utilized to analyze the user behavior.
3.2 Eye Movement as Implicit Feedback
Since eye-tracking device is easier to use, getting small, and the accuracy has improved a lot, eye-movement is very appropriate for implicit feedback. Because no device is attached to the user, and it will not interfere the user during the task, user is not consciously aware that their eyes are being tracked. In early studies, eye movement has been utilized in some researches about reading task. Eye tracking can provide information on what document parts users read, and how they were read. Xu et al.
7
applies eye tracking to record how much a user pays attention to different document parts [7]. They use fixation duration on document parts as a direct and simple measure to approximate reading intensity.
There are also some researches in image retrieval that utilized eye movement as implicit feedback. By using eye-tracker, user can browse images naturally and eye-movement information can be collected without getting realized by user. Some previous and related researches will be covered in the next section.
3.3 Previous and Related Researches
There are a few researches that utilize eye-movement as implicit feedback to improve the content based image retrieval. Some of these works are as follows.
Klami et al. [8] try to infer relevance of images from the eye-movement trajectory of user.
Kozma et al. [9] make GaZir (Gaze-based Zooming Interface for Image Retrieval) to retrieve relevance images. Pasupa et al. rank images using eye-movement and histogram image features.
Pasupa et al. [10] have ranked images with eye movements and histogram image features.
Hajimirza et al. [11] have introduced a real-time user adaptive framework to measure interest level of users to images.
A graduated KAMEYAMA Lab member, Nishiguchi also makes image classification and image similarity mapping using eye-movement [12].
In our experiment, we want to utilize eye movement as implicit feedback to generate image similarity estimation. The image similarity estimation will be visualized using two dimensional map for every subject. We hope that by making image similarity map, we can understand more about user behavior and making improvement in CBIR, especially in human subjectivity issue.
8
Chapter 4
Image Similarity Estimation Based on Eye Information
4.1 Visualization of Image Similarity
To visualize image similarity estimation, we created image similarity map which is generated from user’s eye movement information. Image similarity map is a two dimensional map that can reflect the similarity or dissimilarity between several images.
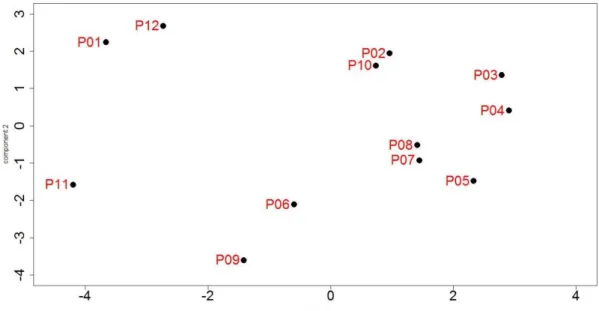
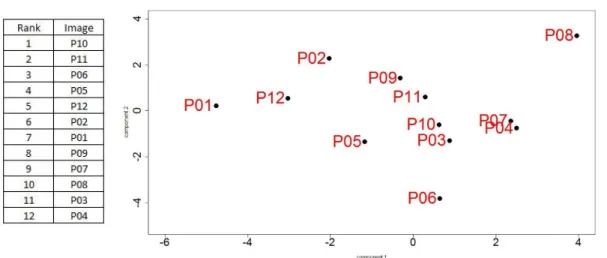
Every image will be placed in XY coordinate as a point, and the distance between every points will resemble the similarity or dissimilarity between every images. Figure 4.1 shows example of image similarity map. Pictures 10 (P02) and picture 02 (P02) have small distance in map, so it means the pictures are similar. While picture 11 (P11) and picture 04 (P04) have large distance in map, it means the pictures are not so similar.
Eye features from user will be collected during the experiment. In order to generate two dimensional map, dimension reduction technique must be applied. Detail about the propose methods and some dimension reduction technique will be covered in next sections.
Figure 4.1 Example of Image similarity map for 12 images
9
4.2 Proposed Method
Main issue of content based image search (CBIR) is the subjectivity of human perception. In this research, we want to improve the CBIR system by providing image similarity map based on human behavior from eye movement information to handle the subjectivity issue. There are some researches that utilize eye movement for image retrieval and image annotation. But currently there is still no research for human subjectivity perspective, especially generating image similarity map from eye movement.
Our proposed method is to give similarity comparison task to subject and record the eye movement in the same time. The task is comparing two images (test images) again a query image. Based on pairwise comparison on test images, we can make the rank and consider the result as subjects’ subjectivity rank, because we will get different rank result for every subject. And then based on the data from eye movement which recorded during experiment, we extract some features from eye movement that can explain about subject’s behavior. Fifteen features have been utilized as shown in Table 1 with new proposed features as of No. 6, No. 7, No. 14 and No.15. Now we will explain briefly what are those features mean.
1. Total number of fixation in an image.
There are some fixations in monitor, but this feature only calculates the total number of fixations that located on the test image. This feature is the number of fixations on the test images during whole experiment.
2. Total duration of fixations in an image.
This feature is the total length of duration of all fixations from feature #1.
3. Average duration of fixations in an image.
This feature is the value of feature #2 divided by feature #1 4. Maximum value of fixation duration in an image.
This feature is the number of maximum duration among all fixations from feature #1.
5. Average fixation duration when an image first gazed.
This feature is the value of average duration fixations which belong the first gazed fixations on an image.
10 6. SD of fixation position in x-coordinate.
This feature is the number of standard deviation from all fixations’ position in x-coordinate on an image.
7. SD of fixation position in y-coordinate.
This feature is the number of standard deviation from all fixations’ position in y-coordinate on an image.
8. Number of measurements
This feature is the total number of eye position located on an image.
9. Maximum pupil diameter
This feature is the largest value of average pupil diameter size in x and y coordinate measured in mm.
10. Average value of pupil diameter
This feature is the value of all pupil diameters that located on an image divided by the number of measurement.
11. Rank of average fixation duration compared to other image in same page.
This feature is the rank of the feature #3 when compared to the same feature of the other images in the same page.
12. Rank of total fixation duration compared to other image in same page.
This feature is the rank of the feature #2 when compared to the same feature of the other images in the same page.
13. Rank of maximum fixation duration compared to other image in same page.
This feature is the rank of the feature #4 when compared to the same feature of the other images in the same page.
14. SD of gaze position in x-coordinate.
This feature is the number of standard deviation from all eye position in x- coordinate on an image.
15. SD of fixation position in y-coordinate.
This feature is the number of standard deviation from all eye position in y- coordinate on an image.
11
Table 1. Features used in the Comparison
After calculated all the eye features on every test image, we can get matrix of features that contain “number of test images” row and “number of features” column for every subject from an experiment. Based on this features matrix, we tried to generate similarity mapping using dimension reduction algorithm. Details about dimension reduction algorithm that we have utilized will be explained in next section.
No Feature Descrip tion Prop osed in
1 Total number of fixations in an
image [9], [10]
2 Total duration of fixations in an
image [9], [10]
3 Average duration of fixations in an
image [9], [10]
4 M aximum value of fixation
duration in an image [9]
5 Average fixation duration when an
image first gazed [9]
6 SD of fixation p osition in x- coordinate
New Prop . 7 SD of fixation p osition in y -
coordinate
New Prop .
8 Number of measurements [9]
9 M aximum p up il diameter [9]
10 Average value of p up il diameter [9]
11
Rank of Average Fixation Duration comp ared to other image in same p age
[9]
12
Rank of Total Fixation Duration comp ared to other image in same p age
[9]
13
Rank of M aximum Fixation Duration comp ared to other image in same p age
[9]
14 SD of gaze p osition in x-coordinate New Prop . 15 SD of gaze p osition in y -
coordinate
New Prop .
12
4.3 Dimension Reduction Algorithm
As we have explained on previous section, from the experiment and features extraction, we will have data which contains 15 features for every subject. If we have many features, especially more than 3, it will be difficult to understand all the interrelationships. And also we cannot make the visualization of the data, because we can only see maximum in 3 dimensional spaces. In order to understand the data, the dimension should be reduced. Most of datasets also highly redundant. By using dimension reduction algorithm, we can get the smaller dimension of data without significance loss of information. Some common dimension reduction algorithm such as Principal Component Analysis (PCA), MDS (Multidimensional Scaling), SVD (Singular Value Decomposition), K-Mean Clustering, and Factor Analysis. In our experiment, we have tried to use PCA, MDS, K-mean clustering, and SVD. In next sub-section, we will cover PCA and SVD algorithm, because we mainly used them in this research.
4.3.1 Principal Component Analysis (PCA)
The objective of Principal Component Analysis is to reduce the dimensionality of a dataset while keep as much as possible of the variation present in the data set. PCA finds the principal components of the dataset. Mathematically, the principal components are the eigenvectors of the covariance matrix of the original dataset. Then, PCA transforms the data into a new, lower-dimensional subspace and a new coordinate system. The first axis corresponds to the first principal component, which is the component that explains the greatest amount of the variance in the data. The second axis is the second principal component, which is orthogonal to the first principal component, and soon. So, PCA takes the cloud of data points and rotates it such that the maximum variability is visible. Figure 4.2 illustrated that we can use two principal components to transform the data point from a two dimensional space to new two dimensional subspaces.
13
Figure 4.2 Dataset are transformed to new coordinate system of principal components 𝜑1 and 𝜑2
Basically PCA method are consists of these steps:
1. Get some data 2. Subtract the mean
3. Calculate the Covariance Matrix
4. Calculate the eigenvectors and eigenvalues of covariance matrix.
5. Choose components and form a feature vector 6. Derive the new data set
To perform the PCA, we used statistical programming language called R. R provides function prcomp to performs a principal components analysis on the given data matrix and returns the results as an object of class prcomp [13]. Then, by using summary function, we can get the list of all principal components, the variances values, and important features as well. To make the map, we can use plot function from the PCA results into two or three dimensional space.
4.3.2 Singular Value Decomposition (SVD)
Singular Value Decomposition is a technic to decompose any matrix and get the singular value, which contain important information about the data. Mathematically, if we have m × n matrix M, we can decompose the matrix M into product of three matrices.
𝐌 = 𝐔 × 𝐃 × 𝐕𝑻
14
Where 𝐔 is an m × m orthonormal matrix, 𝐃 has singular values and m × n diagonal matrix, and 𝐕𝑻 is n × n orthonormal matrix. After we decomposed the matrix, we can reconstruct the dataset using one singular vector only. SVD can reduce redundant data that is linear dependent from the perspective of linear algebra. Therefore, it can be applied to dimension reduction to create the similarity map.
To perform the SVD, we also used R. R provides function svd to performs SVD on the given feature matrix [14]. This function will give us the d, u, and v value that we can use to reconstruct the matrices. To make the map, we can use plot function from the SVD results into two or three dimensional space.
15
Chapter 5
Experiment and Analysis
5.1 Introduction
The main objective of our experiments is to make image similarity map based on implicit feedback from subject. In order to do that, we need to collect the ground truth by giving image similarity task to user. And at the same time, we implicitly record the eye movement as implicit feedback. Eye tracking device and open source software are utilized to conduct the experiments. The detail of experiments will be explained in next section.
To record the eye movement, we used eye tracker device called Eye Tribe [15]. The device is relatively small, portable, and accurate. Figure 5.1 shows the appearance of the device. In order to track the user's eye accurately, the tracker must be placed below the screen and pointing at the user. Figure 5.2 visualize the correct placement of the device.
Figure 5.1 physical appearance of the Eye Tribe eye tracker [15]
Before using the device, the system is need to be calibrated. This device also provide guideline [16] how to use it correctly to maximize the accuracy. Gaze position, eye fixation, pupil's size can be obtained from eye-tracker. To ensure the accuracy, we decided to use sampling rate 30Hz, since we experienced some data lost when using
16
60Hz mode. For the display, we used 19inch monitor. Figure 5.3 shows the real experiment setting in the laboratory.
Figure 5.2 correct placement of the Eye Tribe eye tracker [17]
Figure 5.3 The experiment setting in laboratory
Another important tool for experiment is the open source software called OGAMA [18].
OGAMA is a software that designed to analyze eye and mouse movements in slideshow study design. In order to record the eye movement on the screen, we need to prepare slideshows that will be shown to the subject during experiment. Our experiments’
slideshows and also experiments’ flow have been made using this software. This
17
software supports the Eye Tribe eye-tracker, so we can connect the Eye Tribe to this software without any problem. This software is equipped with so many features, but the main important modules for our experiment are recording module to record the experiment, and database module to obtain the result from experiment.
5.2 Experiment
The experiment task is comparing image similarity between query image and test images. First, a page containing one image called query image is shown to a subject.
After that, the subject proceeds to the next page which contains 2 images by pressing spaces key on the keyboard. A query page and a comparing task page are shown in Fig.5.4.
On this page, subject is asked to choose an image which is more similar to the query image. Subject gave the answer with numeric key on keyboard corresponding to the location of each test image: Num.4 for left image and Num.6 for the right image. We used numeric key because it is easy to press the keys without need to look at the keyboard.
Figure 5.4 Example of Experimental Pages [3]
After five pages comparing two images, the query image is shown again to make sure that the subject still remember the query image. General flow for the experiment is as follow.
1. Subject is explained about the experiment task and experiment workflows.
2. Arrange the position of subject. Subject need to be in comfortable position and the hand is standby on the keyboards.
18
3. Experiment practices to make sure subject understand the task and can give the answer correctly by pressing the key without looking at keyboard.
4. Eye tracking device calibration. It is necessary to get the accurate result. The calibration is done in OGAMA. Figure 5.6 shows the calibration display.
5. If there is no problem, then the real experiment can be conducted. There is no time limit for the experiment.
6. After subject finished all the task, make sure all the data from experiment is recorded and also asked the subject if there were any issues during the experiment.
Two kind of experiments have been done. We will explain in details for the both of experiments in the next sub-section.
5.2.1 First Experiment
There are totally 204 pages including 170 comparing task pages and 34 query pages.
The number of images for the comparison task is 27 images, where 15 images are dummy and not used for the ranking. They are included in order to reduce the memory effect of ever-seen images in the task pages and to make a subject carefully focus on the image comparison. Each image is taken from LabelMe 8 Categories dataset [3]. To get similarity ranking, pairwise comparison method on 12 images is applied. For the first experiment, data from 10 subjects (6 males, and 4 females) have been collected.
The average age of the subjects is 23.5 with 2.97 SD of age.
5.2.2 Second Experiment
In the first experiment, there was a possibility that the subjects may take different criterion to judge the image similarity, and the number of dummy images may not be large enough to reduce the memory effect. With this reason, we conduct the second experiment which is divided into two. The first one is to ask subjects to judge the similarity based on semantic feature, and the second one is to ask subjects to judge the similarity based on visual feature
19
Semantic feature means objects or scene context of an image. For example, in Figure 5.4, the both of pictures can be considered as Tall Building, so we can say that both pictures are similar based on semantic feature.
Figure 5.5 Both of the pictures can be considered as tall building semantically [3]
Visual feature means color, texture, shape, or spatial layout of an image. For example, in Figure 5.6, the both of pictures looked similar based on color, texture, layout, etc. So we can say that both pictures are similar based on visual feature.
Figure 5.6 Both of the pictures can be considered as similar visually [3]
First, we did semantic experiment. After subject finished with semantic experiment, we moved to visual experiment. Clear definition and instruction about those similarities is given to the subjects before the experiment. The experiment task is still same with first experiment, which is comparing test images with query image and choose the most similar one from the test images. What make it different is the number of test images
20
and dummy images. The second experiment uses 6 task images and 24 dummy images.
And, there are totally 90 pages including 75 comparing task pages and 15 query pages.
Each image is taken from LabelMe 8 Categories dataset differently from the first experiment. To get the ranking, pairwise comparison method on 6 images is applied.
For the second experiment, data from 7 subjects (3 males, and 4 females) have been collected. The average age of the subjects is 21.75 with 2.25 SD of age.
5.3 Experiment Results
Based on results of subject’s selection, we applied pairwise comparison to make the subjectivity ranking for the ground truth. And from the results of eye tracking data, we calculated 15 features of eye movement and pupil size data. List of all features that has been utilized is shown in Table 4.1. After that, dimension reduction algorithm is applied to make image similarity map. In the next sub-section, we will show results from all experiments.
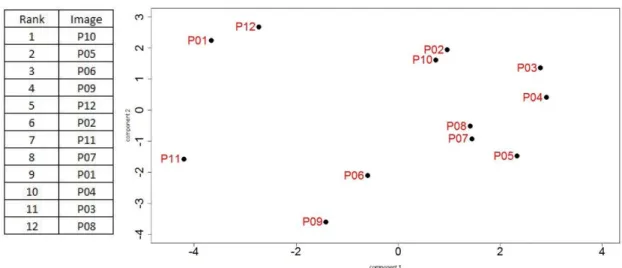
5.3.1 First Experiment Results
Subject 1
Figure 5.7 Comparison between PCA Map and Ranking by subject 1
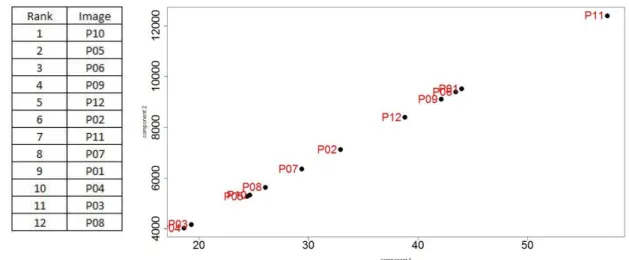
21
Figure 5.8 Comparison between SVD Map and Ranking by subject 1
Subject 2
Figure 5.9 Comparison between PCA Map and Ranking by subject 2
Figure 5.10 Comparison between SVD Map and Ranking by subject 2
22 Subject 3
Figure 5.11 Comparison between PCA Map and Ranking by subject 3
Figure 5.12 Comparison between SVD Map and Ranking by subject 3
Subject 4
Figure 5.13 Comparison between PCA Map and Ranking by subject 4
23
Figure 5.14 Comparison between SVD Map and Ranking by subject 4
Subject 5
Figure 5.15 Comparison between PCA Map and Ranking by subject 5
Figure 5.16 Comparison between SVD Map and Ranking by subject 5
24 Subject 6
Figure 5.17 Comparison between PCA Map and Ranking by subject 6
Figure 5.18 Comparison between SVD Map and Ranking by subject 6
Subject 7
Figure 5.19 Comparison between PCA Map and Ranking by subject 7
25
Figure 5.20 Comparison between SVD Map and Ranking by subject 7
Subject 8
Figure 5.21 Comparison between PCA Map and Ranking by subject 8
Figure 5.22 Comparison between SVD Map and Ranking by subject 8
26 Subject 9
Figure 5.23 Comparison between PCA Map and Ranking by subject 9
Figure 5.24 Comparison between SVD Map and Ranking by subject 9
Subject 10
Figure 5.25 Comparison between PCA Map and Ranking by subject 10
27
Figure 5.26 Comparison between SVD Map and Ranking by subject 10
5.3.2 Second Experiment Results
5.3.2.1 Semantic Experiment Results
Subject 1
Figure 5.27 Comparison between PCA Map and Ranking by subject 1
Figure 5.28 Comparison between SVD Map and Ranking by subject 1
28 Subject 2
Figure 5.29 Comparison between PCA Map and Ranking by subject 2
Figure 5.30 Comparison between SVD Map and Ranking by subject 2
Subject 3
Figure 5.31 Comparison between PCA Map and Ranking by subject 3
29
Figure 5.32 Comparison between SVD Map and Ranking by subject 3
Subject 4
Figure 5.33 Comparison between PCA Map and Ranking by subject 4
Figure 5.34 Comparison between SVD Map and Ranking by subject 4
30 Subject 5
Figure 5.35 Comparison between PCA Map and Ranking by subject 5
Figure 5.36 Comparison between SVD Map and Ranking by subject 5
Subject 6
Figure 5.37 Comparison between PCA Map and Ranking by subject 6
31
Figure 5.38 Comparison between SVD Map and Ranking by subject 6
Subject 7
Figure 5.39 Comparison between PCA Map and Ranking by subject 7
Figure 5.40 Comparison between SVD Map and Ranking by subject 7
32
5.3.2.2 Visual Experiment Results
Subject 1
Figure 5.41 Comparison between PCA Map and Ranking by subject 1
Figure 5.42 Comparison between SVD Map and Ranking by subject 1
Subject 2
Figure 5.43 Comparison between PCA Map and Ranking by subject 2
33
Figure 5.44 Comparison between SVD Map and Ranking by subject 2
Subject 3
Figure 5.45 Comparison between PCA Map and Ranking by subject 3
Figure 5.46 Comparison between SVD Map and Ranking by subject 3
34 Subject 4
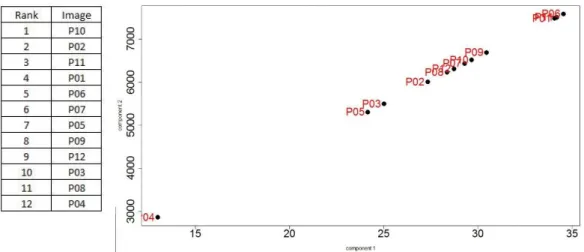
Figure 5.47 Comparison between PCA Map and Ranking by subject 4
Figure 5.48 Comparison between SVD Map and Ranking by subject 4
Subject 5
Figure 5.49 Comparison between PCA Map and Ranking by subject 5
35
Figure 5.50 Comparison between SVD Map and Ranking by subject 5
Subject 6
Figure 5.51 Comparison between PCA Map and Ranking by subject 6
Figure 5.52 Comparison between SVD Map and Ranking by subject 6
36 Subject 7
Figure 5.53 Comparison between PCA Map and Ranking by subject 7
Figure 5.54 Comparison between SVD Map and Ranking by subject 7
5.4 Analysis and Consideration
Pearson correlation and spearman correlation have been calculated to estimate the map’s accuracy. In Pearson correlation, first we calculate the distance between every two points in the map and put it into first vector. Second, we also calculate ranking distances for every image in subjectivity ranking and put it into second vector. And last, we calculate correlation between those two vectors using cor function in R. So the correlation value shows the pearson correlation between map and subjectivity ranking.
The larger value of pearson correlation shows higher accuracy similarity map and subjectivity ranking.
For spearman correlation, we correlation between rank and rank. First, from the SVD result, we create the vector of rank based on eye movement information. And then we also put the subjectivity rank from experiment task into second vector. And last, we calculate the spearman correlation between those two vectors using cor function with
37
spearman method in R. So the correlation value shows the spearman correlation between SVD map and subjectivity ranking. The larger value of spearman correlation shows higher accuracy similarity map and subjectivity ranking.
Accuracy results from first and second experiment for all subjects are shown in Table 2 and Table 3.
Table 2. Correlation results from 1st experiment for all subjects
From the first experiment, Subject 1 from 10 subjects shows strong Pearson correlation, and Subject 2 shows strong Spearman correlation. For the second experiment, Subject 1 from 7 subjects shows strong person correlation and Subject 3 shows strong spearman correlation. The best accuracy is obtained from Subject 6 on the second experiment by 0.79 value of pearson correlation and 0.89 value of spearman correlation. The maps and ranking results for this case are shown in Figure 5.47 and Figure 5.48.
Table 3. Correlation results from 2nd experiment for all subjects
38
From the PCA result, we can find most contributing features from eye movement.
Based on this result, we listed the most contributing features for every subjects and every experiments. The results are show in Table 4, 5, and 6.
Most contributing features from 1st experiment
Table 4. Most contributing features from 1st experiment for all subjects
From these tables, Total Fixation Duration appears six times and Number of Measurement three times. From this result, we can conclude that Total Fixation Duration is the most important features. And the Number of Measurement as the second important feature. From Table 4, 5, and 6 we ranked the features based on the number of appearances as most important feature from all subjects and all experiments. Based on the number of frequency, we list the features rank for overall result in Table 7.
Most contributing features from 2nd experiments
Table 5. Most contributing features from semantic experiment for all subjects
Subject Most contributing features Contribution
1 Total Fixation Duration 10.47%
2 Average First Fixation Duration 10.87%
3 Number of Measurements 12.58%
4 Average Fixation Duration Rank 10.34%
5 Number of Measurements 10.36%
6 Total Fixation Number 10.70%
7 Total Fixation Duration 10.91%
8 SD of X-coordinate of pupil location 73.34%
9 Total Fixation Duration 13.13%
10 Total Fixation Duration 10.91%
Subject Most contributing features Contribution
1 Total Fixation Number 9.63%
2 SD of X-coordinate of eye fixation 10.80%
3 SD of Y-coordinate of eye fixation 13.56%
4 Average Fixation Duration 10.45%
5 Total Fixation Duration Rank 9.94%
6 Total Fixation Duration 10.47%
7 Number of Measurements 10.70%
39
Table 6. Most contributing features from visual experiment for all subjects
Overall Features Contribution Result
Table 7. Most important features based on overall experiments
Subject Most contributing features Contribution
1 Maximum Fixation Duration 9.62%
2 SD of X-coordinate of pupil location 9.00%
3 Maximum Pupil Diameter 10.47%
4 Maximum Pupil Diameter 11.22%
5 Average Fixation Duration 10.44%
6 Total Fixation Duration 10.39%
7 SD of Y-coordinate of eye fixation 9.64%
Rank Most contributing features Frequency
1 Total Fixation Duration 6
2 Number of Measurement 3
3 Total Fixation number 2
3 SD of X-coordinate of pupil location 2
3 Maximum pupil diameter 2
3 Average Fixation Duration 2
3 SD of Y-coordinate of eye fixation 2
4 Average Fixation Duration Rank 1
4 Total Fixation Number 1
4 SD of X-coordinate of eye fixation 1
4 Average Fixation Duration 1
4 Total Fixation Duration Rank 1
4 Maximum Fixation Duration 1
40
Chapter 6 Conclusion
6.1 Summary
In this research, we have generated image similarity map to estimate the subjectivity for image similarity task based on eye information as implicit feedback. From experiments and the results, we can conclude following things:
From the first experiment, 1 from 10 subjects shows strong Pearson correlation, and 2 from 10 subjects shows strong Spearman correlation.
For the second experiment, 1 from 7 subjects shows strong person correlation and 3 from 7 subjects shows strong spearman correlation.
From the subjects’ answers of the second experiment, more resembling ranking results between the users are obtained, which means it seemed easier for the subjects to make the comparison. However, the accuracy of the map is still not so different with first experiment.
According to the results, SVD seems to produce better similarity mapping than PCA in most of the cases.
Total fixation duration and number of measurement are the most contributing features.
From the experiment results, we found that some images of near rank selected by a subject also have near distance on the map. However, the number of images that show similarity in the map and the ranking is different between each subject. In the next section, we will present some works that might be will help to improve the result.
6.2 Future Works
We have shown image similarity analysis based on eye information. The results vary from subject to subject. According to the features’ contribution result, number of fixation duration and pupil measurement are important. So we need to design new experiment that can collect more information about subject’s fixation and eye gaze. We
41
need to find the optimum set of features by adding new features or removing unimportant features, and also applying another algorithm that can produce the better result.
42
Bibliography
[1] Ying Liu, Dengsheng Zhang, Guojun Lu and Wei-Ying Ma, "A survey of contentbased image retrieval with high-level semantics," A survey of contentbased image retrieval with high-level semantics, 2007.
[2] Xiang Sean Zhou and Thomas S.Huang, "Relevance feedback in image retrieval: A comprehensive review," Multimedia Systems 8: 536–544, 2003.
[3] "8 Scene Categories Dataset," LabelMe, [Online]. Available:
http://people.csail.mit.edu/torralba/code/spatialenvelope/. [Accessed 18 07 2016].
[4] Yong Rui, Thomas S. Huang, Michael Ortega and Sharad Mehrotra, "Relevance Feedback: A Power Tool for Interactive Content-Based Image Retrieval," IEEE
TRANSACTIONS ON CIRCUITS AND SYSTEMS FOR VIDEO TECHNOLOGY, VOL. 8, NO. 5, 1998.
[5] Alex Poole and Linden J.Ball, "Eye Tracking in Human-Computer," in Encyclopedia of human computer interaction, IRM Press, 2006, pp. 211-223.
[6] Timo Partala and Veikko Surakka, "Pupil size variation as an indication of affective processing," Int. J. Human-Computer Studies 59, pp. 185-198, 2003.
[7] Songhua Xu, Hao Jiang and Francis C.M. Lau, "User-Oriented Document Summarization through Vision-Based Eye-Tracking," in 14th international conference on Intelligent user interfaces, New York, 2009.
[8] Arto Klami, Craig Saunders, Teófilo E. de Campos and Samuel Kaski, "Can relevance of images be inferred from eye movements?," in 1st ACM international conference on Multimedia information retrieval, New York, 2008.
[9] Arto Klami, Craig Saunders, Teófilo E. de Campos and Samuel Kaski, "GaZIR: Gaze- based zooming interface for image retrieval," in 11th Conference on Multimodal Interfaces and The Sixth Workshop on Machine Learning for Multimodal Interaction, 2009.
[10] Kitsuchart Pasupa, Craig J. Saunders, Sandor Szedmak, Arto Klami, Samuel Kaski and Steve R. Gunn, "Learning to Rank Images from Eye movements," in Computer Vision Workshops (ICCV Workshops), 2009 IEEE 12th International Conference, Kyoto, 2009.
43
[11] Hajimirza, S. Navid, M. J. Proulx and E. Izquierdo, "Reading Users’ Minds From Their Eyes: A Method for Implicit Image Annotation," IEEE TRANSACTIONS ON MULTIMEDIA, vol. 14, no. 3, 2012.
[12] Yuki Nishiguchi, Mutsumi Suganuma and Wataru Kameyama, "Image Classification Using Eye Movements and Pupil Size," in International Workshop on Smart Info-Media Systems in Asia, 2014.
[13] "Principal Components Analysis," stat.ethz.ch, [Online]. Available:
https://stat.ethz.ch/R-manual/R-patched/library/stats/html/prcomp.html. [Accessed 18 07 2016].
[14] "Singular Value Decomposition of a Matrix," stat.ethz.ch, [Online]. Available:
https://stat.ethz.ch/R-manual/R-devel/library/base/html/svd.html. [Accessed 18 07 2016].
[15] T. E. Tribe, "The Eye Tribe," The Eye Tribe, [Online]. Available:
https://theeyetribe.com/. [Accessed 18 07 2016].
[16] "Setting Up Eye Tribe," The Eye Tribe, [Online]. Available:
http://dev.theeyetribe.com/start/. [Accessed 18 07 2016].
[17] "Eye Tracking 101," The Eye Tribe, [Online]. Available:
http://dev.theeyetribe.com/general/. [Accessed 18 07 2016].
[18] "OGAMA (Open Gaze And Mouse Analyzer)," Ogama, [Online]. Available:
http://www.ogama.net/. [Accessed 18 07 2016].
44
Appendix A: Publications
1. Mario Saputra, Mutsumi Suganuma, Wataru Kameyama, “Preliminary Experimental Result on Image Similarity Estimation based on Eye Information”, IEICE General Conference. March, 2016. Fukuoka, Japan.
2. Mario Saputra, Mutsumi Suganuma, Wataru Kameyama, “An Analysis of Image Similarity Estimation based on Eye Information”, Forum on
Information Technology. September, 2016. Toyama, Japan. (to be presented)
45
Appendix B: Summary of Master Thesis 修 士 論 文 概 要 書
Summary of Master’s Thesis
Date of submission: _07_/_19_/_2016_
専攻名(専門 分野)
Department
Computer Science and Communications Engineering
氏 名 Name
Mario
Saputra 指 導 教 員 Advisor
KAMEYAMA Wataru
印
Seal 研究指導名
Research guidance
Multimedia Information Distribution Systems
学籍番号 Student ID
number
5114FG 13-9
研究題目 Title
Image Similarity Estimation based on Relevance Feedback using Eye Information
概 要 Summary
he thesis is organized in 6 chapters and can be summarized as follows:
Chapter 1 Introduction
This chapter describes motivation, background, and objectives of this research.
Image similarity is very subjective and different from person to person. In this research, the main objective is to make image similarity map based on eye information from subject.
Chapter 2 Overview of the Image Retrieval Methods
This chapter explains about text based image retrieval, contents based image retrieval, and some issues about current image retrieval methods.
Main issue of content based image search (CBIR) is the subjectivity of human perception. In this research, we want to improve the CBIR system by providing image similarity map based on human behavior from eye movement information to handle the subjectivity issue.
Chapter 3 Eye Movement and Pupil Diameter
This chapter covers about human biofeedback, eye movement, pupil diameter features, utilization of those information as implicit feedback, and previous and related researches.
Chapter 4 Image Similarity Estimation Based on Eye Information
This chapter presents how we can use eye information to get image similarity estimation. There are some researches that utilize eye movement for image retrieval and image annotation. But currently there is still no research for human subjectivity perspective, especially generating image similarity map from eye movement. Our proposed method is using dimension reduction algorithms such as Principal Component Analysis (PCA) and Singular Value Decomposition (SVD) to generate image similarity map.
Chapter 5 Experiment and Analysis
This chapter explains the experiment setup, hardware and software used in the experiment, experiment design, experiment flows and experiment subjects as well. Results from experiment and discussion are also presented here. We collect ground truth from subjects by giving image similarity comparison task. First, a page containing one image called query image is shown to a subject. After that, the subject proceeds to the next page which contains 2 images by pressing a key on the keyboard. On this page, subject is asked to choose an image which is more similar to the query image. After five pages comparing two images, the query
46
image is shown again to make the subject remember that. A query page and a comparing task page are shown in Fig.1.
Fig.1 Example of Experimental Pages [Images are taken from LabelMe dataset]
At the same time, we implicitly record the eye movement from the subjects using an eye tracking device. Images ranking is made by using the pairwise comparison method based on subjects’ selection. Dimension reduction technique such as PCA and SVD have been applied to the data to generate the two dimensional map from subjects’ eye information. Then, we compare the result between the similarity map and user’s subjectivity ranking.
We also conduct the second experiment to handle some issues from first experiment in order to improve the result. The second experiment is separated into two. The first one is to ask subjects to judge the similarity based on semantic feature, and the second one is to ask subjects to judge the similarity based on visual feature. Semantic feature means objects or scene context of an image, while visual feature means color, texture, shape, or spatial layout of an image. Pearson correlation and spearman correlation have been calculated to estimate the map’s accuracy. Results from first and second experiment for all subjects are shown in Table 1 and Table 2.
Table 1. Correlation results from 1st experiment for all subjects
Table 1. Correlation results from 1st experiment for all subjectsTable 2. Correlation results from 2nd experiment for all subjects
47
From the first experiment, 1 from 10 subjects shows strong Pearson correlation, and 2 from 10 subjects shows strong Spearman correlation. For the second experiment, 1 from 7 subjects shows strong person correlation and 3 from 7 subjects shows strong spearman correlation. The best accuracy is obtained from Subject 6 on the second experiment by 0.89 value of spearman correlation. The maps and ranking results for this case are shown in Fig.2.
Fig.2 PCA map, SVD map, and subjectivity ranking from subject 6 Semantic Experiments
Chapter 6 Conclusions
According to the results, SVD seems to produce better similarity mapping than PCA in most of the cases. To improve the result, an optimized and efficient set of features have to be found as well as better algorithm to classify them.
![Figure 2.1 Example of human subjectivity when choosing similar images [3]](https://thumb-ap.123doks.com/thumbv2/123deta/9853992.1898553/12.893.195.759.386.722/figure-example-human-subjectivity-choosing-similar-images.webp)