Study on
Dispersion-Managed High-Speed WDM Transmission Technologies in Optical Submarine Cable Systems
ග
ගᾏᗏࢣ࣮ࣈࣝࢩࢫࢸ࣒࠾ࡅࡿ
ศᩓ࣐ࢿ࣮ࢪ࣓ࣥࢺ㧗㏿ WDM ఏ㏦ᢏ⾡
㛵ࡍࡿ◊✲
February 2014
Keiji TANAKA
⏣୰ ၨோ
Study on
Dispersion-Managed High-Speed WDM Transmission Technologies in Optical Submarine Cable Systems
ග
ගᾏᗏࢣ࣮ࣈࣝࢩࢫࢸ࣒࠾ࡅࡿ
ศᩓ࣐ࢿ࣮ࢪ࣓ࣥࢺ㧗㏿ WDM ఏ㏦ᢏ⾡
㛵ࡍࡿ◊✲
February 2014
Waseda University
Graduate School of Fundamental Science and Engineering
Keiji TANAKA
Contents
Chapter 1 Introduction ... 5
1-1 Background and objectives... 5
1-2 Outline of the thesis... 12
References... 16
Chapter 2 System design considerations for optical fiber communications... 19
2-1 Introduction... 19
2-2 Management of transmission systems... 20
2-2.1 Fundamental concept of system design... 20
2-2.2 Transmission loss compensation... 22
2-2.3 Dispersion management... 24
2-2.4 Fiber nonlinearity mitigation... 27
2-3 System design method... 28
2-3.1 Analytical method... 28
2-3.2 Numerical method... 30
2-3.3 Experimental method... 31
2-3.4 Performance evaluation method... 33
2-4 Conclusion... 35
References... 37
Chapter 3 Dispersion management technologies in long-haul WDM transmission systems... 39
3-1 Introduction... 39
3-2 Dispersion-managed WDM transmission systems... 41
3-2.1 NZ-DSF-based system... 41
3-2.2 SMF-based system... 43
3-2.3 Comparison of NZ-DSF and SMF-based systems... 47
3-3 Numerical simulations of 10 Gbit/s-based WDM transmission systems... 50
3-3.1 NZ-DSF-based system... 50
3-3.2 SMF-based system... 54
3-4 Experiments on 10 Gbit/s-based WDM transmission systems... 56
3-4.1 Experimental setup... 56
3-4.2 Results and discussion... 59
3-5 Dispersion-flattened fiber-based WDM transmission system... 64
3-5.1 Single-channel transmission experiment... 66
3-5.2 WDM transmission experiment... 68
3-5.3 Results and discussion... 71
3-6 Conclusion... 75
References... 76
Chapter 4 40 Gbit/s-based WDM unrepeatered transmission system using dispersion-managed transmission line and Raman amplification ... 79
4-1 Introduction... 79
4-2 Dispersion-managed WDM transmission systems... 80
4-2.1 Key issues of system design... 80
4-2.2 Hybrid transmission line configuration... 84
4-2.3 Remote EDF scheme... 85
4-3 40 Gbit/s-based WDM transmission experiment... 86
4-3.1 Experimental setup... 86
4-3.2 Results and discussion... 89
4-4 Conclusion... 93
References... 95
Chapter 5 High-spectral efficient 40 Gbit/s-based DWDM transmission systems using signal-spectrum filtering ... 98
5-1 Introduction... 98
5-2 Impact of nonlinear crosstalk in 100 GHz-spaced 40 Gbit/s DWDM systems using SMF-based dispersion-flattened transmission line... 99
5-2.1 Experimental setup... 100
5-3.2 WDM transmission... 108
5-4 Optical pre-filtering for bandwidth limitation of signal spectrum... 110
5-4.1 Bandwidth limitation of signal spectrum... 110
5-4.2 WDM transmission experiments... 114
5-5 Performance of optically filtered CS-RZ DPSK signal... 120
5-5.1 CS-RZ DPSK signal... 120
5-5.2 Back-to-back performance... 123
5-5.3 Dispersion and nonlinear tolerances... 128
5-5.4 WDM transmission experiments... 130
5-6 Conclusion... 134
References... 136
Chapter 6 Capacity upgrade of JIH system using 40 Gbit/s-based WDM transmission technologies ... 139
6-1 Introduction... 139
6-2 JIH submarine cable system... 140
6-3 Upgrade methodology... 142
6-4 Numerical simulations of 1 Tbit/s transmission system for capacity upgrade ... 143
6-4.1 Simulation model... 143
6-4.2 Results and discussion... 147
6-5 Experiments on 1 Tbit/s transmission system for capacity upgrade... 149
6-5.1 Experimental setup... 149
6-5.2 Results and discussion... 152
6-6 Conclusion... 158
References... 159
Chapter 7 Conclusion... 162
Appendix A Fundamental equation describing optical signal propagation in a dispersive nonlinear fiber ... 164
A-1 Derivation of fundamental equation... 164
A-2 Key parameters describing a dispersive fiber... 169
Appendix B Modulation formats for optical fiber communications
... 171
B-1 Typical waveforms in IM-DD systems... 171
B-2 Benefit of RZ format against nonlinear impairments... 172
Appendix C Forward error correction technology ... 174
Acknowlegements ... 176
List of publications by the author... 177
Chapter 1
Introduction
1-1 Background and objectives
Optical submarine cable systems have been crucially important infrastructures to provide high-capacity international transmission links for increasing overseas data traffic. In order to meet insatiable market demands, new cable systems have been developed by breaking through technological bottlenecks for the transmission capacity expansion.
Figure 1-1 shows the capacity growth of the transpacific optical submarine cable systems. Since the first transpacific optical submarine cable (TPC-3) was installed in 1989, the capacity per fiber has been dramatically increasing associated with the technological evolution. In 2010, the capacity per fiber was eventually expanded to 1 Tbit/s, which was more than 1000-fold capacity increase.
0.1 1 10 100 1000 10000
1985 1990 1995 2000 2005 2010 2015
Capacity per fiber [Gbit/s]
Year TPC-3
TPC-4 TPC-5CN
China-US
Japan-US
TGN-P Unity
WDM technology
EDFA
Fig. 1-1 Capacity growth of the transpacific optical submarine cable systems.
Table 1-1 summarizes the installed year, per-fiber capacity, and applied technologies of each cable systems. Among many innovative technologies which were applied to newly developed cable systems, in particular, the advent of the erbium-doped fiber amplifier (EDFA) and wavelength division multiplexing (WDM) accelerated the capacity expansion and technological evolution. EDFAs can facilitate the transmission of lightwave signals over long distances by providing periodic analog amplification rather than digital regeneration. This is the main benefits of EDFA-based optically amplified systems, and it does not require electro-optic regenerators, which include high-speed electronics and restrict the increase of the transmission bit rate due to its complexities and difficulties. Thus, the EDFA-based repeater systems enabled gigabit-capable transmissions, and per-fiber bit rate was increased from 560 Mbit/s to 5 Gbit/s of TPC-5CN [1]. TPC-5CN introduced in 1996 employs a single-channel 5 Gbit/s signal with non-return-to-zero on-off keying (NRZ-OOK) format and dispersion-shifted fiber (DSF)-based transmission line. The DSF is designed such that the zero-dispersion wavelength is shifted to 1.55-Pm band, where the fiber exhibits a minimum loss.
EDFAs can amplify optical signals independently of its format and bit rate, and the transparency of the EDFAs made WDM transmission technology to be a practical solution to expand the system capacity [2]. The emergence of WDM transmission technology also contributed to a dramatic increase of the system capacity. The transmission capacity eventually increased to more than 20-fold in the next few years from the installation of TPC5-CN, and the performance of WDM transmissions was enhanced to be applicable to transoceanic distances using low noise 980-nm pumped EDFA chains. In the 2000’s, transpacific cable systems with more than 100 Gbit/s per-fiber capacity were commercially introduced, such as Japan-US and PC-1 with the per-fiber capacity of 160 Gbit/s by using 10 Gbit/s-based WDM transmission technologies [3].
Table 1-1 Key technologies applied to submarine cable systems. SystemYearPer-fiber capacity [Gbit/s]SignalTransmission line SpanRepeater TPC-319890.28NRZ (1.3-Pm band)SMF3R (50-kmspacing) TPC-419920.56NRZ (1.55-Pmband)DSF3R (120-kmspacing) TPC-5CN19955NRZDSF EDFA (1.48-Pmpumped)China-US199920 (2.5 x 8 WDM)
NRZ (2.5 Gbit/s-based WDM)NZ-DSF Japan-US PC-12001160 (10 x 16 WDM)RZ (10 Gbit/s-based WDM)
Hybrid LCF + NZ-DSF EDFA (0.98-Pmpumped)TGN-P2003640 (10 x 64 WDM)Hybrid SMF + SCDCF Unity2010960 (10 x 96 WDM)
RZ-DPSK (10 Gbit/s-based WDM) 7
The transparent property of the EDFA imposes impairments on the transmission performance, while the feature is advantageous in the low system cost and bit-rate free flexibility. As optically amplified repeater systems recover the only amplitude of the signals by nature, all the impairments generated through the transmission accumulate with the distance and cannot be recovered. Amplified spontaneous emission (ASE) noise generated in EDFAs degrades the optical signal-to-noise ratio (SNR), and the interactions between chromatic dispersion and nonlinear effects in optical fibers cause the pulse distortions [4]-[9]. The system should be designed to mitigate the transmission impairments by managing the dispersion and nonlinearities of the transmission line and using suitable modulation formats and schemes.
When the system is operated at the zero-dispersion wavelength of fibers, the signal and the amplifier noise, which are accompanied with wavelengths close to the signal, travel at almost the same velocities. Under these conditions, the signal and noise interact closely over a long distance, and induce undesirable nonlinear phenomena [5]-[7]. Chromatic dispersion making different wavelength components to propagate at different group velocities contributes to suppress the nonlinear effects, and in order to minimize the effects, non-zero dispersion-shifted fiber (NZ-DSF) had been introduced instead of the DSF [10]. The NZ-DSF has a dispersion of -2 to -4 ps/nm/km, in general.
The management of single channel transmission performance is relatively simple.
The accumulated dispersion of the DSF or NZ-DSF with a negative dispersion value can be compensated for by standard single-mode fiber (SMF) which has a positive dispersion value of +17 ps/nm/km. This dispersion compensation (i.e. dispersion management) can prevent the generation of the nonlinear effects caused by the interactions between the signal and ASE noise, owing to the short phase-matching lengths and the small end-to-end dispersion. In contrast, the dispersion management in WDM transmissions using a higher-channel bit rate is much more complicated than that of single channel transmissions. For WDM transmissions, the system design factors which should be managed are increased, and we must additionally consider the impact
The objective of this thesis is to explore the technologies for the further capacity expansion of a per-fiber capacity of more than 160 Gbit/s and to develop new dispersion-managed high-speed WDM transmission technologies for terabit-capacity submarine cable systems beyond Japan-US and PC-1. The usable bandwidth of long-haul WDM systems is limited by both the inherent bandwidth of the EDFAs and the acceptable dispersion of the channels located at far from zero-dispersion wavelength.
The EDFA bandwidth is finite and of the order of 20 nm, and the waveform distortions of the channels whose wavelengths are far from zero-dispersion wavelength are potentially large. It is very challenging to increase the aggregate capacity of WDM systems on the above conditions, and key design issues are the dispersion management of the transmission line to mitigate nonlinear impairments and to resolve the wavelength dependency of dispersion among WDM channels and the technologies to increase the channel packing density, namely spectral efficiency, at the terminals.
For achieving such a high-capacity transmission, dispersion values of all the WDM channels must be managed. Transoceanic submarine cable systems using NZ-DSF-based transmission lines such as PC-1 and Japan-US have a wavelength dependency on the WDM transmission performance, and the transmissible distance and capacity are restricted by the performance of the edge channels located at far from zero-dispersion wavelength. The largely accumulated dispersion at the edge channels severely deteriorates the performance through the interactions with nonlinear effects.
This is the main bottleneck for increasing the transmission capacity in the NZ-DSF-based transmission lines, which is caused by the wavelength dependency of the dispersion, namely the dispersion slope over the WDM signal band.
The dispersion management using a SMF-based hybrid span configuration is considered as a candidate to resolve the problems associated with the dispersion slope of the fibers. The hybrid span configuration of a SMF with an enlarged effective core area (Aeff) and a slope-compensating dispersion compensation fiber (SC-DCF) attains flat dispersion characteristics all over the WDM channels, and a large absolute dispersion value of 17 ps/nm/km and a large Aeff of the SMF contribute to the reduction of nonlinear effects such as four-wave mixing (FWM) and cross-phase modulation (XPM) in WDM systems [5]-[13]. This approach is quite effective for further capacity expansion of more than 160 Gbit/s, and the feasibility of terabit-capacity transoceanic
submarine systems are numerically and experimentally studied in Chapter 3. In fact, the hybrid-span configuration of a SMF and a SC-DCF was applied to the submarine cable systems of TGN-P and Unity which were deployed next to 160 Gbit/s-classed PC-1 and Japan-US in 2003 and 2010, respectively.
The dispersion management for unrepeatered transmission systems is also included in the scope of this thesis. For unrepeatered transmission systems, different dispersion management schemes are required because the profiles of power level over the distance are completely different from those in EDFA-based repeatered systems. Raman amplification and remote-EDFA are usually applied for unrepeatered systems by feeding the pump power for amplifications from both or either side of the terminals [14], [15].
In this application, the dispersion management is one of the most important key design issues to expand the transmissible capacity by suppressing the nonlinear penalty and the accumulated dispersion in optical amplified transmission lines. As the channel bit rate of WDM transmission systems, a higher-channel bit rate of 40 Gbit/s is commercially advantageous over 10 Gbit/s in terms of spectral efficiency and footprint in the terminals. The longest distance of 40 Gbit/s-based WDM unrepeatered transmissions in the previous reports was limited to 250 km [16]. In the research on the 40 Gbit/s-based WDM unrepeatered transmission described in Chapter 4, by optimizing the transmission line configuration composed of SMFs with an Aeff of 175 Pm2 and a NZ-DSF and the amplification scheme, the transmission distance over 306 km was successfully demonstrated for the first time.
In addition to dispersion management, several technologies at the optical transmitter and receiver are also explored. Spectral efficiency (i.e. bandwidth efficiency) is another key parameter for the system design to enlarge aggregate capacity in a finite EDFA bandwidth. The technologies for a highly spectral efficient 40 Gbit/s-based WDM transmission are studied in Chapter 5. As the method to achieve a high spectral efficiency, the bandwidth limitation of signal spectrum by using an optical filter before transmission (i.e. pre-filtering) is considered. Detailed studies on the
whereas remarkable demonstrations of 40 Gbit/s-based dense WDM (DWDM) transmission have been reported by using symmetrically pre-filtered DPSK signals [22]-[24].
After revealing the impact of inter- and intra-channel interactions on transmission performance in 40 Gbit/s-based DWDM systems using SMF-based transmission spans, the optimum pre-filtering condition for 42.7 Gbit/s CS-RZ DPSK signals is numerically and experimentally investigated by comparing the dispersion and nonlinear tolerances between unfiltered, asymmetrically, and symmetrically filtered CS-RZ DPSK signals.
In addition, the feasibility of transoceanic transmission with a spectral efficiency of 0.8 bit/s/Hz is explored through the transmission experiments.
Capacity upgrade is also an important key issue on system design, and the technologies at the terminals of optical transmitter and receiver are also studied. The rapid progress of transmission technologies as shown in Fig.1-1 has shortened the effective lifetime of the existing submarine cable systems because the applied technologies at the time of the deployment became old-fashioned one. Submarine cable systems have an adequate beginning-of-life system margin as they are designed with a 25-year life expectancy. It is desired to utilize the existing infrastructure efficiently by upgrading the capacity in order to extend the system lifetime and recoup the investment. As installed optical fiber spans and amplifiers in submarine cable systems cannot be replaced, the adoption of the terminal upgrade technologies is the only way to enlarge the transmission capacity. These are advanced signal formats and forward error correction (FEC) codes [25]. The trade-offs in the selection of upgrade technologies are cost and performance, and it is important to design the upgrade system in order to satisfy the required quality with the minimum cost.
The possibility of more than 16-fold capacity upgrade is studied in Chapter 6 by citing a domestic submarine cable system of Japan Information Highway (JIH) [26].
JIH submarine cable system has the per-fiber capacity of around 50 Gbit/s using 2.5 Gbit/s-based WDM technologies with 100 GHz-spaced NRZ signals. The possibility of terabit-capacity upgrade is numerically and experimentally explored by using a higher-channel bit rate of 40 Gbit/s signal with RZ or CS-RZ modulation formats and FEC codes in the transmission line designed for a 2.5 Gbit/s-based WDM system.
1-2 Outline of the thesis
This thesis includes seven chapters and three appendixes. Figure 1-2 illustrates the organization of the thesis. Dispersion management technologies are mainly presented in Chapters 2, 3, 4, and 5, and terminal technologies are described in Chapters 5 and 6.
Appendixes A, B, and C are attached in the thesis to explain the derivation of the fundamental equation describing optical signal propagation, modulation formants, and FEC technologies supplementarily.
In this chapter, Chapter 1, the evolution of optical submarine cable systems is described with the accompanied technologies. Then, after reviewing the key system design issues for the capacity expansion of WDM transmission systems, the objective of the thesis work is mentioned.
In Chapter 2, system design considerations are presented for optical fiber communications. Firstly, fundamental concept of system design is explained based on the nonlinear Schrödinger equation, which governs the behavior of optical pulse propagation in fibers. From the model equation, the conditions and concept for system design are analytically discussed on transmission loss compensation, dispersion management, and nonlinearity mitigation. In addition, the methods for the system design are presented: analytical method to estimate accumulated nonlinearities over a single fiber span, numerical method to fully analyze the model equation to simulate the transmission performance, and experimental method using recirculating loop technique.
Finally, the meaning of the Q-factor which is the key index to evaluate the transmission performance of digital communication systems is explained.
In Chapter 3, the dispersion management for transoceanic submarine cable systems is described. After reviewing two different dispersion management schemes using DSF- and SMF-based span configurations, the transmission performances of the two configurations are numerically and experimentally compared. The results obtained by these studies show that the SMF-based span configuration is more beneficial than the
transmission experiment.
In Chapter 4, the dispersion management for unrepeatered transmission systems is described. Firstly, dispersion-managed transmission line configuration for Raman amplification is studied to alleviate the transmission impairments and to extend the transmissible distance by increasing the amplification gain. Then, as the result of the optimization, a successful result of a 40 Gbit/s-based terabit-capacity unrepeatered transmission over 306 km is presented.
In Chapter 5, the technologies for a highly spectral efficient 40 Gbit/s-based WDM transmission are discussed. Firstly, the impact of nonlinear crosstalk on conventional RZ signal format is experimentally explored in 50 GHz-spaced 40 Gbit/s DWDM systems to clarify the transmissible distance and induced transmission penalties. Next, the optical pre-filtering scheme is described as a practical solution to reduce the linear crosstalk for achieving a highly spectral efficient transmission, and a 50 GHz-spaced 40 Gbit/s x 25 WDM transmission over 480 km is presented by using bandwidth-limited RZ signals. Finally, pre-filtering conditions for different signal formats are numerically and experimentally investigated for achieving a spectral efficiency of 0.8 bit/s/Hz. As the results of the optimization studies for pre-filtering conditions including 9,000 km WDM transmission experiments, the feasibility of transoceanic transmission with a spectral efficiency of 0.8 bit/s/Hz is revealed.
In Chapter 6, the possibility of more than 16-fold capacity upgrade of JIH is presented. JIH submarine cable system has the per-fiber capacity of around 50 Gbit/s using 2.5 Gbit/s-based WDM technologies with 100 GHz-spaced NRZ signals. The possibility of terabit-capacity upgrade is investigated by using a higher-channel bit rate of 40 Gbit/s signal with RZ or CS-RZ modulation format and FEC technologies in the transmission lines designed for a 2.5 Gbit/s-based WDM system. Through the numerical and experimental studies, the feasibility of a 100 GHz-spaced 25 x 42.7 Gbit/s transmission with the total capacity of 1 Tbit/s is presented by using proper FEC technologies and signal formats.
In Chapter 7, the substantial knowledge and results from Chapters 2 to 6 are summarized.
Three appendixes A, B, and C are attached to supplementarily explain the equations and schemes used in the thesis. In Appendix A, the fundamental equations describing
the optical pulse propagation in a dispersive nonlinear media are derived from Maxwell’s equations, and key parameters for the optical transmissions are reviewed.
In Appendix B, after introducing typical modulation formats, the benefit of RZ format against nonlinear impairments is presented by numerical simulations. The basic concept and benefit of FEC technology is explained in Appendix C.
Fig.1-2Organization of the thesis.
Study on Dispersion-Managed High-speed WDM Transmission Technologies in Submarine Cable Systems㻌 Chapter 1 : Introduction㻌 Chapter 2 : System design considerations for optical fiber communications㻌 Management of transmission systems System design method Chapter 3 : Dispersion management technologies in long-haul WDM transmission systems㻌 Dispersion-managed WDM transmission systems Simulations and experiments of 10 Gbit/s-based WDM transmission systems Dispersion-flattened fiber-based WDM transmission system Chapter 4 : 40Gbit/s-based WDM unrepeatered transmission system using dispersion-managed transmission line and Raman amplification㻌 Dispersion-managed WDM transmission systems 40 Gbit/s-based WDM transmission experiment Chapter 5 : High-spectral efficient 40 Gbit/s-based DWDM transmission systems using signal-spectrum filtering 㻌 Impact of nonlinear crosstalk in 100 GHz-spaced DWDM systems with SMF-based dispersion-flattened transmission line Dispersion management for 40 Gbit/s-based WDM transmission systems Optical pre-filtering for bandwidth limitation of signal spectrum Performance of optically filtered CS-RZ DPSK signal Chapter 6 : Capacity upgrade of JIH system using 40 Gbit/s-based WDM transmission technologies㻌 JIH submarine cable system Upgrade methodology Simulations and experiments of 1 Tbit/s transmission system for capacity upgrade Chapter 7 : Conclusion
㻌
References
[1] H. Wakabayashi, Y. Namihira, S. Akiba, S. Yamamoto, M. Ohkawa, and H.
Yamamoto, “OS-A optical amplifier submarine cable system”, Suboptic1993, paper 4.2, 1993.
[2] N. Bergano and C. R. Davidson, “Wavelength division multiplexing in long-haul transmission systems”, IEEE/OSA J. Lightwave Technol., vol. 14, pp. 1229-1308, 1996.
[3] N. Edagawa and I. Morita, “Recent trends and future perspective of ultrahigh-capacity transoceanic transmission systems”, ECOC2002, 9.1.1, 2002.
[4] E. Desurvire, “Erbium doped fiber amplifiers: principles and applications”, John Wiley and Sons, New York, 1994.
[5] D. Marcuse, A. R. Chraplyvy, and R. W. Tkach, “Effect of fiber nonlinearity on long distance transmission”, IEEE/OSA J. Lightwave Technol., vol. 9, pp.
121-128, 1991.
[6] D. Marcuse, “Single-channel operation in very long nonlinear fibers with optical amplifiers at zero dispersion”, IEEE/OSA J. Lightwave Technol., vol. 9, pp.
356-361, 1991.
[7] D. Marcuse, “Bit-error rate of lightwave systems at the zero-dispersion wavelength”, IEEE/OSA J. Lightwave Technol., vol. 9, pp. 1330-1334, 1991.
[8] D. Marcuse, “RMS width of pulses in nonlinear dispersion fibers”, IEEE/OSA J.
Lightwave Technol., vol. 10, pp. 17-21, 1992.
[9] G. P. Agrawal, “Nonlinear fiber optics”, California, USA: Academic Press, 1989.
[10] L. D. Garret, M. Eiselt, and R. Tkach, “Experimental comparison of WDM system capacity in conventional and non-zero dispersion shifted fiber”, OAA 1998, TuB2, 1998.
[11] L. F. Mollenaur, J. P. Gordon, and M. M. Islam, “Soliton propagation in long
Electron., vol. 19, pp. 1-17, 1987.
[13] R. H. Stolen, “Nonlinear properties of optical fibers”, in Optical Fiber Telecommunications, Edited by S. E. Miller and A. G. Chynoweth, New York, USA: Academic Press, 1979.
[14] Y. Aoki, “Properties of fiber Raman amplifiers and their applicability to digital optical communication systems”, IEEE/OSA J. Lightwave Technol., vol. 7, pp.
1225-1239, 1990.
[15] R. H. Stolen and E. P. Ippen, “Raman gain in glass optical waveguides”, Appl.
Phys. Lett., vol. 22, pp. 276-278, 1973.
[16] E. Brandon, J. –P. Blondel, F. Boubal, L. Buet, V. Havard, A. Hugbart, L.
Labrunie, P. Le Roux, D. Toullier, and R. Uhel, “1.28 Tbit/s (32 x 40 Gbit/s) unrepeatered transmission over 250 km”, ECOC2000, vol. 4, pp. 21-23, 2000.
[17] T. Tsuritani, A. Agata, K. Imai, I. Morita, K. Tanaka, T. Miyazawa, N. Edagawa, and M. Suzuki, “35 GHz-spaced-20 Gbps × 100 WDM RZ transmission over 2700 km using SMF-based dispersion flattened fiber span”, ECOC2000, PD1.5, 2000.
[18] G. Charlet, W. Idler, R. Dischler, J. -C. Antona, P. Tran, and S. Bigo, “3.2Tbit/s (80 x 42.7 Gb/s) C-band transmission over 9 x 100 km of TeraLight fiber with 50 GHz channel spacing”, OAA2002, PDP1, 2002.
[19] T. Tsuritani, I. Morita, A. Agata, and N. Edagawa, “Study on optimum optical pre-filtering condition for highly spectral-efficient ultralong-haul transmission using 40Gbit/s CS-RZ signal and all-Raman repeaters”, OFC2003, FE4, 2003.
[20] A. Agata, I. Morita, T. Tsuritani, and N. Edagawa, “Characteristics of asymmetrically filtered 40Gbit/s CS-RZ signals”, OFC2003, MF78, 2003.
[21] T. Tsuritani, A. Agata, I. Morita, and N. Edagawa, “21.4 Gbit/s x 56 WDM 9170 km transmission using symmetrically dispersion-managed fibre span”, ECOC2001, PD. M1.6, 2001.
[22] A. H. Gnauck, G. Raybon, S. Chandrasekhar, J. Leuthold, C. Doerr, L. Stulz, and E. Burrows, “25 x 40-Gb/s co-polarized DPSK transmission over 12 x 100-km NZDF with 50-GHz channel spacing”, IEEE Photon. Technol. Lett., vol. 15, pp.
467-469, 2003.
[23] B. Zhu, L. E. Nelson, S. Stulz, S. Gnauck, C. Doerr, J. Leuthold, L.
Gruner-Nielsen, M. O. Pedersen, J. Kim, R. Lingle, Y. Emori, Y. Ohki, N. Tsukiji, A. Oguri, and S. Namiki, “6.4-Tb/s (160 x 42.7 Gb/s) transmission with 0.8 bit/s/Hz spectral efficiency over 32 x 100 km of fiber using CSRZ-DPSK format”, OFC2003, PD19, 2003.
[24] T. Tsuritani, K. Ishida, A. Agata, K. Shimomura, I. Morita, T. Tokura, H. Taga, T.
Mizouchi, and N. Edagawa, “70 GHz-spaced 40 x 42.7 Gbit/s transmission over 8700 km using CS-RZ DPSK signal, all-Raman repeaters and symmetrically dispersion fiber span”, OFC2003, PD23, 2003.
[25] S. Yamamoto, H. Takahira, and M. Tanaka, “5 Gbit/s optical transmission terminal equipment using forward error correction code and optical amplifier”, Electron. Lett., vol. 30, pp. 254-255, 1994.
[26] H. Yamamoto, H. Tanaka, and K. Goto, “Japan Information Highway – Wideband WDM Technology –”, OECC’98, 15D1-6, 1998.
Chapter 2
System design considerations for optical fiber communications
2-1 Introduction
The advent of optical amplifiers has changed the methodologies of transmission system design, which is an essential work in developing optical transmission systems. The fiber attenuation is no longer limiting factor, and the optical amplifier noise and the signal waveform distortions become major factors to determine the transmission performance. Most of the transmission properties including those limiting factors accumulate with the distance in optically amplified systems, and therefore a careful system design is required especially in long-haul transmission systems.
Key system design parameters and phenomena which should be managed are optical SNR, fiber dispersion, and nonlinearities. The optical SNR of signals passing through a chain of optical amplifiers is degraded by ASE noise, while the attenuation of optical signals is compensated for by optical amplifiers [1]. As the optical SNR practically defines the baseline of acceptable bit-error rate (BER) performance, a high signal launch power to a transmission line and a low ASE property of optical amplifiers are required. Fiber dispersion and nonlinearities induce waveform distortions, which result in the deterioration of the BER performance. In high-speed WDM transmission systems, the difference of dispersion in the signal wavelength band and nonlinear interactions among WDM channels provide a severe impact on the system performance [2]-[6].
In this chapter, firstly, the requirements for managing the system performance in high-speed WDM transmission systems are analytically derived by using the propagation equation in a dispersive nonlinear optical fiber. Based on those requirements, the fundamental concepts of the system design and management schemes of transmission impairments are presented.
The method to estimate or evaluate the system performance precisely is important
in designing the system. Three approaches are used in this thesis: analytical, numerical, and experimental ones. In addition, key system parameters and the relations are also presented.
2-2 Management of transmission systems
The fundamental concept and key parameters for designing the transmission systems are introduced in this section, and the methods for the system design are also explained.
2-2.1 Fundamental concept of system design
The behavior of the envelope of electric field q(z,t) in a fiber is described by the nonlinear Schrödinger (NLS) equation as
6 0 2
1 2
3 3 2
2
w
cccw w
ccw w
w q q i q
t k q i t k q z
i q J D . (2.1)
The derivation of the NLS equation from Maxwell’s equations is presented in Appendix A-1. The second and third terms on the left hand side of Eq. (2.1) indicates the second- and third-order dispersion effects, respectively, and the forth term including q2 represents the nonlinear effect. The last term represents the attenuation of the signal, where D is the transmission loss coefficient of the optical fiber.
For simplicity, we firstly consider a linear transmission system in the absence of the nonlinear term in Eq. (2.1). The equation describing the evolution of q(z,t) along z-direction can be written in the form:
w w
w 2 3
The Fourier transform of the equation yields
q k
k z i
q ~
6 1 2
~ 1
3 2
¿¾
½
¯®
¸
¹
¨ ·
©
§ cc ccc w
w Z Z D , (2.3)
where the Fourier transform of q(z,t) is defined as
f
³
f
Z
S Z
Zd e z q z
t
q ~( , ) i t
2 ) 1 ,
( . (2.4)
The solution of Eq. (2.3) is given by
) ( )
) (
0 ,
~( ) ,
~( z q e Az e iD z
q Z Z , (2.5)
where the real and imaginary parts of exponential coefficient, A(z) and D(z), are
³
z dz A
0
) ( )
( D ] ] , (2.6)
³
³
zkcc d zk ccc dz D
0 3 0
2 ( )
6 ) 1 2 (
) 1
( Z ] ] Z ] ] . (2.7)
The transmission impairments should be managed so that the spectrum ~q(Z,z) does not change from the initial one q~(Z,0). From Eqs. (2.5)-(2.7), it is clear that the conditions for a penalty-free transmission are
0 ) (
³
0zD ] d] , (2.8)0 ) 6 (
) 1 2 (
1
0 3 0
2
³
zkcc] d] Z³
zk ccc ] d]Z . (2.9)
These equations express the fundamental concept of system design, and Eqs. (2.8) and (2.9) indicate the transmission loss compensation and dispersion management, respectively.
Next, we consider the effects of fiber nonlinearities on optical signals. Focusing on the only terms associated with fiber nonlinearities, Eq. (2.2) is led to
q q z i
q 2
w J
w . (2.10)
From the equation, the optical signal q(t,z) can be described as
z z
e
iNt q z t
q ( , ) ( , 0 )
( ) , (2.11)where the phase N(z) is represented by
)2
, 0 ( )
(z q z
N J . (2.12)
The nonlinear effects arising from the nonlinear index of refraction give rise to an intensity-dependent phase change of the optical signals. Hence, a phase control scheme is necessary to mitigate or compensate for the nonlinear phase change.
2-2.2 Transmission loss compensation
Although the amplitude of the optical pulses decreases due to the transmission loss of fibers, it can be recovered by optical amplifiers which are located discretely at regular intervals. In optically amplified systems, however, the transmission performance is deteriorated by the ASE noise generated in amplifiers, and it accumulates to power levels similar to the data signal. This accumulated noise degrades the system performance by relatively reducing the optical SNR. The ASE noise power PN is given by
B G h N
PN f Q( 1) , (2.13)
where Nf is the noise figure, hv is the photon energy,G is the amplifier gain, and Bis the bandwidth of optical filter following EDF to cut the ASE noise outside of the signal bandwidth [1].
The output power of amplifiers is set to be a fixed constant value, and therefore a portion of the signal in the output power decreases as the ASE noise accumulates with transmission distance. Figure 2-1 shows the relation among the output power from EDFAs, signal power, and accumulated noise power along with transmission distance.
As the ASE noise is superimposed at each amplifier, the total noise power is given by
amp f
S amp
f
S amp
N S
GBN h N
P BN
G h N
P N
P SNR P
Q
Q( 1) | . (2.14)
The ASE noise accompanied with optical amplification degrades the optical SNR, which is one of the most important features of digital transmission systems. Since the required optical SNR is increased with the bit rate linearly, it is necessary to keep a sufficient optical SNR for a higher-channel bit rate on the condition that fiber nonlinearities induced by increasingPsdo not affect the transmission performance.
Eq. (2.14) indicates that optical SNR can beincreased by shortening the amplifier spacing. For example, we consider the situation that the amplifier spacing is assumed to be halved from 100 km to 50 km. As the transmission loss of fibers is typically 0.2 dB/km, the amplifier gainG decreases by 10 dB. In this case, the required number of amplifierNamp increases by only 3 dB, and therefore it is found that the SNR eventually increases by 7 dB from Eq. (2.14).
Fig.2-1 Output power from EDFAs, signal power, and accumulated noise power along with transmission distance.
2-2.3 Dispersion management
A solution of Eq. (2.9) describing the concept of dispersion management is given by 0
) (
0
³
zkcc] d] , (2.15)0 ) (
0
³
zk ccc] d] . (2.16)For single-channel transmissions, the scope of the management is limited in the 2nd-order dispersion as expressed in Eq. (2.15) because the 3rd-order dispersion is negligible within a single-channel spectral window. In contrast, however, for WDM transmission systems in which WDM signal spectral window is wide enough to affect the signal quality, the 3rd-order dispersion compensation as expressed in Eq. (2.16) should be mandatorily considered in addition to the 2nd-order dispersion compensation.
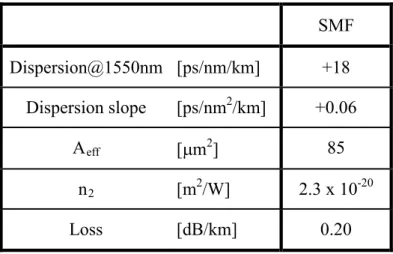
Figure 2-2 shows a transmission line configuration using a 2nd-order dispersion management. The corresponding accumulated dispersion along the distance, which is known as dispersion map, and the dispersion are also illustrated in the figure. The transmission line consists of nine spans of a 50 km-long NZ-DSF and a 50 km-long SMF [7]. The dispersion of the NZ-DSFs and SMF at the center wavelength of the WDM signal (Ocenter) is -2 and +18 ps/nm/km, respectively. Therefore, the accumulated dispersion of nine NZ-DSF spans is compensated for by using a single span of SMF.
It should be noted that only one channel among many WDM channels can be set to its system dispersion to zero. Although the 2nd-order dispersion compensation is very effective and widely used for single-channel transmission systems, the wavelength dependence of the accumulated dispersion must be considered in long-haul WDM transmission systems. In Fig. 2-2 where the system zero-dispersion is allocated at the center wavelength of the WDM signal, the accumulated dispersion of the edge channels
Fig.2-2 Transmission line configuration for dispersion management, the corresponding accumulated dispersion, and the dispersionalong with the transmission distance.
The dispersion with a wavelength dependencyD(O) can be described as
d L
D( ) dD(O O0)
O O , (2.17)
where O d
dD represents dispersion slope, O0 is zero-dispersion wavelength, and L is
fiber length. Figure 2-3 shows the dispersion property of a WDM signal with a 30-nm wavelength band. The WDM signal has a 2 ps/nm/km dispersion range, since the dispersion slope of conventional fibers is 0.07 ps/nm2/km. The local dispersion of the
NZ-DSF spans is -3 and -1 ps/nm/km for the shortest and longest wavelengths, respectively, and the corresponding system dispersion becomes -1 and +1 ps/nm/km.
The dispersion accumulates with the transmission distance, and the largely accumulated dispersion of the channels located at far from the zero-dispersion wavelength causes signal distortions in WDM transmission systems. It is an important consideration factor in designing long-haul WDM transmission systems to manage the accumulated dispersion over all the signal wavelength range.
Fig.2-3 Dispersion property of a WDM signal with a 30-nm wavelength band.
2-2.4 Fiber nonlinearity mitigation
The nonlinearities are also inherent characteristics of optical fibers inducing signal distortions, and those can be classified into two categories: stimulated scattering and effects arising from the nonlinear index of refraction. Stimulated scattering such as Brillouin scattering and Raman scattering is manifested as intensity-dependent gain or loss [8]-[12], while effects arising from the nonlinear index such as self-phase modulation (SPM) and cross-phase modulation (XPM) give rise to an intensity-dependent phase change of the optical field as described in Eq. (2.11).
There is a trade-off between optical SNR and fiber nonlinearities in terms of the system performance. A high optical SNR is desired to keep a good system performance, while it induces high nonlinear effects on optical signals and results in the performance degradation. This is an important system design parameter in high-speed transmission systems, and the transmission performance in 10 Gbit/s-based long-haul WDM systems is severely restricted due to the interactions between fiber nonlinearities and largely accumulated chromatic dispersion.
Two approaches are considered to deal with the nonlinear effects. The first approach is to mitigate nonlinearities by applying a proper dispersion management, such as the use of special dispersion maps and span configurations. Dispersion management includes the mitigation of nonlinear behaviors in addition to dispersion compensation. The key fiber parameters are a large Aeff and a large local dispersion.
It is intuitively understood that a larger Aeff should be allocated in a high power portion following an optical amplifier to reduce the nonlinear effects which are inversely proportional to Aeff . Chromatic dispersion which makes WDM channels travel at different group velocities contributes to evade the phase matching, and it results in the reduction of nonlinear interactions between WDM channels.
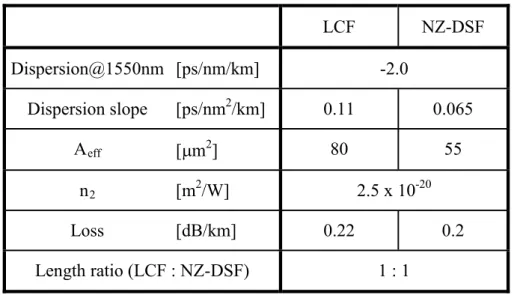
Hybrid-span configuration using a large core fiber (LCF) is a possible solution to reduce nonlinearities in long-haul 10 Gbit/s-based WDM transmission systems [13], [14]. Figure 2-4 shows the configuration of a typical span configuration using a LCF with a non-zero dispersion value. The LCF is located after the EDFA to minimize the
nonlinearities where the signal power level is the highest in a single fiber span. A low dispersion-slope NZ-DSF follows the LCF to alleviate a high dispersion slope property of the LCF, because it has a large dispersion slope as the result of enlarging the Aeff .
The second approach is to completely compensate for the induced nonlinear phase change by adding a proper frequency chirp to initial signals or by using soliton as the signal format [15]-[17]. Soliton positively uses the SPM and does not change its shape through the transmission by balancing with a positive dispersion of the fiber.
Fig.2-4 Span configuration using a LCF and low dispersion-slope NZ-DSF.
2-3 System design method
As the methods to evaluate the transmission performance, analytical, numerical, and experimental approaches are described in this section.
2-3.1 Analytical method
pulse propagation described by the NLS equation can be solved directly. In considering transmission impairments independently, however, analytical approaches are more effective and useful. The dispersive terms of the NLS equation is expressed as linear processes, so that the problem is more easily solved in the frequency domain by using the Fourier transform.
As for fiber nonlinearities, the nonlinear effects can be investigated by focusing the accumulated nonlinearity over a single fiber span Nspan(z). It is estimated by
dz z e
A z n c dz P z t q z
N zz
z
eff z
span
a a
) ( 0
2 0 0 0
2
) (
) ) (
, 0 ( )
(
³
J Z³
D , (2.18)where P0 is the output power of EDFAs, and za is the span length. Kerr coefficient n2, effective core area Aeff , and the fiber loss coefficient D differ according to characteristics of optical fibers.
For example, a two-section span configuration as shown in Fig. 2-4 is considered for the analysis. The accumulated nonlinearity Nspan(za) over the single span with a length of za is led to
°¿
°¾
½
°¯
°®
(1 ) ( )
)
( 21 2
2 1
1
1 2
22 1
21 0
0 z za
eff z
eff a
span e e
A e n
A n c z P
N D D D
D D
Z , (2.19)
where the suffixes 1 and 2 indicate the first and second section of the fiber coefficient n2, D , and Aeff , respectively.
The advantages of the two-section span configuration using the LCF followed by the NZ-DSF can be evaluated by Eq. (2.19), in comparison with the reversely allocated two-section span configuration where the NZ-DSF followed by the LCF. The accumulated nonlinearity of the former span configuration in Ref. [13] is 3.3x10⁻⁴ and smaller than that of the latter one by 1.1 dB. Figure 2-5 shows the accumulated nonlinearity Nspan along with the distance for the two span configurations: the LCF followed by the NZ-DSF and the NZ-DSF followed by the LCF. From this figure, it is found that the difference is developed in the first section of the span, which is the higher signal power portion.
Fig.2-5 Induced nonlinearities for two kinds of span configuration:
LCF+NZ-DSF and NZ-DSF+LCF.
2-3.2 Numerical method
Numerical analysis is the only way to solve the NLS equation in practical transmission systems, and it can involve any kinds of fibers and components. The numerical solution of the NLS equation is derived by using the split-step Fourier method. The method separates the effects of the dispersive terms in the frequency domain and those of the nonlinear terms in the time domain, and derives the analytical solution independently for a small incremental distance of
' z
in each domain.In simulations, the NLS equation describing the optical field propagation is solved by the split-step Fourier algorithm on an initial condition. As the initial condition, the data pattern sequence, the pulse shape, and the phase of the field should be defined.
0 10 20 30 40 50
0 2 x 10⁻⁴ 4 x 10⁻⁴ 6 x 10⁻⁴
Distance [km]
LCF + NZ-DSF NZ-DSF + LCF
Nspan
»»
¼ º
««
¬ ª
¸¸¹·
¨¨©§
m
t t t A iC
t q
2
2 0
) , 0 ( exp 1
,
0 , (2.20)
where A,C, t0, andmare the amplitude parameter, the chirp parameter, the initial pulse width, and the parameter controlling the degree of edge sharpness. For simulating optical amplified repeaters, the amplitude of optical signals is recovered to the level of the repeater output power at the location of the repeaters, and the optical noise generated by the amplifiers is superimposed to the signal.
2-3.3 Experimental method
The experiment using a straight transmission line configuration is inefficient for the optimization of the system performance at the research stage because it is difficult to change the system parameters of the transmission line frequently and flexibly. For such purposes, recirculating loop technique is used to investigate the performance of long-distance transmission systems [19].
Figure 2-6 shows a schematic diagram of the recirculating loop technique. The recirculating loop consists of a coupler to connect the loop with the transmitter and receiver sides, several spans of the transmission fiber followed by EDFAs, an optical switch for circulating the signal, and an EDFA for compensating for the additional loss of the coupler and the optical switch. At the transmitter side, an optical switch is employed for loading the signal into the loop. The timing states of optical switches and the gate at the receiver side is shown in Fig. 2-7. The timing operation of these two switches is synchronized each other; when the loading switch is closed for feeding the signal into the loop, the state of the circulating switch is closed. In contrast, when the loading switch is opened, the circulating switch is closed for circulating the loaded signals. The time to close the circulating switch corresponds to the target transmission distance, and during the last loop period, the signal forwarded to the receiver side is measured by gating it.
Fig. 2-6 Recirculating loop configuration.
2-3.4 Performance evaluation method
The transmission quality in digital transmission systems can be expressed by a BER.
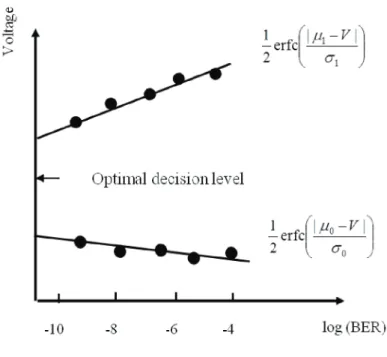
As commercial transmission systems operate with very low BERs, these are too small to be measured in experiments and estimated in numerical simulations. The practical method for measuring the transmission performances is to use the Q-factor, which is introduced for the purpose of calculating the BER performance [20].
Figure 2.8 illustrates a Q-factor measurement from obtained BERs by changing decision voltage levels.
Fig. 2-8 Q-factor measurement in experiments.
In experiments, the Q-factor is estimated by measuring the BER at different threshold settings in the decision circuit. The data are fitted with a curve, assuming Gaussian noise statistics of
»»
¼ º
««
¬
ª ¸¸¹·
¨¨©§
¸¸¹
¨¨© ·
§
0 0 1
1 | |
| erfc erfc |
2 ) 1
( V
P V
P V V
V
BER , (2.21)
where erfc(x) is expressed as
S D
D d e x
³
x f 2/22 ) 1 (
erfc . (2.22)
The equivalent values for the means
P
1,0 and standard deviationsV
1,0 of the voltages on the marks and spaces are given by the curve fit. The Q-factor is formed as0 1
0
1 |
|
V
V P
P
{Q . (2.23)
It is usually expressed in decibels as10log(Q2) and is translated to BER with the following formula,
¸¸¹·
¨¨©§
¸|
¹
¨ ·
©
§
exp 2 2 1 erfc 2
2
1 Q2
e BER Q
S . (2.24)
A BER of less than 10-9, which is the required quality of error-free transmission, is corresponding to a Q-factor of more than 15.6 dB.
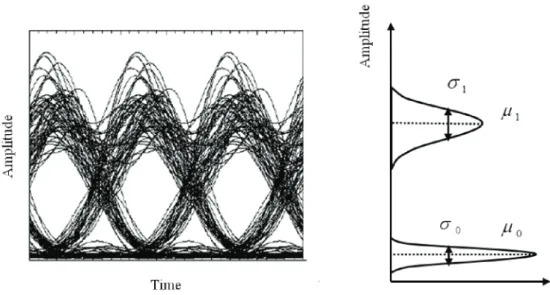
In simulations, Q-factor can be derived from an eye pattern diagram. Figure 2-9 shows the eye pattern generated by overlaying portions of a bit stream that have been delayed by an integer number of bit periods. A histogram is schematically shown to indicate the parameters used in defining the Q-factor. A long bit stream is necessary in the simulations enough to calculate accurate values of the means and standard deviations of the mark and space signals.
It is known that the Q-factor is associated with the SNR of the signals in the definition because |P1P0| and
V
1,0 in Eq. (2.23) indicate the signal and noise levels of mark and space signals, respectively. Considering an ideal situation where only accumulated noise impairs the performance, the Q-factor is described ase o
B B SNR Q SNR
4 1 1
2
. (2.25)
Fig. 2-9 Eye pattern obtained in a simulation and the corresponding histogram of the mark and space signals.
2-4 Conclusion
Fundamental concept of system design has been presented by using pulse propagation equation in optical fibers. Optical SNR, fiber dispersion, and nonlinearities are key technical features determining the transmission performance, and these parameters can be analytically designed with transmission loss compensation, dispersion management, and fiber nonlinearity mitigation, respectively.
As methods for designing systems, three approaches were studied: analytical, numerical, and experimental ones. In the analytical approach, it is effective to investigate transmission impairments independently, and the equation to estimate fiber nonlinearities of a two-section span configuration was analytically derived by focusing on the accumulated nonlinearity over a single fiber span. In addition, a preferable fiber allocation in the span was investigated by using an analytical formula in the case of two-section span configuration. Through these studies, the system design chart was introduced to alleviate fiber nonlinearities, and the results revealed that the nonlinearity
can be mitigated by properly allocated the two kinds of fibers.
Numerical and experimental approaches are necessary to evaluate the transmission performance including all the impairments precisely. Numerical simulations using the split-step Fourier method and transmission experiments using a recirculating loop were described, which are used in the following Chapters. The Q-factor, which is an important key index to express transmission performances, was also explained by associated with BER and SNR.
References
[1] E. Desurvire, “Erbium doped fiber amplifiers: principles and applications”, John Wiley and Sons, New York, 1994.
[2] D. Marcuse, A. R. Chraplyvy, and R. W. Tkach, “Effect of fiber nonlinearity on long distance transmission”, IEEE/OSA J. Lightwave Technol., vol. 9, pp.
121-128, 1991.
[3] D. Marcuse, “Single-channel operation in very long nonlinear fibers with optical amplifiers at zero dispersion”, IEEE/OSA J. Lightwave Technol., vol. 9, pp.
356-361, 1991.
[4] D. Marcuse, “Bit-error rate of lightwave systems at the zero-dispersion wavelength”, IEEE/OSA J. Lightwave Technol., vol. 9, pp. 1330-1334, 1991.
[5] D. Marcuse, “RMS width of pulses in nonlinear dispersion fibers”, IEEE/OSA J.
Lightwave Technol., vol. 10, pp. 17-21, 1992.
[6] G. P. Agrawal, “Nonlinear fiber optics”, California, USA: Academic Press, 1989.
[7] L. D. Garret, M. Eiselt, and R. Tkach, “Experimental comparison of WDM system capacity in conventional and non-zero dispersion shifted fiber”, OAA 1998, TuB2, 1998.
[8] Y. R. Shen and N. Bloembergen, “Theory of stimulated Brillouin and Raman scattering”, Phys. Rev. A, vol. 137, pp. 1787-1804, 1965.
[9] D. Cotter, “Fibre nonlinearities in optical communications”, Opt. and Quantum Electron., vol. 19, pp. 1-17, 1987.
[10] R. H. Stolen, “Nonlinear properties of optical fibers”, in Optical Fiber Telecommunications, Edited by S. E. Miller and A. G. Chynoweth, New York, USA: Academic Press, 1979.
[11] E. P. Ippen and R. H. Stolen, “Stimulated Brillouin scattering”, Appl. Phys. Lett., Vol. 21, pp. 539-541, 1972.
[12] D. Cotter, “Stimulated Brillouim scattering in monomode optical fibre”, J. Opt.
Commun., Vol. 4, pp. 10-19, 1983.
[13] M. Suzuki, H. Kidorf, N. Edagawa, H. Taga, N. Takeda, K. Imai, I. Morita, S.