An Entry of a British Overseas Bank into the
Eurodollar Market in the 1950s : The Case of
Bolsa
著者
Sugawara Ayumu
journal or
publication title
THE KEIZAI GAKU (Annual report of the Economic
Society, Tohoku University)
volume
76
number
1
page range
145-167
year
2017-08-31
The Keizai Gaku, Annual Report of the Economic Society, Tohoku University
Vol. 76 No. 1 March 2018
An Entry of a British Overseas Bank into
the Eurodollar Market in the 1950s :
The Case of Bolsa
†
Ayumu Sugawara
*Abstract
The presence of eurodollar markets is considered as one of the significant characteristics of the international financial system in the second half of the twentieth century. Historically, a variety of causes has been identified for the formation of the eurodollar market such as Soviet Union’s funds transfer. However, these factors do not explain why the eurodollar markets were concentrated in London. In this paper we have a perspective of eluci-dating the advantages of the international financial market in London and the banks there. Because in the City of London the Bank of London & South America (Bolsa) is regarded as a pioneer in the formation of eurodollar market as well as the Midland Bank, the subject of this paper is to elucidate the main causes of Bolsa’s early par-ticipation in the formation of eurodollar markets. The main conclusion of this paper is that the Bolsa’s London branch accepted eurodollars in order to supply funds in dollars to branches in Latin America and the USA. One unique characteristic of the case of Bolsa when compared with Midland Bank is the fact that the special factor responsible for Bolsa’s entry into the market was related to international finance with the American continents.
† The author would like to express gratitude to Ms. Sara Millard, the Archivist of the Bank of England and the Lloyds Banking Group and their staff members, Dr. John Booker (Former Archivist), Ms. Karen Sampson (the Archivist), and Ms. Silvia Gallotti, for giving permission to access to the records and for their advice and supports. This work was financially supported by JSPS KAKENHI Grant Number 16K03766.
* An Associate Professor at the Graduate School of Economics and Management, Tohoku University, Sendai, Japan. Email : [email protected]
1) From a wider perspective on British economic history, Cain and Hopkins emphasized the expansion of the euro-dollar market due to which London has been able to survive as a global financial centre. Cain and Hopkins, British
imperialism, pp. 292-3. On the decline of the pound, see the latest result, Schenk, The decline of sterling.
The presence of eurodollar markets is considered as one of the significant characteristics of the international financial system in the second half of the twentieth century. While early eurodollar markets emerged across Europe, the largest market was and has been in London. It is due to the establishment of the eurodollar market that London has been able to maintain its position as the leading international financial centre, ranking only with New York, despite the decline of the British pound as an
international currency.1)
including the actions of banks from the communist world, domestic interest-rate restrictions in the United States, and the United States international balance of payments deficit. However, these factors do not explain why the eurodollar markets were concentrated in London. Numerous reasons have been indicated for this concentration, such as the lack of government restrictions on acceptance of foreign
deposits and activities of merchant banks in London.2) These reasons have been stated from the
per-spective of elucidating the advantages of the international financial market in London as well as the banks in the City.
According to conventional wisdom and analyses focused on Britain, the first factor that was believed to have lead to the expansion of the eurodollar market in London was the prohibition by the British gov-ernment in 1957 of trade with other countries in pound sterling. A number of British banks responded
to this restriction by conducting eurodollar trade financing.3) Although this viewpoint has been
gener-ally accepted, for a long period, there were no attempts to elucidate the formation of the eurodollar mar-ket at the level of individual banks in London due to substantial limitations of available data.
However, Jones made it possible to study the actions of leading banks in the formation of the euro-dollar market in London from a new perspective by conducting advanced research on a previously
over-looked category ─ British overseas banks. Using data from individual British overseas banks, Jones
clarified one portion of eurodollar market formation from a historical research perspective.4) In his
study, he examined the role of the Bank of London & South America (Bolsa), which also is the subject of this paper, as a pioneer in the formation eurodollar market. The bank was established in 1923 with the merger of the London and River Plate Bank with the London and Brazilian Bank. It was a British over-seas bank whose main line of business was the financing of trade between Britain and Latin America. In
1936, Bolsa absorbed the Anglo-South American Bank, thereby making it the only British overseas bank
in Latin America.5)
According to Jones, the main reason for Bolsa’s early entry into the eurodollar market was that the bank faced a competitive disadvantage of being dependent on the pound sterling, particularly in Latin America where most trade and investment was conducted in U.S. dollars and American banks were
rather active.6) However, Jones considered Sir George Bolton, the erstwhile executive director of the
Bank of England who became the chairman of Bolsa in 1957, as the engine of change towards the
exten-sive use of the U.S. dollar.7) Prior to becoming the chairman of Bolsa, Bolton was a foreign exchange
dealer in the 1920s and an officer in charge of foreign exchange in the Bank of England after the 1930s.
2) Recent reviews of past explanations of eurodollar market formation are found in Schenk, ‘The origins of the eurodollar market’, pp. 223-34 ; Burn, ‘The state, the City and the euromarkets’, pp. 229-31 ; Battilossi,
‘Introduction’, pp. 10-11 ; Schenk, ‘Crisis and opportunity’, pp. 207-10 ; Baker and Collins, ‘London as an
international banking centre’, p. 256 ; Toniolo, Central banking cooperation, pp. 452-5.
3) Clendenning, The euro-dollar market, p. 23.
4) Jones, ‘Competitive advantages’ ; idem, British multinational banking. 5) Joslin, A century of banking ; Holley, ‘Bolsa under Sir George Bolton’.
6) Jones, ‘Competitive advantages’, pp. 51-2 ; idem, British multinational banking, p. 264.
He expected that the international use of sterling would virtually cease ; however, London had the
unique competitive advantage of having an agglomeration of worldwide financial services.8) Bolton
established a new foreign exchange department in Bolsa with instruction for dealers to seek deposits in
foreign currencies in order to facilitate transactions in Latin America and Europe.9)
Then, Schenk also conducted a study on the process of the formation of the London eurodollar mar-ket, thereby increasing the level of research on this subject. Schenk clarified the shares of eurodollar
deposits by bank category during the eurodollar market’s formative period 1962-3, which was previously
unclear. Her study revealed that the share of eurodollar deposits in British overseas banks was largely the same as those of merchant banks and the London branches of American banks, which had already
been established as powerful players in eurodollar market formation.10) Subsequently, Battilossi
extended Schenk’s findings and clarified the shares of various categories of banks in eurodollar deposits
dating back to 1958.11)
Further, Schenk revealed that the eurodollar market was not formed in 1957, as previously believed, but in 1955 ; the first market participant was Midland Bank. Midland Bank began accepting eurodollar deposits in order to respond to a situation in which there was a decrease in the amounts of deposits at clearing banks for the first time since the Second World War. This was because funds were transferred from bank deposits to British treasury bills due to an increase in the interest rate on treasuries at the end
of February 1955.12) Thus, Schenk’s approach provided a direction for explaining the formation of the
eurodollar market through empirical and, in particular, quantitative information of the business require-ments of individual banks at the time.
In light of the above discussion, the subject of this paper is to elucidate the main causes of Bolsa’s early participation in the formation of eurodollar markets, with a particular focus on Jones’ findings. His findings can be said to have provided an indication of important facts. In particular, very little quantita-tive information is provided on Bolsa’s eurodollar business and eurodollar market conditions. Thus, Bolsa’s financial documents stored in Lloyds Banking Group Archives have been used. As done by Schenk, we explore the formation of the eurodollar market by focusing on the business necessities of individual banks.
In order to conduct this study from an analytical perspective, we utilise the bank internal funds
cir-culation approach given by Nishimura in his research on HSBC.13) In his study, Nishimura clarified the
roles of each branch of HSBC in 1913 by reconstructing branch balance sheets and indicating their finan-cial surpluses or deficits.
The period under study in this paper is 1957-63. The reason that this period is considered is,
8) Ibid., pp. 264-5.
9) Ibid., p. 325 ; Fry, A banker’s world, p. 32.
10) Schenk, ‘The origins of the eurodollar market’, p. 230. 11) Battilossi, ‘Banking with multinationals’, p. 106, tab. 5.1.
12) Schenk, ‘The origins of the eurodollar market’, pp. 224-9 ; Economist, 19 Feb. 1955, p. 666, 26 Feb. 1955, p. 758,
and 5 March 1955, p. 846. 13) Nishimura, ‘The flow of funds’.
firstly, because information on Bolsa’s eurodollar business can be found in the bank’s financial records for this period. Secondly, it was in 1957 that the British government prohibited trade financing in pound sterling between countries other than Britain. Prior to Schenk’s study, the eurodollar market was con-sidered to have been established in 1957. The impact of the prohibition is significant from the viewpoint of international finance, particularly with regard to the substitution of sterling with dollar. Finally, in 1963 a number of major changes took place in the banking industry : an increase in the maximum inter-est rate permitted under Regulation Q, the announcement of eurocurrency market statistics by the Bank for International Settlements, the collapse of certain firms that participated in eurodollar markets, and the appearance of the eurobond market.
The remainder of this paper is organized in the following manner : In Section I, we identify the size
of the eurodollar market 1957-63, scale of eurodollar deposits according to bank category, and scale of
Bolsa eurodollar deposits. In Section II, we present a quantitative description of the impact of Bolsa’s participation in eurodollar markets on Bolsa’s management structure. In Section III, we describe the content of the eurodollar business of Bolsa’s London branch. In Section IV, we analyse the main causes that led to Bolsa’s early participation in the eurodollar market. In Section V, the conclusion, we indicate the relationship between the results of the analysis in this paper and the findings of Schenk’s study. I
In 1964, the Bank of England began preparing statistics on the size of the London eurodollar
market.14) This clarified the scale of the foreign currency liabilities of banks in London at the end of
1957 and later. These data are depicted in figure 1, which reveals that banks in London carry foreign currency liabilities of approximately £71 million at the starting point. According to the Bank of England,
in around 1955, the foreign currency liabilities of London banks were approximately £50 million.15) This
figure reached approximately £1.75 billion by the end of 1964, as the eurodollar markets grew rapidly.16)
Figure 2 illustrates the trends in the amount of foreign currency deposits at Bolsa’s London branch. It is believed that in 1957 the London branch held foreign currency deposits amounting to approximately
$2-3 million.17) Thereafter, foreign currency deposits continued to grow rapidly, rising from $3.7
mil-lion in September 1957 to $106.2 milmil-lion in December 1958, $190.9 milmil-lion in December 1959, $281.7 million in December 1960, $351 million in December 1961, and $444.7 million in December
1962. How-14) The statistics in figure 1 are overestimated as compared with statistics for subsequent years, such as the figures cited in table 2. However, the author uses the older estimation because of consistency with the data prepared by Bolsa’s staff in the bank’s documents.
15) Bank of England, ‘U.K. bank’s external liabilities’, p. 101.
16) The eurodollar market constituted a part of the Eurocurrency markets. Hereafter, in this paper, we will limit our discussion to the eurodollar market. Moreover, we will use the term eurodollar market in cases that, strictly speaking, should be referred to as eurocurrency markets. Separate study is required to identify the causes of growth in non-dollar eurocurrency markets.
ever, in December 1963, the value of these deposits fell year on year to $420.8 million, and were at $471.7 million in December 1964. The data for March 1961 and a separation of dollar deposits from those in other currencies indicate that approximately 80 per cent of the London branch’s foreign currency deposits were dollar deposits.
However, the question that remains is what was the share of the London branch’s foreign currency deposits in the entire London foreign currency deposit market? Table 1 presents Bolsa’s share in the London foreign currency deposit market from a comparison of figures 1 and 2. It is evident from table 1 that Bolsa’s shares in 1958 and 1959 are exceptional. In subsequent years as well, Bolsa continued to
Figure 1. Size of the London eurocurrency market (US$ million)
Notes :
a The graph presented above uses the amount of foreign liabilities of banks in the U.K. denominated in foreign
currency.
b The figures are for December of each year.
Source : ‘U.K. banks’ external liabilities’, p. 100.
Figure 2. Eurocurrency deposits in Bolsa’s London Branch (US$ million)
Notes :
a Data distinguishing US$ and other currencies are available only from 1961. b The figures in the graph are for Dec. of each year.
maintain a fairly large share of foreign currency deposits for a single bank─ at 15 per cent or more in
1960-2 and 11 per cent in 1963.18) Thus, Bolsa came to be considered a leading bank in the eurodollar
market, which is evident from table 1.
Table 2 presents information on the proportion of foreign currency deposits of banks in various
categories for the period 1957-63. Ranked by bank category, in 1958, British overseas banks had the
highest share, followed by British clearing banks. In 1959, foreign banks other than U.S. and Japanese banks slightly exceeded the share of British overseas banks, which continued to maintain a 25 per cent
18) The estimation of Bolsa’s staff of the bank’s shares in the London Eurocurrency markets were 15.5% in Dec. 1962, 12.2% in Dec. 1963, and 10.3% in Sept. 1964. ‘London branch U.S. dollar deposits’, Jan. 1965, LA, F2/D/ Rep. 8.
Table 1. Bolsa’s share in the British eurocurrency deposit market
Year Entire British bankingsector (US$ million) deposits (US$ million)Bolsa’s eurocurrency Bolsa’s share
1957 198.8 10.6 5.3% 1958 358.4 106.2 29.6% 1959 756.0 190.9 25.3% 1960 1,792.0 281.7 15.7% 1961 2,111.2 351.0 16.6% 1962 2,906.4 444.7 15.3% 1963 3,584.0 420.8 11.7% Sources :
1) For Entire British banking sector, ‘U.K. banks’ external liabilities’, p. 100.
2) For Bolsa’s eurocurrency deposits, ‘London branch U.S. dollar de-posits’, Jan. 1965, LA, F2/D/Rep.8.
Table 2. Shares of eurocurrency deposits of banks in Britain (%)
1958 1959 1960 1961 1962 1963
Clearing banks 22.5 14.3 11.1 6.6 4.5 5.1
Other British banks 1.0 1.3 1.5 1.1 2.6 2.1 British overseas banks 33.3 25.0 18.9 20.8 23.0 22.2
Accepting houses 10.8 10.7 11.8 16.1 18.6 17.1
U.S. banks 16.6 22.3 39.1 35.9 27.0 32.3
Japanese banks 0.9 6.0 7.3 10.8 9.8
Other foreign banks 15.8 25.5 11.3 12.2 13.5 11.5
Total amount (£ million) 116 255 596 707 1,027 1,147
Notes :
a All figures are for Dec. of each year, except those for 1963, which are for April. b The figures for 1958 to 1960 are eurodollar deposits only
Sources :
1) For 1958 to 1962, Battilossi, ‘Banking with multinational’, p. 106, tab. 5.1. 2) For 1963, Schenk, ‘The origins of the eurodollar market’, p. 230.
share. After 1959, British overseas banks were surpassed by U.S. banks but retained the second place, followed by accepting houses and other foreign banks. However, as seen above, Bolsa held a large amount of foreign currency deposits independently ; Bolsa’s share of foreign currency deposits among
British overseas banks was 80 per cent in 1961, 67 per cent in 1962, and 53 per cent in 1963.19) For this
reason, it may be stated that the reference to British overseas banks in the context of the foreign
currency deposit market is largely the same as referring to Bolsa.20)
However, Bolsa was a relatively small bank as compared to other British overseas banks. In 1955,
Bolsa’s rank among British overseas banks in terms of balance-sheet size had fallen to seventh place
from fourth place in 1948. While the total assets of other British overseas banks increased, those of Bolsa decreased. From the end of the 1940s to the first half of the 1950s, Bolsa had faced tough
conditions in Latin America.21) Bolsa’s amount of deposits fell in 1954 and then remained stagnant until
1957.22) However, these deposits began to increase in 1958, and by 1964, the bank was ranked sixth in
terms of total assets. Despite the fact that it was small in comparison to other leading overseas banks such as HSBC and the Chartered Bank, Bolsa became a key player in the initial eurodollar market. Banks that were also regarded by contemporaries as important players in the eurodollar market in its formative years included Schroder, Kleinwort Benson, Brown Shipley (merchant banks), Société
Générale (French bank), and ANZ (British overseas bank).23) In addition, Hambros which was also
merchant bank began releasing its amount of foreign currency deposits in 1955.24) From the above
discussion, it is evident that it is appropriate to focus on Bolsa when attempting to clarify the process of formation of the eurodollar market in London.
II
The acceptance of large amounts of eurodollar deposits had a significant impact on Bolsa’s business conditions. Figure 3 presents the trends in the foreign currency and total amount of deposits at the London branch. What is most apparent from figure 3 is the fact that foreign currency deposits had come
19) This has been estimated using the following procedure : For estimating the size of eurocurrency deposits in British overseas banks, use the data presented in figure 1 as the total amount of eurocurrency deposits in London and the data presented in table 2 as the shares of different banks in London. Then, the sizes of the eurocurrency markets are multiplied by the eurocurrency shares of British overseas banks in each year in the period 1958-60.
However, this procedure is not appropriate because the data presented in table 2 for the period only deals with eurodollar deposits, while the data on Bolsa’s foreign currency deposits that is prepared by the bank’s staff only indicates the total eurocurrency deposits before 1961, as is shown in figure 2.
20) Schenk noted that in 1962 Bolsa had approximately 40% share in Eurocurrency deposits of British overseas banks. Schenk, ‘The origins of the eurodollar market’, p. 231.
21) Jones told ‘by 1949 Bolsa’s ability to raise deposits in many Latin American countries was strictly limited’. Jones, ‘Competitive advantages’, p. 51.
22) Jones, British multinational banking, app. 5.
23) ‘The eurodollar market’, 16 March 1962, LA, F2/D/Rep. 8. 24) Altman, ‘Recent developments in foreign markets’, p. 69.
to account for the bulk of deposits at the London branch. The fact that most of the deposits at the London branch during this period were foreign currency deposits indicates that the rapid increase in foreign currency deposits itself represented a rapid increase in the overall deposits at Bolsa’s London branch.
In this section, we identify the changes in Bolsa before and after the formation of the eurodollar market by comparing data for the years 1955, 1960, and 1963. Table 3 presents Bolsa’s total deposits in branches of various countries in 1955 : deposits in the London branch totalled £11.18 million, or 13.5 per cent of the total ; deposits in the Spain branch were at £17.32 million (20.9 per cent), those in the U.S. branch were at £13.54 million (16.3 per cent), and those in the Brazil branch totalled £10.2 million (14.2 per cent). Thus, it is evident that the deposits in the London branch were the smallest among the worldwide branches of Bolsa in 1955.
This country-wise distribution of deposits fluctuated considerably from 1955 to 1960. In 1960, the
amount of deposits in the London branch increased to £90.31 million, or 45.1 per cent of the total, making it the central source of funds for Bolsa. The rapid increase in deposits at the London branch was extraordinary even in the context of Bolsa. After the London branch came the Argentina branch at £26.99 million (13.5 per cent) and the U.S. branch at £14 million (7.0 per cent). Subsequently, the share of the London branch experienced further rapid growth, with its deposits totalling £242.39 million (74.3 per cent) in 1963. Thus, it is evident that it was the London branch that accepted most of Bolsa’s deposits. The rapid growth in eurodollar deposits at the London branch established the branch’s centrality among branches within Bolsa as a whole. However, the London branch became the central
source of funds for Bolsa much later than the London branches of other British overseas banks.25)
25) Nishimura, ‘The flow of funds’, pp. 42-3, tab. 2.8. In 1913, the London branch of HSBC had the largest balance Figure 3. London branch deposits (£ million)
Note :
The figures in the graph are for June of each year. Sources :
1) Total amounts were prepared from ‘Summary balance sheets’, each year, LA, F2/CA/Acc.2.
The fact that the London branch had become a central source of funds for Bolsa may be confirmed from other indicators as well. Firstly, examining the size of the balance sheets indicates that at the
London branch this figure increased 12.4 times from £11.07 million in 1955 to £136.98 million in 1960.26)
While the deposits in the London branch increased 8.1 times 1955-60, its balance sheet grew at a faster
pace. Moreover, the London branch’s share in the size of the balance sheet of Bolsa as a whole
underwent a remarkable transformation from 7.9 per cent in 1955 to 55.8 per cent in 1960.27) In 1963,
the size of the balance sheet of Bolsa’s London branch was £162.67, accounting for a share of 41.9 per cent of the entire bank’s balance sheet. Thus, it is evident that the share of the London branch had fallen over a period of three years. However, in 1963, the size of the head office balance sheet was
£14.09 million from £12.95 million in 1960 and £17.97 million in 1955 ;28) the head office was also located
in London.29)
This growth in the size of the London branch’s balance sheet is a clear indicator of the shift in the centre of Bolsa’s business to the London branch. It must be noted that if only the deposits of the London branch had increased, it would have indicated that the branch has merely collected funding, with the funds perhaps destined for overseas branches ; however, the growth in assets at the London branch indicates that the collected funds were utilized in London as well. A detailed discussion of the use of these funds will be conducted at a later stage in the paper.
sheet size and was the largest fund supplier to other branches although financial data on the bank’s Hong Kong head office is not available.
26) ‘Summary balance sheets’, Dec. 1955 and Dec. 1960, LA, F2/CA/Acc.2. 27) Ibid.
28) ‘Summary balance sheets’, June 1963, LA, F2/CA/Acc.2.
29) ‘Summary balance sheets’, Dec. 1955 and Dec. 1960, LA, F2/CA/Acc.2.
Table 3. Bolsa’s deposits by country (top five)
1955 £ million Percentage 1960 £ million Percentage
Spain 17.3 20.9% U.K. 90.8 45.4% U.S. 13.5 16.3% Argentina 26.9 13.5% U.K. 11.7 14.2% U.S. 14.0 7.0% Brazil 10.2 12.3% Brazil 7.9 4.0% Guatemala 5.3 6.4% Spain 6.8 3.4% 1963 £ million Percentage U.K. 242.9 74.5% U.S. 25.8 7.9% Argentina 23.2 7.1% Spain 8.6 2.7% Brazil 8.3 2.6%
Further, the growth in the size of the balance sheet of the London branch also markedly increased the weight of the London branch in the bank’s profits. As is evident from table 4, the London branch’s profits in 1955 were £196,000, or 15.6 per cent of the overall bank profits ; this figure increased to £684,000, or 29.5 per cent of the overall bank profits, in 1960. Although the pace of growth in the profits of the London branch was slower than that of the growth in its balance sheet, in 1963 the branch’s profits amounted to £1.771 million, or 53.8 per cent of the overall bank profits. Thus, the contribution of the London branch to overall business for Bolsa was significant in the period under consideration. III
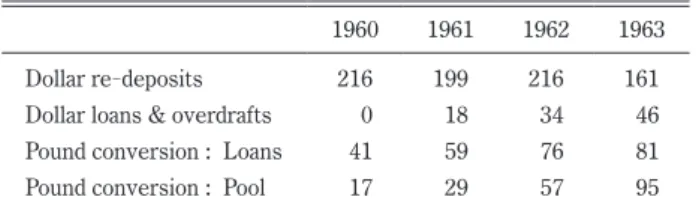
Table 5 presents the state of the use of dollar deposits at Bolsa’s London branch 1960-4. The use
of dollar deposits was roughly divided into dollar re-deposits, dollar loans and overdrafts, and term
lending or pool funding after conversion to pound sterling.30)
What is most evident in table 5 is the fact that throughout this period the re-depositing of
unconverted dollars was the most common use of dollar deposits. However, this share displayed a decreasing trend, falling from approximately 80 per cent in 1960 to 53 per cent in 1963. However, in
1964, the share of dollar re-deposits rose slightly to 64 per cent.
Table 6 presents a breakdown of dollar re-deposits at the London branch 1960-3. As is evident
from this table, dollar re-deposits included those monies that were re-deposited with other banks as well
as those re-deposited with other Bolsa branches ; the re-deposits with other banks accounted for the
bulk of dollar re-deposits.
30) ‘London branch utilisation of U.S. dollar deposits’, 11 Jan. 1965, LA, F2/D/Rep. 8.
Table 4. Bolsa’s profits by country (top five)
1955 £ thousand Percentage 1960 £ thousand Percentage
U.S. 215 17.1% Argentina 698 30.1% U.K. 201 16.0% U.K. 696 30.0% Argentina 193 15.3% U.S. 519 22.4% Chile 174 13.8% Brazil 262 11.3% Spain 114 9.0% Spain 172 7.4% 1963 £ thousand Percentage U.K. 1,811 55.0% Argentina 744 22.6% U.S. 436 13.2% Brazil 378 11.5% Chile 198 6.0%
Sources : ‘Summary profit & loss ledgers’, Dec. 1955, Dec. 1960, and Dec. 1963, LA, F2/ CA/Acc.2.
Table 5. Uses of dollar deposits at the London branch (£ million)
1960 1961 1962 1963
Dollar re-deposits 216 199 216 161
Dollar loans & overdrafts 0 18 34 46 Pound conversion : Loans 41 59 76 81 Pound conversion : Pool 17 29 57 95 Source : ‘London branch utilisation of U.S. dollar deposits’,
11 January 1965, LA, F2/D/Rep.8.
Table 6. Dollar re-deposits by the London branch : Top ten countries and Bolsa branches (£ million)
1960 1961 Japan 49.5 Japan 55.5 U.K. 31.5 Eurobank 19.5 MNB 24.5 MNB 15.2 Eurobank 22.5 U.S. 14.5 U.S. 16.0 Belgium 1.3 France 16.0 Germany 12.8 Italy 12.0 U.K. 10.2 Canada 11.5 Canada 10.0 Germany 5.4 Hungary 6.0 Belgium 5.2 Finland 5.2
BOLSA branches 12.4 Bolsa branches 14.7
1962 1963 Italy 34.4 Italy 43.5 France 29.9 Japan 32.5 U.K. 29.2 Eurobank 24.5 Japan 27.0 U.K. 10.5 Eurobank 23.5 Finland 6.2 MNB 11.7 Germany 4.9 Finland 15.2 France 3.7 Germany 6.8 MNB 3.5 Norway 4.2 U.S. 3.0 Canada 4.0 Hungary 2.0
Bolsa branches 12.9 Bolsa branches 13.1
Notes :
a MNB is the acronym for the Moscow Narodny Bank of Soviet Union. b Eurobank represents the Banque Commerciale pour l’Europe of
So-viet Union.
Source : ‘London branch re-deposits of U.S. dollars’, 11 January 1965,
It must be noted that these interbank re-deposits were a central business in the eurodollar market
as a whole. Each bank that accepted eurodollars secured its interest-rate margin by re-depositing them
with other banks, and this resulted in a steady expansion of deposits. However, the interest-rate
margins were rather small, ranging from 1/8 to 1/32 of a point.31) Even at Bolsa, such dollar re-deposits
constituted the centre of the eurodollar business.
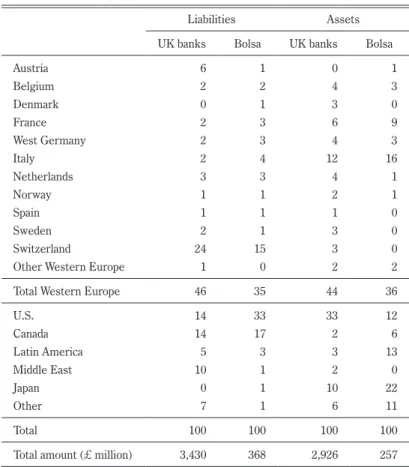
Next, in table 7 we provide a comparison of the geographical distribution of dollar re-deposits for
Bolsa and other banks in London as a whole. The distribution could be compared using detailed
categories for 1964 only. The aspect that greatly differentiated the destinations of dollar re-deposits
between British banks as a whole and Bolsa was the fact that the weight of Latin America was 3 per cent for British banks as a whole and 13 per cent for Bolsa. However, some of these dollars were distributed through deposits with banks of respective countries that were located in London, while others were distributed through deposits with banks located in their home countries.
Further, dollar deposits with other branches, as is evident from table 8, provide a clear picture of Bolsa’s business interests outside London. Branches that accepted dollar deposits from London were the New York, Brazilian, Paris, and Buenos Aires branches. The scale of these deposits was largest at New York, where it ranged from $6 million to $11 million, followed by Brazil where it ranged from $1 million to $7.38 million in the period from 1960 to 1964. Further, dollar deposits were placed with the Paris branch from December 1960 to December 1961 and ranged from $900,000 to $9.82 million, and in the Buenos Aires branch from May to December 1962 and ranged from $500,000 to $1.65 million. These deposits may be considered to represent the distribution of funds to branches that required dollars. The New York branch used these dollar deposits for daily business operations and to comply with U.S. cash reserve ratio regulations. The Brazilian branches used its dollar deposits to conduct swap transactions in order to obtain the then local currency, cruzeiro. Moreover, the Paris branch used
its dollar deposits to obtain francs through swap transactions as well as to advance loans in dollars.32)
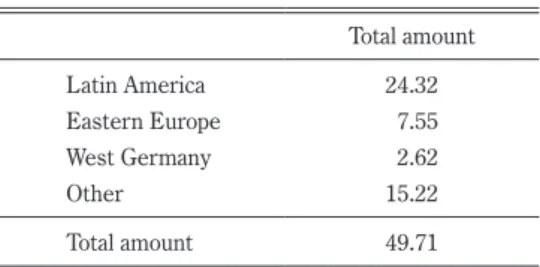
Further, dollar loans and overdrafts by the London branch also indicate the characteristics of Bolsa’s business transactions. Table 9 presents the following distribution of dollar loans and overdrafts : Latin America accounted for 48.9 per cent at $24.32 million of the total amount of $49.71 million, while Eastern Europe accounted for 15 per cent at $7.55 million, and West Germany accounted for 5 per cent at $2.62 million.
The purposes of the loans and overdrafts to Latin America were to support Bolsa subsidiaries and
provide customers with services that could not be handled at branches.33) The recipients of Bolsa’s
dollar loans and overdrafts included subsidiaries Compania Financiera de Londres and Balfor Williamson, while customer recipients included Bonge & Born, SIAM Di Tilla, Industrias Kaiser Argentina, Banco de
A. Edwards, and Corporation Argentina de Productores de Carnes.34) Compania Financiera de Londres
was a subsidiary of Bolsa that was established in 1961 for the purpose of industrial finance. It was
31) Altman, ‘Recent developments in foreign markets’, p. 28. 32) ‘London branch U.S. dollar deposits’, 21 Dec. 1961, LA, F2/D. 33) ‘London branch U.S. dollar deposits’, 17 Dec. 1963, LA, F2/D. 34) Ibid.
owned by an Argentine board of directors and managed by staffs of Bolsa branches in Argentina as well.35)
Balfor Williamson was a British merchant bank bought in 1960 by Bolsa. It was active mainly in Chile,
Peru, Ecuador, Colombia, U.S. West Coast, and the Pacific Rim.36)
Overdrafts to Eastern Europe were allocated to finance the imports of Eastern European nations from Latin America, while negotiation of bills was allocated to finance exports from Eastern Europe to
Latin America. Usance bills were valid for no more than six months.37) The provision of these loans
and overdrafts brought foreign exchange business to Bolsa’s London and Latin American branches.
35) Joslin, A century of banking, p. 290. 36) Ibid.
37) ‘London branch U.S. dollar deposits’, 17 Dec. 1963, LA, F2/D.
Table 7. US$ foreign assets & liabilities of UK banks and Bolsa (1964) (%)
Liabilities Assets
UK banks Bolsa UK banks Bolsa
Austria 6 1 0 1 Belgium 2 2 4 3 Denmark 0 1 3 0 France 2 3 6 9 West Germany 2 3 4 3 Italy 2 4 12 16 Netherlands 3 3 4 1 Norway 1 1 2 1 Spain 1 1 1 0 Sweden 2 1 3 0 Switzerland 24 15 3 0
Other Western Europe 1 0 2 2
Total Western Europe 46 35 44 36
U.S. 14 33 33 12 Canada 14 17 2 6 Latin America 5 3 3 13 Middle East 10 1 2 0 Japan 0 1 10 22 Other 7 1 6 11 Total 100 100 100 100
Total amount (£ million) 3,430 368 2,926 257
Note :
The figures presented in the table are as of 30 June 1964 for banks in the U.K. and 13 November 1964 for Bolsa.
Source : ‘External liabilities and assets in U.S. dollars of Bolsa, London branch, as compared with of all U.K. banks’, Bank of England Archives, C48/156.
Moreover, while the share of loans to West Germany was small, numerous loans were advanced to West Germany in currencies other than the dollar as well as combined dollar and other currencies loans ; the
total loan amount was $7.6 million.38) Currencies included under ‘other’ are those of Britain, Austria,
Japan, Luxembourg, and Yugoslavia.39)
With regard to the criteria applied to identify borrowers other than Bolsa subsidiaries and key
38) Ibid. 39) Ibid.
Table 8. London branch’s US$ deposits at other branches (£ thousand)
New York Brazil Paris Buenos Aires
June 1960 8,000 1,300 Dec. 1960 8,000 3,800 2,600 March 1961 8,000 5,500 2,000 July 1961 8,000 5,000 9,820 Oct. 1961 11,000 5,300 1,800 Dec. 1961 11,000 2,800 9,000 Feb. 1961 9,000 1,000 May 1961 9,000 1,650 500 Aug. 1961 9,000 1,900 500 Oct. 1961 9,000 2,400 1,650 Dec. 1961 9,000 2,300 1,650 March 1963 9,000 6,640 650 June 1963 9,000 7,380 Aug. 1963 9,000 3,640 Nov. 1963 9,000 3,300 Dec. 1963 9,100 4,050
Source : ‘London branch re-deposits of U.S. dollars’, 11 January 1965, LA, F2/D/
Rep.8.
Table 9. Dollar loans and overdrafts given by the London branch (Nov. 1963) (US$ million)
Total amount Latin America 24.32 Eastern Europe 7.55 West Germany 2.62 Other 15.22 Total amount 49.71
Source : ‘London branch re-deposits of U.S.
customers, borrowers with top international creditworthiness or those who were able to obtain equivalent guarantees, and either affiliates of companies from hard currency countries such as U.S., Japan, Australia, Britain, and Europe or those with dollar revenues were eligible for receiving loans and overdrafts.40)
Part of Bolsa’s London branch dollar deposits was converted to pound sterling and then transferred to term loans and London branch pool funds. The percentage of total dollar deposits accounted for by term loans in pounds increased in importance from approximately 15 per cent in 1960 to range from
11-20 per cent in 1961, 18-24 per cent in 1962, and 21-25 per cent in 1963. Thereafter, there was a
slight decline in 1964 to the range of 15-20 per cent. A breakdown of term-loan borrowers reveals that
in October 1962 loans to banks and other financial institutions totalled £16.05 million while those to British local governments amounted to £7.25 million ; in November 1963 the former category totalled £18.12 million and the latter £11.95 million, and in November 1964 the former was £9.42 million and the
latter £13.4 million.41)
The borrowings by British local governments were an important structural element of the formative period of the eurodollar market. Eurodollar borrowing by the local governments began in September 1955 because in that year the British government, for financial reasons, prohibited local governments from borrowing from the Public Works Loan Board. This resulted in local governments borrowing large
amounts of short-term funds.42) Like other banks, Bolsa was also committed to this important business
in the eurodollar market.
The factors responsible for the formation of the eurodollar market in London may be viewed in light
of this demand for borrowing by local governments.43) However, since the move toward intake of large
amount of eurodollars converted to domestic currency as a result of domestic financial conditions was a phenomenon that actually was seen in other countries such as Italy, Japan, and the U.S., there is a room for further study to determine whether this point can be considered a key factor behind London becom-ing a leadbecom-ing eurodollar market.
Next, an examination of the pool funds of the London branch reveals that these funds were diverted towards purchase of current assets by the branch. Specifically, these current assets include brokers’
loans as well as treasuries, other gilt-edged securities, and short-term trade bills.44)
The above discussion reveals that in the London branch’s eurodollar business, dollar re-deposits to
other banks and pound term loans represented participation in important areas of the eurodollar market. Although such activities were undertaken in other banks as well, Bolsa’s unique contribution is indicated
in its use of dollar deposits for re-deposits in its branches as well as for loans, overdrafts, and negotiation
of bills to Latin America and Europe.
40) Ibid.
41) ‘London branch U.S. dollar deposits’, 11 Jan. 1965, LA. 42) Schenk, ‘The origins of eurodollar market’, p. 228.
43) Grant, The machinery of finance, p. 140 ; Schenk, ‘The origins of the eurodollar market’, p. 228. 44) ‘London branch U.S. dollar deposits’, 11 Jan. 1965, LA.
IV
Through the eurodollar business, Bolsa increased both its size and profits. In order to consider the reasons for Bolsa’s early entry into the eurodollar market, the following four factors are taken into
consideration : Dollar deposits from the London branch to other branches, inter-branch balances,
com-ments of the bank chairman in 1958, and Latin American external finance. The former two factors are elucidated in the first portion of this section and the latter two facts are considered in the second portion.
In this regard, the following hypothesis is proposed to explain the reasons for Bolsa’s early entry into the eurodollar market : Bolsa’s London branch first began accepting dollar deposits in order to ena-ble its Latin American branches to deal with shortage of funds. This was because the dollar was con-vertible into Latin American local currencies and was used in the United States.
Firstly, we consider the relationship between the London branch’s dollar deposits and Bolsa’s
inter-nal flow of funds for the period 1960-3, for which information on dollar deposits from the London branch
to other branches is available. The dollar deposits supplied from the London branch to other branches
in the end of each year are presented in table 10, which has been created using table 8. We inter-relate
the dollar flows and total flow of funds in Bolsa. An examination of the inter-branch balances reveals
Bolsa’s internal flow of funds, which are presented in table 11 that has been created from information
presented in the appendix. In this table, we use balances by country, and add inter-branch balances for
each country. The negative values in table 11 and the appendix are for countries that were recipients of funding, while the other values are for countries that provided funding. It is evident from table 11 and the appendix, that the U.S., Brazil, and the London head office were recipients of large amounts of funds, while the London branch was the greatest fund provider. However, since the head office was located in the same building as the London branch and accepted funds as administrative charges, it was considered
a non-business-performing division. Consequently, the U.S., Brazil, and occasionally French branches
accepted funds to conduct their business. These findings are in agreement with the providers and recipients of dollar funds that have been mentioned in the available bank data. Now, we compare the figures for each country by comparing tables 10 and 11.
Although Argentina received dollar deposits in 1962 only, this is unrelated to an excess or shortage of funds in the country. During this period, Argentina was a provider of funding. On the other hand, Brazil was a recipient of funds in every year except 1962. In 1962, when it was a provider of funds, the
Table 10. Dollar re-deposits of the London branch (Dec. of each year) (£ thousand) 1960 1961 1962 1963 Argentina 0 0 589 0 Brazil 1,357 1,000 821 1,446 U.S. 2,143 3,928 3,214 3,247 France 928 321 0 0 Source : Tab. 8
amount of dollar deposits was low in the country. Throughout this entire period, the U.S. was a receiver of funds as well as a receiver of dollar deposits. France was a receiver of funds in 1960 and 1961 and a fund provider thereafter. Moreover, even in terms of dollar deposits it was a fund receiver in 1960 and 1961 but did not receive any funds in subsequent years. Further, London was a provider of funds throughout the entire period. Thus, it is evident from these findings that while there was no apparent relationship apparent between dollar deposits and balance by country in the case of Argentina, both these aspects were closely related in Brazil, the U.S., France, and London.
Next, we compare the amounts of funds supplied or received with the amounts of dollar deposits in Brazil, the U.S., and France. The results are presented in table 12. It is evident from the table that the bulk of funding shortages in each country was covered by dollar deposits from London. The ratio of coverage by dollar deposits exceeded 100 per cent in certain cases because the figures for balance by country are net figures. Ordinarily, gross amounts received would be expected to be larger than net amounts.
Further, additional manipulation of the figures was conducted in order to derive the weight of dollar deposits as a part of the total amount of funds supplied by the London branch. It supplied enormous amounts of funds, ranging from £8.3 million to £89.7 million. However, at the same time, the head office also received enormous amounts of funds, ranging from £3.2 million to £82.5 million. Firstly, we assumed that the entire amount of funds received by the head office came from the London branch. Then, assuming that the funds were received in pounds since the head office is also located in London we subtracted the amount received by the head office from the amount supplied by the London branch. The
Table 11. BOLSA’s inter-branch accounts by selected countries (£ thousand) 1960 1961 1962 1963 Argentina 10 140 800 1,200 Brazil −2,800 −1,100 70 −700 U.S. −1,600 −5,100 −7,100 −6,500 France −1,000 −200 40 20,000 London 18,100 8,300 35,700 89,700
Head office (in London) −13,200 −3,200 −28,600 −82,500 Source : Appendix
Table 12. Percentage of dollar re-deposits in total balance sheets
1960 1961 1962 1963
Brazil 84.8% 90.9% ― 206.6%
U.S. 133.9% 77.0% 45.3% 49.9%
France 92.8% 160.5% ― ―
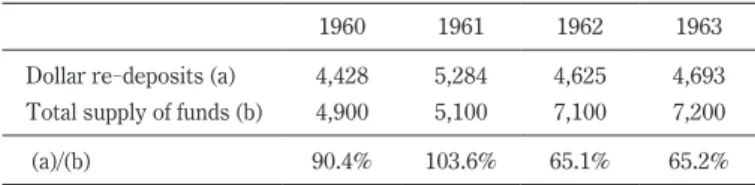
remaining balance was considered to represent the amount of funds supplied by the London branch to other countries. Table 13 compares this amount with the amount of dollar deposits.
It is evident from the above table that the London branch supplied funds by utilizing dollar deposits. This may be considered a reasonable finding since most of the deposits received by the London branch
were in dollars. Thus, the above analysis indicates that 1960-3, most of the funds supplied by London to
Brazil, the U.S., and France was in dollars and was utilized for the branches’ conduct of business.
Since figures on dollar deposits from the London branch to other branches are unavailable for years prior to 1960, it is unknown whether supply of funds from the London branch to countries that had a shortage of funds was conducted in dollars. Therefore, we must make inferences regarding the years prior to 1960 using other available information. For this reason, we examine a letter from Bolsa President Sir George Bolton to Deputy Governor Cameron Cobbold of the Bank of England, written in
1958.45) This letter indicates that Bolsa faced a shortage of funds due to the growth of its business and
competition with local and foreign banks in Central and South America. The letter states that the London branch of Bolsa required funds in order to provide finance to Latin America for certain projects. A few specific examples of such projects were £1 million in financing for a construction project in Brazil and £2 million for a construction project in Argentina. Further, Bolton also stated that Bolsa required
dollar funds for use in Central America as the region is part of a dollar-based system, and Bolsa was
facing stiff local competition in both lending and trade finance due to a shortage of funds.46) This
contention of Bolton was supported by the fact that in 1956, manager of the Rio de Janeiro branch of Bolsa wrote to the head office in London and mentioned intensification of local competition and a shortage of cruzeiro.47)
Although Bolton directly mentioned the need for dollars in Central America, he did not mention
45) The letter from G. Bolton to C.F. Cobbold, 7 Jan. 1958, The National Archives, T/231/1192. 46) Ibid.
47) A letter dated 30 June 1956 and one dated Dec. 1956 from the Rio de Janeiro branch manager to the head office. Both in ‘Extracts from managers’ reports on conditions and prospects’, LA, F2/D/Rep. 1. Further, a letter dated 31 Dec. from a manager in Venezuela and one dated 30 June from the manager in Montevideo also mentioned the intensification of local competition. Ibid.
Table 13. Supply of funds by the London branch to other branches (£ thousand)
1960 1961 1962 1963
Dollar re-deposits (a) 4,428 5,284 4,625 4,693
Total supply of funds (b) 4,900 5,100 7,100 7,200
(a)/(b) 90.4% 103.6% 65.1% 65.2%
Notes :
a Dollar re-deposits represent balances as of Dec. of each year. b Total supply of funds represents total supply of funds minus
supply of funds to the head office in London. Sources : Appendix and table 8
which currency Bolsa would use in Brazil and Argentina. However, it is rather likely that supply of funds from London was conducted in dollars to Brazil and in pound sterling to Argentina. The first clue in this regard is provided in table 14, which indicates the currency used in trade settlement with Latin America and Europe. In 1949, dollar settlement accounted for 7 per cent of settlement with the group that included Argentina but 41 per cent with the group that included Brazil. Thus, dollar settlement accounted for a large share in Brazil’s trade settlement with not just the U.S., but Europe as well.
The second clue is foreign exchange control definitions in Brazil. In 1952, Brazil included the Belgian franc, Canadian dollar, Portuguese escudo, pound Sterling, Swedish krona, Swiss franc, U.S.
dollar, and Uruguayan peso among hard currencies.48) However, in 1953 only the U.S. dollar, Swiss
franc, and Portuguese escudo were included in exchangeable currencies. Therefore, it is evident that the U.S. dollar was necessary in Brazil for conducting banking business. However, in Argentina, there was no such clear systemic statement of the status of foreign currencies.
The third clue is Brazil’s foreign trade structure, which is presented in table 15. In the 1950s,
Brazil’s foreign trade depended heavily on the U.S. : 38-54 per cent in exports and 26-45 per cent in
imports. This could also be one of the reasons that Bolsa required the U.S. dollars for trade finance in Brazil because, for example, when Brazilian importers took loans from Bolsa for importing goods from the U.S., these loans were probably given in dollars ; moreover, when the importers used drafts on New York, the branch in the city had to have sufficient dollar funds to pay to exporters who brought the drafts
to the New York branch.49) The latter case can partially explain the why Bolsa’s New York branch
required a large amount of dollar funds because the New York branch’s dollar funds were paid drafts not only from Brazil but also from all countries where Bolsa had business connections in the form of branches or business correspondences. On the other hand, when New York importers asked for loans from
48) IMF, Report on exchange restrictions, 1952, p. 51 and 1953, p. 80.
49) On procedures of trade finance between branches of international banks, see Nishimura, ‘The flow of funds’, pp. 27-29.
Table 14. Percentage of trade settlement in dollar for Latin America and Europe
% of US$
Argentina, Uruguay, Paraguay 7%
Brazil, Chile, Peru, Bolivia 41%
Other 96%
Total for Latin America 33%
Notes :
a Venezuela is not included.
b ‘Other’ includes Colombia, Costa Rica, Cuba,
Dominican Republic, Ecuador, Guatemala, Haiti, Honduras, Mexico, Nicaragua, Panama, and El Salvador.
Source : Economic Commission for Europe, ‘European trade with Latin America’, p. 21.
Bolsa’s New York branch for imports from Brazil, these loans also had to be advanced in dollars. This case also can explain the reasons for the dollar demand in the New York branch and can be extended to cases of imports from countries other than Brazil. Thus, the above analysis on the letter from the chairman of Bolsa and the external financial structure of Latin America leads to the conclusion that even in the period from 1957 to 1959, Bolsa required U.S. dollars to finance foreign trade. This was particularly important since the bank had businesses in the U.S. and Latin American countries, in particular, Brazil under the situation that using pound sterling was banned for trade finance between third countries.
Therefore, it may be concluded that the Bolsa’s London branch accepted eurodollars in order to supply funds in dollars to branches in countries where financial transactions were dominated by the U.S. dollar, such as Central America, Brazil, and the U.S. Moreover, it has been established that Bolsa had sufficient motive for prompt action in accepting dollar deposits as compared with banks that were not active in North and South America.
V
In the concluding section of this paper, the relationship between this paper’s findings and those of Schenk’s study are considered. Schenk clarified that in 1955 Midland Bank was the first participant in the eurodollar market. She described the activities of Midland Bank as corresponding to those in the
market creation stage of Llewellyn’s model of financial innovation.50) In this stage, the scope of
utilization of new financial products is narrow, and the number of firms using them is small as well.51)
50) Llewellyn, ‘Financial innovation’, p. 16.
51) Schenk, ‘The origins of eurodollar market’, p. 226.
Table 15. Shares in Brazil’s foreign trade
(%)
U.S. Britain
Exports Imports Exports Imports
1951 50.9 45.4 10.2 9.2 1952 54.4 45.3 2.8 9.3 1953 49.9 30.6 4.7 4.1 1954 37.9 36.1 4.8 1.1 1955 43.2 26.3 4.3 1.5 1956 50.6 32.1 3.6 3.8 1957 48.6 40.3 4.9 3.7 1958 45.9 39.6 4.6 3.6
Note : Exports from Brazil and imports to Brazil
Source : Naciones Unidas, Boletín económico de América Latina, Cuadro 30, pp. 48-53, and Cuadro 31, pp. 54-61.
The market creation stage is followed by the spread of innovation stage. New financial products have a life cycle similar to that of manufactured products. However, in the case of financial products the period during which the innovating firm can enjoy the benefits of being the first to market is even shorter than in the case of manufactured products. The main causes of this are the fact that the initial costs of intro-ducing new financial products are relatively low and it is difficult to restrict access to the content of new
financial products.52) In the section of her paper entitled ‘spread of innovation’, Schenk argues that
Mid-land Bank’s initial advantage in the eurodollar market was lost over a short period. It is conceivable that the argument in ‘spread of innovation’ could apply to Bolsa as well. Table 1 indicates that Bolsa’s share in the eurodollar deposits market was on a decreasing trend.
Thus, both Midland Bank, as seen in Schenk’s study, and Bolsa, as seen in this paper, entered the eurodollar market early and on a large scale due to the special factors of a worsening liquidity ratio (in Midland Bank’s case) and shortage of local Central and South American currencies (in Bolsa’s case). Each of these two examples demonstrates the unique characteristics of the market creation stage. Moreover, both these banks have in common the fact that in the stage in which the size of the market grew and the anonymity of market participants expanded, they were unable to continue holding large market shares.
One unique characteristic of the case of Bolsa when compared with Midland Bank is the fact that the special factor responsible for Bolsa’s entry into the market was related to international finance. The case of Bolsa is indicative of the fact that the City of London could survive as an international financial centre by combining its extensive financial network and a rising international currency, the U.S. dollar, with a confirmation from the viewpoint of the requirements of international banking business. How-ever, Bolsa’s business accounted for a limited share of the international banking business and financial agglomeration in the City of London. Therefore, it is necessary to study the cases of other initial market participants in the eurodollar market and compare the case of Bolsa to its competitors in the future.
Appendix
Bolsa’s inter-branch accounts by country (£ thousand)
1951 1952 1953 1954 1955 1956 1957
Argentina −1,300 −1,400 −1,200 −2,200 −3,100 600 −800
Brazil −2,600 −2,400 −2,100 −500 −500 −1,100 −1,200
U.S. −3,600 −2,900 −2,200 −1,800 −2,000 −1,600 −2,900
London 3,900 1,600 1,200 4,700 4,600 5,700 4,900
Head office (in London) −900 −80 −600 −4,100 −4,500 −5,200 −1,900
Chile 100 −900 900 200 80 80 200 Paraguay 100 70 300 80 400 100 100 Peru 100 9 50 6 −20 −200 −30 Uruguay −300 −30 −50 100 100 100 300 France −100 −90 −200 −30 −10 100 90 Portugal −60 30 70 90 −5 −10 60 Spain 50 300 200 70 −80 −60 100 Bradford 400 400 300 300 200 70 80 Manchester −40 100 100 −20 10 −10 −70 Colombia −30 −30 −30 −300 40 −100 300 Ecuador −6 −30 −10 −60 −3 −10 40 Guatemala 10 100 50 10 70 70 700 Nicaragua −30 −80 −20 −30 −3 −10 −10 El Salvador 700 70 100 300 300 200 100 Venezuela 100 8 30 −10 70 −50 −50 Total −3,000 −3,400 −2,900 −3,100 −4,300 −1,200 −5,900 1958 1959 1960 1961 1962 1963 Argentina 400 2,200 10 1,400 800 1,200 Brazil −1,200 −2,100 −2,800 −1,100 70 −700 U.S. −2,900 −1,700 −1,600 −5,100 −7,100 −6,500 London −200 6,900 18,100 8,300 35,700 89,700
Head office (in London) 2,900 −4,900 −13,200 −3,200 −28,600 −82,500
Chile −50 −40 100 −50 −900 −70 Paraguay −60 −200 −300 −600 −300 −200 Peru 20 0 −1 −30 −40 20 Uruguay 400 600 200 100 −200 100 France 100 −400 −1,000 −200 40 2 Portugal 50 100 100 200 60 100 Spain 20 −10 −200 100 400 600 Bradford −70 −90 −70 −200 −400 −900 Manchester 20 10 300 10 −3,100 −3,100 Total −1,000 300 −400 −400 −3,700 −2,300 Notes :
a ‘−’ (minus) indicates liabilities ; other figures indicate assets. For this reason, negative values are for
coun-tries that are fund recipients and other values are for councoun-tries that are fund providers.
b All branches in Colombia, Ecuador, Guatemala, Nicaragua, El Salvador, and Venezuela were transferred to the
Bank of London and Montreal, which was established as a joint venture of the Bank of Montreal and Bolsa in 1958.
References
Altman, O., ‘Recent developments in foreign markets for dollar and other currencies’, Staff Papers, 10 (1963), pp. 48-96.
Baker, M. and Collins, M., ‘London as an international banking centre, 1958-1980’, in Y. Cassis and É. Bussière, eds.,
London and Paris as international financial centres in the twentieth century (Oxford, 2005), 247-63.
Bank of England, ‘U.K. bank’s external liabilities and claims in foreign currencies’ Quarterly Bulletin, 4(2) (1964), pp. 100-8.
Battilossi, S., ‘Introduction : international banking and the American challenge in historical perspective’, in S. Battilossi and Y. Cassis eds., European banks and the American challenge (Oxford, 2002), pp. 1-35.
Battilossi, S., ‘Banking with multinationals : British clearing banks and the euromarkets’ challenge’, in S. Battilossi and Y. Cassis eds., European banks and the American challenge (Oxford, 2002), 103-34.
Burn, G., ‘The state, the City, and the euromarkets’, Review of International Political Economy, 6(2) (1999), pp. 225-61.
Cain, P.J. and Hopkins, A.G., British imperialism : Crisis and deconstruction 1914-1990 (1993).
Clendenning, E.W., The euro dollar market (Oxford, 1970).
Economic Commission for Europe, ‘European trade with Latin America’, Economic Bulletin for Europe, 2(3) (1950), pp. 18-49.
Fry, R., A banker’s world : the revival of the City 1957-1970, (1970).
Grant, A.T.K., The machinery of finance and the management of sterling (1967).
Holley, H.A., ‘Bolsa under Sir George Bolton’, in R. Fry ed., A banker’s world : the revival of the City 1957-1970 (1970),
pp. 202-19.
Jones, G., ‘Competitive advantages in British multinational banking since 1890’, in idem ed., Banks as multinationals (1990), pp. 30-61.
Jones, G., British multinational banking 1830-1990 (Oxford, 1993).
Joslin, D., A Century of banking in Latin America : Bank of London & South America Limited 1862-1962 (Oxford, 1963).
Llewellyn, D., ‘Financial innovation : a basic analysis’, in H. Cavanna, ed., Financial innovation (1992), pp. 15-51.
Nishimura, S., ‘The flow of funds within the Hong Kong and Shanghai Banking Corporation in 1913’, in O. Checkland, S. Nishimura, and N. Tamaki eds., Pacific banking, 1859-1959 (New York, 1994), pp. 24-51.
Schenk, C.R., ‘The origins of the eurodollar market in London : 1955-1963’, Explorations in Economic History, 35
(1998), pp. 221-38.
Schenk, C., ‘Crisis and opportunity : the policy environment of international banking in the City of London, 1958-1980’,
in Y. Cassis and É. Bussière, eds., London and Paris as international financial centres in the twentieth century (Oxford, 2005), pp. 207-28.
Schnek, C.R., The decline of sterling : Managing the retreat of an international currency, 1945-1992 (Cambridge, 2010).
Toniolo, G., Central banking cooperation at the Bank for International Settlements, 1930-1973 (Cambridge, 2005).
Official publications
IMF, Report on exchange restrictions (1952) IMF, Report on exchange restrictions (1953)