Spectrochemical Characteristics of Pulsed Glow
Discharge Plasma and the Application to
Emission Spectrometric Analysis
著者
XINYUE ZHANG
学位授与機関
Tohoku University
学位授与番号
11301甲第18952号
Spectrochemical Characteristics of Pulsed Glow
Discharge Plasma and the Application to Emission
Spectrometric Analysis
(パルスグロー放電プラズマの分光化学特性とその
発光分光分析への応用)
B6GD2502
Xinyue Zhang
Course of Eco-materials and Processing
Department of Frontier Sciences for Advanced Environment
Graduate School of Environmental Studies
CONTENTS
1. Introduction ... 1
1.1 Purpose of this study ... 1
1.2 Glow Discharge ... 3
1.2.1 Spatial Zones in the Glow Discharge ... 3
1.2.2 Voltage-Current Characteristics ... 8
1.2.3 Excitation and de-excitation Processes in the Glow Discharge Plasma ... 11
1.2.4 Cathode Sputtering ... 12
1.2.5 Grimm-style Glow Discharge Tube ... 13
1.2.7 Radio-Frequency (RF) Power Supply Glow Discharge ... 15
1.2.8 Glow discharge in pulsed mode ... 15
REFERENCES ... 17
2. Comparative Investigation of the Emission Characteristics Between 6.78-MHz Radio-Frequency and Direct-Current Glow Discharge Plasmas ... 20
2.1 Introduction ... 20
2.2 Experimental ... 22
2.3 Results and Discussion... 24
2.3.1 Self-bias voltage in 6.78-MHz RF glow discharge plasma ... 24
2.3.2 Boltzmann plots of Fe I lines ... 26
2.3.3 Consideration of the excitation mechanism... 35
2.4 Summary ... 37
REFERENCES ... 38
3. Emission Characteristics of 6.78-MHz Pulsed RF Glow Discharge Plasma ... 40
3.1 Introduction ... 40
3.2 Experimental ... 40
3.3 Results and Discussion... 42
3.3.1 Structure of the glow discharge plasma and the excitation phenomena ... 42
3.3.2 Variation of emission intensity in pulsed mode ... 47
3.3.3 Boltzmann plots of Fe I lines ... 52
3.3.4 Boltzmann plots of Fe II lines ... 60
3.3.5 Intensity ratio of Fe II to Fe I lines ... 61
3.4 Summary ... 65
REFERENCES ... 66 4. Investigation of the Discharge Parameters for Three-dimensional Observation in
Glow Discharge Optical Emission Spectrometry ... 68
4.1 Introduction ... 68
4.2 Experimental ... 70
4.2.1 Text sample ... 70
4.2.2 Apparatus ... 70
4.3 Results and Discussion... 73
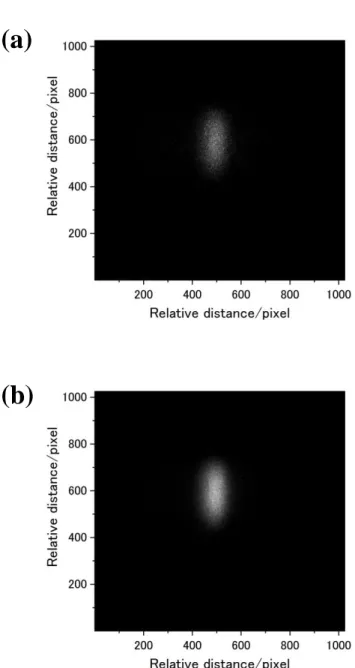
4.3.1 Emission image of copper chip ... 73
4.3.2 Delay time of ICCD detector ... 80
4.3.3 Gate width of ICCD detector ... 82
4.3.4 Three-dimensional spatial resolution ... 84
4.4 Summary ... 88
REFERENCES ... 89
5. Application of laser ablation to sampling for glow discharge plasma optical emission spectrometry ... 90
5.1 Introduction ... 90
5.2 Experimental ... 91
5.2.1 Experimental system ... 91
5.2.2 Sample and analytical lines ... 91
5.2.3 Data processing in FFT analyzer ... 93
5.3 Results and discussion ... 95
5.3.1 Enhancement of Cu emissions in LAGD ... 95
5.3.2 FFT analysis on the pulsed response of Cu emission signal ... 107
5.4 Summary ... 112
REFERENCES ... 113
1
CHAPTER 1
1. Introduction
1.1 Purpose of this study
Glow discharge optical emission spectrometry (GD-OES) has been widely employed for direct analysis of solid samples, because the glow discharge produces stable gaseous plasma, which is self-maintained under appropriate discharge conditions, to emit the characteristic radiation with a small fluctuation of the intensity as well as a low background level [1,2]. In GD-OES, the sampling process occurs through cathode sputtering when positive ions in the plasma are accelerated and then bombarded against the sample surface. The sputtering process enables GD-OES to be a rapid analytical method for obtaining a depth profile of the sample composition, because the analytical procedure can be rapidly conducted with a little sample pretreatment without ultra-high vacuum conditions [3-6]. Both direct current (DC) and radio-frequency (RF) power supplies are acceptable to maintain the glow discharge plasma. This variety of the power supplies enables the application fields of GD-OES to be more extended.
Glow discharge produced a so-called ‘cold plasma’, which means that the kinetic energy of gas species in the plasma is relatively small and thus the characteristic gas temperature is not so high [7]. A probable reason for this is that collisions with energetic electrons, which are accelerated by the electric field, occur insufficiently enough to cause the energy transfer to gas particles, because the glow discharge is generated under reduced pressures. As a result, there is a large difference between the gas temperature and the electron temperature in the glow discharge plasma.
Plasma in the local thermodynamic equilibrium (LTE) can be characterized by a unique temperature which can predict a spectrum pattern from the Boltzmann distribution among the corresponding excited energy levels [8]. However, the glow discharge plasma is not in the LTE condition. Therefore, in the glow discharge plasma, it is difficult to understand the emission spectrum only with the plasma temperature, and the excitation / ionization process in GD-OES cannot be explained with the Boltzmann distribution [9,10]. It has been reported that spectrum patterns emitted from the glow discharge plasma greatly depend on the kind of plasma gas [11-13]. The characteristics of gas determine not only the relative intensities of the emission lines, but also the kind of the observable spectral lines. Metastable species of the plasma gas play an important role in exciting emission lines of singly-ionized atoms [14]. It is suggested from these results that any particular excitation mechanism may exist in the glow discharge plasma.
2
Commercial apparatuses for RF GD-OES are normally equipped with an RF power generator at a driving frequency of 13.56 MHz. According to the radio act law in Japan, it is possible to change the RF frequency form 13.56 to 6.78 MHz for a power supply in GD-OES. It may be an interesting alternative, principally because the 6.78-MHz discharge has lager self-bias voltage than that of 13.56 MHz [15] and thus may provide larger amounts of samples sputtered into the plasma. However, few studies have been reported on the spectrochemical evaluation of 6.78-MHz glow discharge plasma. Therefore, the ionization / excitation characteristics of 6.78-MHz RF plasma should be further investigated to employ it as an excitation source in atomic emission spectrometry.
For this purpose, Chapter 2 deals with Boltzmann plots for atomic emission lines of iron in 6.78-MHz RF glow discharge plasma, and then compares them with the results of that of conventional DC glow discharge plasma, in order to elucidate how the excitation behavior of iron species is different or similar between the different power modes.
Chapter 3 investigates Boltzmann plots for both atomic and ionic emission lines of iron in an argon glow discharge plasma driven by 6.78-MHz radio-frequency (RF) power in a pulsed operation, in order to discuss how the excitation/ionization process was affected by the pulsation.
Furthermore, there is a possibility in GD-OES that the analytical information can be obtained not only along the depth direction, but also in the lateral direction over the sample surface, because sputtered sample atoms emit the characteristic radiation in the negative glow region just above the surface and thus a spatial image of radiation may correspond to the lateral distribution of the sample atoms. A conventional analytical system for GD-OES is suitable for the general analytical application. However, it cannot provide any information about the spatial distribution of the emission intensity at different portions in the plasma. Chapter 4 describes a specified measuring system for GD-OES, which can provide a spatial/radial distribution of analyte atoms on the sample surface, while the conventional system provide only the information about the elemental distribution in depth direction.
Chapter 5 describes a new measuring system, in which a pulsed GD-OES is combined with a laser ablation sampling with a Q-switched Nd:YAG laser. A unique feature of this system is found, such that the excitation process for atomic emission can be individually controlled from the sampling process.
3
1.2 Glow Discharge
The glow discharge is a plasma state formed by a passage of electric current through a gas. It is often produced by a sealed glass vessel with two electrodes set parallel, as shown in Fig.1-1. The chamber is connected to a vacuum system and has an inlet port for introducing a discharge gas, which is usually an inert gas such as argon, and a DC potential is applied across the two electrodes. When the voltage exceeds a value called the striking voltage, the gas ionization becomes self-sustaining, and the tube glows with a colored light. The glow discharge is used as a source of light in devices such as neon lights, fluorescent lamps, and plasma-screen televisions. Analyzing the emitted light with a spectrometer can reveal information about the atomic interactions in the plasma. Therefore, a glow discharge is used in analytical spectroscopy, and is also used in the surface analysis through the process called sputtering [16].
Electrons in the glow region can be classified into three groups [17,18]. The first group is called primary electrons, which consists of γ-electrons which enter from the cathode dark space with relatively high energies. The second group consists of the electrons which are produced secondarily in the negative glow region, is called secondary electrons. The secondary electrons are accelerated away from the cathode and undergo a variety of collisions through the plasma. These collisions lead to the excitation and/or ionization of the gas atoms. The excitation and subsequent de-excitation to the lower levels by radiation decay are responsible for characteristic emission in the glow discharge. The ionization collisions create new positive ion-electron pairs; the ions are accelerated again towards the cathode and produce new secondary ions. Thus, the combination of ionization collisions and the resulting secondary electrons make the glow discharge to be self-sustained plasma. The last group consists of the electrons which are repelled by the anode dark space as well as by the cathode dark space. The slow electrons are finally trapped by the plasma potential because their kinetic energies become gradually lower. These electrons occupy larger parts of the whole glow electrons. Therefore, the average kinetic energy of the glow electrons, specifically the electron temperature, is determined mainly by the last group of electrons.
1.2.1 Spatial Zones in the Glow Discharge
The glow discharge can be divided into several regions between the cathode and anode, characterized by the emission intensity, the potential and the electric field distribution, the space charge and the current density. It is well known that the glow
4
discharge in the chamber comprises several alternating dark and luminous zones, as is shown in Fig.1-1. However, all of these zones do not necessarily appear in the glow discharge column. The structure and the occurrence of the emitting regions depend on the discharge parameters like the voltage, the pressure and kind of gas, and especially the distance between the two electrodes. Generally, when the distance of electrodes is relatively long, the positive column attracts much attention in the discharge column. However, the positive column is not essential for maintaining the glow discharge. It is found that if the separation between the two electrodes is reduced, the positive column shrinks and finally disappears while the negative glow and cathode dark space are hardly affected. In this case, Faraday dark space as well as the positive column also disappears. Such a diagram is called an obstructed glow [19].
5
6
Discharge tubes working under the obstructed glow condition are employed extensively as an excitation source for atomic emission spectrometry. Chapman suggested a simplified fundamental model only including the negative glow region, the cathode dark space, and the anode dark space, as described in Fig.1-3 [17]. In this model, a glow region occupies the greater part of the discharge body and the dark spaces are adjacent to each electrode. The anode dark space is much thinner than the cathode dark space. The lower part of Fig.1-2 describes schematically the voltage distribution when the anode electrode is grounded. Little electric potential is evident in the glow region, and thus most of this region has the same potential Vp, which is called
the plasma potential. The glow region has a small potential difference due to a large difference in the mobility of an electron and a positive ion [20].
Since a negative potential Vd is applied to the cathode, a large electric field
corresponding to Vd is produced in the cathode dark space. The difference in the
potential across the cathode dark space is called the cathode fall. In the anode dark space, Vp can also induce an electric field though its strength is much smaller than that
of the cathode dark space. The electric fields in the discharge body are largely restricted to the dark spaces at each electrode. Electrons without enough kinetic energies to penetrate these fields are repelled back to the negative glow region, not only by the cathode dark space field but also by the anode dark space field.
The electrons in the discharge body are accelerated by the applied electric field. As a result, energetic electrons collide with gas atoms to cause the ionization. While a great number of electrons are produced through various collision reactions, the electrons are lost rapidly as a result of electron-ion recombination processes. It is considered that the discharge is sustained by counterbalancing between the creation and the loss of the electrons. There is also a possible energy loss corresponding to heat from the discharge body to the environment. In order to obtain a stable discharge, the energy loss must be compensated for by the energetic electrons, because only these electrons are capable of accepting electric energies from the external power supply.
7
Fig.1-2 The voltage distribution in an obstructed DC glow discharge, and the schematic explanation of cathode sputtering.
8
1.2.2 Voltage-Current Characteristics
The investigation of the discharge voltage-current distribution is important to understand the behavior of the glow discharge. Fig. 1-3 shows typical voltage-current characteristics of the glow discharge [21]. The main characteristics of the discharge, such as the breakdown voltage, the voltage-current variations, and the structure of the discharge depend on the geometry of the electrodes and the chamber, the plasma gas, and the materials of electrodes. Three regions can be identified generally as shown in Fig.1-3.
1.2.2.1 Dark Discharge
Initially no current flow is observed if the applied voltage is too low to induce ionization in the gas body. As the DC potential V gradually increased, an unstable and intermittent discharge accompanied by random sparks may be observed at very low values of the current, which is also called dark current. If the potential V is further increased, the discharge current I increases rapidly and a dark self-maintained discharge is produced. Such a discharge is called Townsend dark discharge, shown as the region A-B in Fig.1-3, which is characterized by a so-called breakdown voltage Vb. Electrical
breakdown occurs in the Townsend region with the addition of secondary electrons emitted from the cathode due to ion and photon impacts. At the breakdown potential, the current might be increased by a factor of 104 to 108, and is usually limited only by the internal resistance of the power supply. The breakdown voltage for a particular gas and an electrode material is determined by the product of the pressure and the distance between the electrodes, as expressed in Paschen’s law [22].
1.2.2.2 Glow Discharge
When the discharge current further increases, the voltage increases (the region C-D in Fig.1-3) and reaches a value Vn. The potential Vn then remains almost constant
for large variations of the current from about 10-4 to 10-2 A, as shown in the region D-E in Fig.1-3. When the discharge current is more than the value at the point E, the voltage varies again and the discharge enters a region where the discharge voltage increases along with the current (the region E-F). The discharges in the region D-E-F are called glow discharge. It is called a normal glow in region D-E, and an abnormal glow in the region E-F [23].
1.2.2.3 Arc Discharge
9
voltage decreases abruptly and then reaches only several tens of volts for currents of the order of 10 A. This indicates that the discharge characteristics are altered from high voltage and low current (glow discharge) to low voltage and high current in the region G-H, which is called arc discharge.
10
11
1.2.3 Excitation and de-excitation Processes in the Glow Discharge Plasma
The excitation and de-excitation of atoms are caused by various types of collisions involving energy exchanges between the colliding species. The collision reactions are classified into those of the first kind and those of the second kind [24]. There is an exchange in the kinetic energies of the particles in the first kind, whereas the internal energies are involved in the second kind. Large parts of the excited particles having higher energies are de-excited rapidly down to lower energy levels with photon emission, and then the lifetime of these states is much shorter than the time required for energy exchanges by means of any inter-particle collisions or collisions to the wall of the discharge chamber [25]. However, in a metastable state, any de-excitation process followed by the photon emission is forbidden by selection rules [26]. The particle in the metastable state has a prolonged lifetime, and may survive until it is de-excited through the radiation process. Therefore, it can be considered that a metastable state has an internal energy corresponding to its excitation energy.
Typical collision reactions can be represented as the following equations [27]: A + D (fast) A* + D (slow) + △E (1-1) A + D (fast) (A+)* + D (slow) + e- + △E (1-2) A + e- (fast) A* + e- (slow) + △E (1-3) A + e- (fast) (A+)* + e- (slow) + e- + △E (1-4) A + Dm (A+)* + Dg + e- + △E (1-5) A + D+ (A+)* + Dg + △E (1-6) The superscript denoted by m, g, *, -, represents ground, metastable, excited, and ionic state. On receiving the energy form a particle D or an electron e-, a particle A is excited and immediately de-excited with the photon emission. △E denotes the difference in the excitation energy before and after the collision.
1.2.3.1 Collisions of the First Kind
Equations from (1-1) to (1-4) describe collisions of the first kind, where the excitation/ionization reactions are caused by the fast particles having large kinetic energy. However, it is essential that the kinetic energy must be larger than the excitation/ionization energy of the particle A. Since the gas temperature of the glow discharge plasma is not high, the reactions shown as equation (1-1) and (1-2) would take place less actively. This implies that atom-atom or atom-ion collisions are minor processes for obtaining excited species in the plasma. On the other hand, electron
12
impact collisions described in equation (1-3) and (1-4) can be a possible mechanism for the excitation/ionization in the glow discharge plasma.
1.2.3.2 Collisions of the second kind
Equations (1-5) and (1-6) describe collisions of the second kind, where the excitation/ionization reactions are caused by metastable atoms having large internal energies.
Equation (1-5) is called Penning ionization [28]. In this case, the metastable particle Dm acts as an energy donor for the ionization of the particle A, and the surplus energy is taken by the ejected electron. The metastable levels are favorably populated under an evacuated atmosphere. Therefore, the Penning ionization by rare gases is a feasible process in the glow discharge plasma.
Equation (1-6) is called a charge transfer ionization [29]. No electron is released in this reaction and the surplus energy is shared by the colliding particles. Therefore, the charge transfer process is most likely to take place when the △E is very small, less than 0.2 eV, indicating that an energy resonance is required [30].
1.2.4 Cathode Sputtering
As illustrated in Fig.1-3, when positive ions and fast neutrals strike the cathode surface with sufficient force, they may penetrate into the surface and while losing their kinetic energy through a series of three-dimensional collisions with atoms of the cathode material. As a result, some atoms at the uppermost surface obtain a part of the kinetic energy, and they could be ejected from the surface if the energy is larger than their binding energy. The majority of the sputtered particles are normally neutral atoms, while positive ions return back to the surface due to the strong electric field in the cathode sheath. However, a certain amount of the neutral atoms can diffuse into the negative glow region. Glow discharge analytical method is based on optical emission of the sputtered neutral atoms in the glow region.
The most fundamental parameter with respect to the sputtering process is the sputtering field, which is defined as the number of the sputtered atoms per incident ion [31]. It depends on the kind of discharge gas, the mass and the energy of the incident particles, and the chemical and physical states of the cathode surface.
Inert gases are commonly used in glow discharge plasma, since they provide high sputtering yields and do not undergo any chemical reaction with the cathode.
13
1.2.5 Grimm-style Glow Discharge Tube
In 1967, Walter Grimm introduced a glow discharge tube with a flat cathode [32]. The Grimm-style glow discharge tube is most commonly employed as an excitation source in glow discharge optical emission spectrometry (GD-OES). Originally intended as an alternate to the spark source, the Grimm-style tube has proven to be an excellent tool for routine bulk analysis. Fig.1-4 illustrates a schematic diagram of the discharge tube [33]. The sample is taken as the cathode and the hollow anode is kept at a small distance from the cathode (usually less than 0.5 mm). The discharge tube is first evacuated down to 10-2 Torr through two rotary vacuum pumps. Then a discharge gas (usually argon) is introduced into the tube at a pressure of several hundred Pa and flows continuously during the measurement. When a voltage is applied between the two electrodes, a glow discharge is produced in front of the cathode.
A stable discharge is produced in the narrow region between the inner wall of the anode and the cathode surface located opposite to the hollow anode cavity. The bright part of the discharge mainly consists of the negative glow. In analytical applications, the zone of interest is the negative glow, because particles sputtered from the cathode sample are strongly excited in this region.
The generation of particles analyzed results from a non-thermal cathode sputtering process. A unique feather of the Grimm-style tube lies in the sampling caused by the cathode sputtering, which can be easily controlled. The sampling rate depends on the voltage, the current, the gas pressure, and the material of the cathode sample. Information about the in-depth variation of the elemental composition can be obtained by analyzing the emission intensities with sputtering time [34].
14
15
1.2.7 Radio-Frequency (RF) Power Supply Glow Discharge
GD-OES can also be operated using a radio-frequency (RF) power supply. Several scientific papers were published with respect to comparison of the glow discharge plasma produced by DC and RF power supplies in GD-OES. Winchester first pointed out a similarity in the characteristics of resulting emission spectra in these different power modes [35, 36]. Efimova et al. observed the progress of the sputter crater formation to compare the sputtering process occurring in a Grimm-type plasma source between DC and RF power supplies [37].
In a typical analytical RF glow discharge device, sputtering of the sample is accomplished by placing the sample in contact with one of the conducting electrodes generally referred to as the backing electrode. This arrangement was first suggested by Wehner and had efficiently been demonstrated for the sputtering of insulating materials. A striking feature of the technique is that the surface is bombarded alternatively by positive ions in one half cycle and electrons in the next half cycle and thus causes continuous sputtering of the insulating materials.
RF and DC glow discharge plasmas are similar in many ways. So similar in fact that the RF glow discharge has been described as a DC discharge superimposed with high frequency field [38]. In both cases, atomization of the solid sample is the result of ion bombardment, excitation is due to in-elastic collisions with energetic electrons, and ionization can be attributed to inelastic collisions with both energetic electrons and metastable atoms of the surrounding gas.
The DC discharge and RF glow discharge differ in the densities and the energy distributions of charge particles, which may result in different excitation and ionization efficiencies. Also, the high frequency field in the RF plasma may cause high frequency modulation of the kinetic energy of ions striking on the sample surface. This may affect the sputter atomization efficiency of the RF discharge as compared to that of the DC discharge. However, the main difference is that the RF discharge can analyze both conductive and non conductive materials, but the DC discharge is unable to sputter non-conductive materials.
1.2.8 Glow discharge in pulsed mode
Both DC and RF power supplies may be operated in a pulsed mode. The pulsed discharge can reduce the sputtering rate and minimize thermal damage of the sample surface, in order that one can analyze various specified samples, such as an ultra-thin layer and an organic film [39]. Nowadays, commercialized apparatuses for GD-OES have normally had a pulsed discharge mode. Some review papers have been
16
published on the analytical applications of the pulsed GD-OES [40,41].
A pulsed operation of the glow discharge generally exerts a negative effect on the analytical performance in GD-OES, because the emission intensity decreases at smaller gate width. However, the pulsed operation can give a cyclic variation in the emission intensity from the resulting glow discharge plasma, which would be utilized for a detection method, known as modulation spectroscopy. In such a measurement, only the cyclic component of the emission signal is able to be selectively detected using any data-processing equipment, where the signal components having the pulse frequency are fully removed [42,43]. This technique would improve the analytical performance in the pulsed GD-OES, if the intensity of an analytical emission line is modulated at a particular pulse frequency.
17
REFERENCES
[1] A. von Engel, Ionized Gases, Clarendon Press, Oxford (1965).
[2] R. Payling, D. Jones and A. Bengtson (Eds.), Glow Discharge Optical Emission Spectrometry, John Wiley and Sons, Chichester (1997).
[3] R. Payling, D. Jones, A. Bengtson (Eds.), Glow Discharge Optical Emission Spectrometry, John Wiley and Sons, Chichester (1997).
[4] R.K. Marcus, J.A.C. Broekaert (Eds.), Glow Discharge Plasmas in Analytical Spectroscopy, John Wiley and Sons, Chichester (2003).
[5] C.J. Belle and J.D. Johnson, In-depth compositional profile analysis of alloys using optical emission glow-discharge spectrography, Appl. Spectrosc., 27 (1973), 118-124. [6] J. Pons-Corbeau, J.P. Cazet, J.P. Moreau, R. Berneron, J.C. Charbonnier, Quantitative surface-analysis by glow-discharge optical spectrometry, Surf. Interface Anal., 8 (1986), 21-25.
[7] N.I. Uzelac, F. Leis, Measurement of gas temperatures and metastable state densities in a microwave boosted glow-discharge using a diode-laser, Spectrochim. Acta Part B, 47 (1992), 877-887.
[8] P.W.J.M. Boumans, Theory of Spectrochemical Excitation, Plenum Press, New York (1966).
[9] K. Wagatsuma, Y. Danzaki and T. Nakahara, Comparative study on excitation mechanism of chromium emission lines in argon radio-frequency inductively-coupled plasma, nitrogen microwave induced plasma, and argon or nitrogen glow discharge plasmas, Spectrosc. Lett., 36 (2003), 99-115.
[10] K. Wagatsuma, Some observation of an anomalous excitation behavior of chromium emission lines in an argon radio-frequency powered glow discharge plasma, Spectrochim. Acta Part B, 58 (2003), 565-573.
[11] K. Wagatsuma, K. Hirokawa, Emission spectroscopic studies of Grimm-type glow discharge plasma with argon–helium gas mixtures, Spectrochim. Acta Part B, 42 (1987), 523-531.
[12] K. Wagatsuma, K. Hirokawa, Effects of helium addition to an argon glow discharge plasma on emission lines of sputtered particles, Anal. Chem., 60 (1988), 702-705.
[13] K. Wagatsuma, K. Hirokawa, Spectrometric studies of excitation mechanisms on singly-ionized copper emission lines in Grimm-type discharge plasmas with helium mixture technique, Spectrochim. Acta Part B, 46 (1991), 269-281.
18
[15] K. Wagatsuma, H. Matsuta, Effect of the driving frequency on the emission characteristics of a radio-frequency glow discharge excitation source boosted by the introduction of a d.c. bias current, Anal. Sci., 17 (2001), 313-318.
[16]Mavrodineanu, R., Hollow Cathode Discharges - Analytical Applications, Journal of Research of the National Bureau of Standards. 89 (1984),147.
[17] B. Chapman, Glow Discharge Processes, John Wiley & Sons, New York, 1980. [18] N.I. Uzelac and F. Leis, Spectrochim. Acta, 47B, 887(1992).
[19] A. von Engel, Ionized gases, Claredon Press, Oxford, 1965.
[20] Francis. G, The glow discharge at low pressure, Handbuch der Physik, S. Flugge, ed. Springer, Berlin, 1956.
[21] A. M. Howason, An introduction to gas discharges, Pergamon press, Elmsford, New York, 1976.
[22] F. Paschen, Ann. Physics, 50 (1916) 191.
[23] A. von Engel, Ionized gases, Claredon Press, Oxford, 1965.
[24] G. Herzberg, Atomic Spectra and Atomic Structure, Dover Publications, New York, 1944.
[25] A. Corney, Atomic and Laser Structure, Oxford Science Publications, Oxford, 1977.
[26] P.W.J.M. Boumans, Theory of Spectrochemical Excitations, Plenum Press, New York, 1966.
[27] F. M. Penning, Philips Technical Library, Eindhoven, 1957. [28] A. von Engel, Ionized gases, Claredon Press, Oxford, 1965. [29] O.S. Duffendach and J. G. Black, Phys. Rev., 34, 35(1929).
[30] J. S. Chang, R. M. Hobson, Y. Ichikawa and T. Kaneda, Atomic and Molecular Processes in Ionized Gases, Tokyo Denki Univ. Press, Tokyo, 1982.
[31] R. Behrisch (Ed.), Sputtering by Particle Bombardment I, Springer-Verlag, Berlin, 1981.
[32] W. Grimm, Naturwissenschaften, 54, (1967), 586.
[33] K. Wagatsuma and K. Hirokawa, Observation of Cu-Ni alloy surfaces by low wattage glow discharge spectrometry, SIA Surf. Interface Anal., 6, (1984), 167.
[34] A. Bengtson, A contribution to the solution of the problem of quantification in surface analysis work using glow discharge atomic emission spectroscopy, Spectrochim. Acta Part B, 40(1985), 631.
[35] M. R. Winchester, R. K. Marcus, Applicability of a radiofrequency powered glow discharge for the direct solids analysis of non-conducting materials by atomic emission spectrometry, J. Anal. Atom. Spectrom., 5 (1990), 575-579.
19
[36] M. R. Winchester, C. Lazik, R. K. Marcus, Characterization of a radio frequency glow discharge emission source, Spectrochim. Acta B, 46 (1991), 483-499.
[37] V. Efimova, V. Hoffmann, J. Eckert, Sputter crater formation in the case of microsecond pulsed glow discharge in a Grimm-type source. Comparison of direct current and radio frequency modes, Spectrochim. Acta B, 76 (2012), 181-189.
[38] M.R. Winchester, C. Lazik and R.K. Marcus, Characterization of radio frequency glow discharge emission source, Spectrochim. Acta Part B, 46(1991), 483-499.
[39] R. Payling, D. Jones, A. Bengtson (Eds.), Glow Discharge Optical Emission Spectrometry, John Wiley and Sons, Chichester (1997).
[40] V. Hoffmann, V. V. Efimova, M. V. Voronov, P. Smid, E. B. M. Steers and J. Eckert: J. Phys. Conf. Ser., 133 (2008), 012017.
[41] M. R. Winchester and R. Payling: Spectrochim. Acta Part B, 59 (2004), 607. [42] K. Wagatsuma: Appl. Spectrosc. Rev., 37 (2002), 233.
20
CHAPTER 2
2. Comparative Investigation of the Emission Characteristics Between
6.78-MHz Radio-Frequency and Direct-Current Glow Discharge
Plasmas
2.1 Introduction
For a practical application in GD-OES, the emission yield (EY) which means a sensitivity factor of each analytical line has been generally employed, especially to obtain a quantitative depth profile in both DC and RF plasmas [1,2]. A comparison of EY was reported between different power modes [3]; however, the EY is a relative sensitivity factor which should be experimentally determined for several variables such as the discharge voltage and current, and thus, the physical meaning of EY is not necessarily clear. Therefore, it is considered that the excitation phenomena occurring in these plasmas should be further investigated.
The concept of local thermodynamic equilibrium (LTE) is described as follows: plasma in the LTE state is characterized by a unique temperature which can be determined by Maxwell-like distribution of the collision partner in a collision accompanying the exchange of kinetic energy, such as a collision with energetic electron [4]. However, the glow discharge plasma is not in the LTE condition and thus the excitation/ionization phenomena in GD-OES cannot be simply explained from the Boltzmann distribution [5,6]. Nevertheless, the plot of Boltzmann factor gave a systematic change on the whole, which would be attributed to the excitation processes occurring in the plasma. Previous papers indicated that deviations from a Boltzmann plot, which were observed in various emission lines of iron, gave useful information on the excitation/ionization processes in argon GD-OES [7,8]. Also, the emission characteristics of pulsed 6.78-MHz RF plasma were investigated using the iron emission lines when the duty ratio was varied as a controlling parameter, indicating that the excitation temperature of the resultant plasma was almost unchanged whereas the net emission intensity drastically decreased at smaller duty ratios [9]. Iron is the most suitable element for Boltzmann estimation, because it has lots of atomic emission lines having a wide range of the excitation energy and belonging to different spin multiplicities such as triplet, quintet, and septet, in a narrow range of wavelength. In the analysis of the iron atomic lines, we indicated that excited energy levels of iron atom above ca. 6 eV were more populated than a Boltzmann distribution among low-lying excited levels in an energy range of 3.4 – 4.6 eV, probably through stepwise
21
de-excitation processes from the higher energy levels [7,9]. More recently, Weiss et al. published that Boltzmann plots of titanium atomic lines produced a relatively consistent picture for their excitation channels, which were analyzed with a transition rate diagram, indicating that Boltzmann analysis could provide useful information on the excitation mechanism for atomic emission lines having relatively low excitation energies [10].
This chapter deals with Boltzmann plots for atomic emission lines of iron in 6.78 MHz RF glow discharge plasma, and then compares them with previous results measured using conventional DC glow discharge plasma in GD-OES. The objective of this work is to elucidate how the excitation behavior of iron species is different or similar between the different power modes [11].
22
2.2 Experimental
A Grimm-style glow discharge source [12] and a spectrometer system for this research is described in Fig.2-1.
For analysis of Boltzmann distribution, 69 emission lines of the Fe I, whose excitation energies range from 3.3 to 6.9 eV [13], were chosen in a narrow wavelength range of 368–385 nm, so that any correction for the wavelength-dependent sensitivity was not needed [7]. These Fe I lines are classified into three groups: 3d74p -3d74s, 3d64s4p - 3d74s (3d64s2), and 3d64s4d - 3d64s4p optical transitions [14]. The ground state of iron atom is a quintet energy level of 5D4 (0.00 eV) in the 3d64s2 electron
configuration and the excited energy levels belong to three different spin multiplicities: triplet, quintet, and septet [14]. In this chapter, two power modes, a 6.78-MHz RF and a DC power supply, were employed for the comparison in their excitation characteristics, when an RF power supply system was simply exchanged with a DC power supply (PAD1K-0.2 L, Kikusui Electronics Corp., Japan), as shown in Fig. 2-1. External discharge parameters for regulating DC-driven plasma are a voltage, a current, and a pressure of the plasma gas, whereas those for RF-driven plasma are forward and reflected powers, a applied root-mean-square voltage, and the peak voltage/current of the RF waveform, in addition to a pressure of the plasma gas [15]. In comparison of these different power-supply modes, it is usually employed to vary these electric parameters in a fixed value of the gas pressure, because both of the discharges can be stably maintained in a similar range of the gas pressure. A previous study in my laboratory is cited to indicate the result of the DC glow discharge plasma [7], where Boltzmann plots of Fe I lines were analyzed under the following conditions: a DC voltage range of 450–900 V at a fixed argon pressure of 530 Pa as well as an argon gas pressure range of 400–930 Pa at a fixed DC voltage of 600 V. In this paper, Boltzmann analysis in 6.78-MHz RF plasma is investigated under a similar pressure range of the plasma gas, by using the same excitation source as well as the same spectrometer system as in the previous report [7].
23
24
2.3 Results and Discussion
2.3.1 Self-bias voltage in 6.78-MHz RF glow discharge plasma
Fig.2-2(a) shows a typical variation in the self-bias voltage as a function of
the RF forward power when a 6.78-MHz RF plasma is produced at an argon pressure of 670 Pa, indicating that the self-bias voltage is gradually raised from 300 to 460 V with increasing the RF forward power. Fig.2-2(b) shows an instance of an argon-pressure-dependence in the self-bias voltage at a fixed RF forward power of 70 W, where the voltage drops from 420 V to 310 V when the argon pressure is elevated. The self-bias voltage is an important parameter to control a driving force for the sputtering of the sample electrode as well as for accelerating the ejected electrons from it. The previous studies indicated that, in the case of a DC glow discharge, the plasma could be maintained stable in a range of the applied voltage from 450 V to 900 V at an argon pressure of 530 Pa [7,8]. Actual ranges of the discharge parameters, at which stable glow discharges could be initiated and sustained, were different between the 6.78-MHz RF and the DC plasmas; therefore, it was difficult to compare their emission characteristics even though the average electric powers for these plasmas were kept to be similar. A reason for this is that the RF plasma may be controlled by more complicated discharge parameters, relating to the waveform of RF voltage, compared to the DC discharge [3]. Also, the difference in the actual electric power between the RF and DC discharges possibly results from a loss of RF power from the electrodes [16]. In this study, the emission characteristics were investigated comprehensively within each appropriate range of the discharge parameters, because the intensity of an emission line can be compared as a common parameter even under various discharge conditions. It is important to note that the self-bias voltage in the RF plasma was about half as high as the cathode drop in the DC plasma, implying that charged particles would have smaller kinetic energies in the cathode dark space of the RF plasma compared to the DC plasma.
25
Fig.2-2 Variations of the self-bias voltage as a function of the radio-frequency (RF) forward power (a) and the argon pressure (b). The 6.78-MHz RF glow discharge plasma was maintained at a constant argon pressure of 670 Pa (a) or at a constant RF power of 70 W (b).
26
2.3.2 Boltzmann plots of Fe I lines
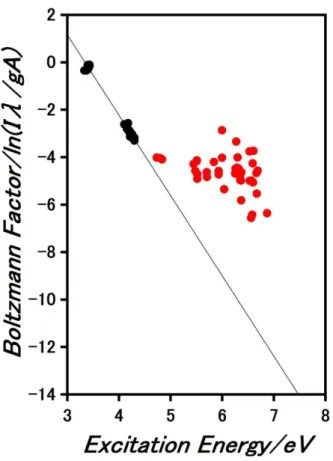
In 6.78-MHz RF plasma, a typical result of the Boltzmann plot of the Fe I lines was obtained at a forward power of 70 W, as shown in Fig. 2-3. The emission intensities were estimated from triplicate measurements, in which the relative standard deviation (RSD) was 1.27% as an average value for all of the Fe I lines. A linear relationship clearly appears in an excitation energy range from 3.4 to 4.4 eV, where 25 Fe I lines are all assigned to the optical transitions between quintet energy levels (the same spin multiplicity). The linear part had a negative slope of −3.3844 eV−1 whose correlation coefficient was −0.9953, and the standard error of the slope was calculated to be 0.1032 (3.1%) in the linear regression analysis. This linear Boltzmann plot implies that the corresponding excited levels may be populated by a dominant thermal process, such as collisions with thermalized electrons in the negative glow. On the other hand, the Boltzmann factors for 3 Fe I lines having an excitation energy of ca. 4.8 eV began to deviate from the straight line, and then plots in excitation energies of more than 5.6 eV did not follow the Boltzmann distribution at all. The excitation cross-section by electron collision depends on the type of total spin involved in the excitation, namely whether or not the corresponding excited level is optically forbidden [17]. In the energy levels of atomic iron, the triplet and septet excited levels, transitions of which are optically-forbidden to the ground state, might have a different behavior in the Boltzmann plot from the quintet excited levels (possible to be de-excited to the ground state), especially in a non-LTE condition. However, lots of quintet emission lines are also involved in the high-lying excitation energies of more than 5 eV, in addition to triplet and septet emission lines; nevertheless, any systematic variations, which may be attributed to the classification of the emission lines, are not observed but these emission lines are generally enhanced beyond the intensity level of the Boltzmann plot. Therefore, it is considered that the high-lying excited levels, independent of the spin multiplicity, would be populated in a different manner from the low-lying excited levels. All of these higher excited levels looked to be over-populated, when the linear relationship on the lower energy side was extrapolated towards higher excitation energies. Therefore, there would be any other excitation channels for the higher-lying excited levels, differing from the excitations for the lower-lying excited levels, and thus the corresponding process should be non-thermal. A previous study found a similar excitation-energy dependence of the Boltzmann plot for iron atomic lines in DC glow discharge plasma [7]. It is important to notice that the characteristic of the Boltzmann plot in the 6.7 MHz RF plasma is almost the same as that in the DC plasma.
27
a slope of the linear part, the excitation energy of which ranges from 3.3 to 4.3 eV in the Boltzmann plot. The temperature is probably determined by the average kinetic energy of energetic particles in the negative glow. Fig.2-4 shows a variation in the excitation temperature as a function of the forward power at an argon pressure of 670 Pa, indicating that it was in a narrow range of 3400–3500 K even when the RF power was varied in a wide range. The correlation coefficients of the linear regression for their Boltzmann plots were obtained to be −0.9953 at 60 W, −0.9953 at 70 W, −0.9954 at 80 W, −0.9947 at 90 W, and −0.9933 at 100 W. Therefore, these plots followed each linear relationship regardless of the RF power because the coefficients were very close to unity. Deviations of the excitation temperature were calculated from the standard error of their slopes in the excitation range of 3.3 – 4.3 eV in linear regression analysis. Their error ranges were ± 65 K at 60 W, ± 65 K at 70 W, ± 65 K at 80 W, ± 71 K at 90 W, and ± 80 K at 100 W, indicating an evidence that the temperatures could be determined with small deviations. Previous study in my laboratory has reported the excitation temperature in the case of DC glow discharge plasma within a voltage range in which stable discharges are maintained, through a similar procedure to the 6.78-MHz RF plasma [7]. The resultant temperatures for the Fe I lines were slightly elevated from 3350 to 3500 K with increasing applied DC voltage [7]. Indeed, they were in a similar range (ca 3500 K) even though the glow discharge was driven in two different power modes by using 6.78-MHz RF and DC power supplies.
On the other hand, the data plots in excitation energies of more than 4.8 eV deviated from the straight line, and thus they did not follow the Boltzmann statistics among the low-lying excited energy levels, as shown in Fig. 2-3. When the linear relationship among the low-lying excited levels is extrapolated towards higher excitation energy, a degree of deviation from the extrapolated line is estimated by defining an enhancement factor (EF) as follows [18]: EF = Iobs / Ibolz, where Iobs and Ibolz
are the observed and the extrapolated emission intensity of an iron atomic line, respectively. A typical semi-log plot of the enhancement factor for the Fe I lines as a function of the excitation energy is indicated in Fig.2-5. The EF value should be unity for all the Fe I lines if their excitations completely follow the Boltzmann distribution among the low-lying excited levels; therefore, the EF roughly represents an extent of any additional excitation for the high-lying excited levels. A large overpopulation of high-lying excited levels close to the ionization limit of iron atom was observed, to such a degree that their EFs exceeded 200. Further, the dependence of the log (EF) on the excitation energy was roughly fitted on a straight line having a positive slope (see Fig. 2-5). Fig.2-6 shows a variation in slope values in the linear relationship of the log (EF)
28
versus the excitation energy as a function of the forward power in the RF plasma. The slope values were almost unchanged with increasing RF power and they remained to be about 1.1. Therefore, contribution of the step-wise de-excitation process would occur to a constant extent, in the case of the 6.78-MHz RF glow discharge plasma. In a DC operation, the slope value had been measured similarly in a previous paper [7]. The resulting slope values were slightly reduced in a narrow range from 1.15 to 1.05 eV−1 with increasing discharge voltage. However, these values were very similar to those in the RF operation.
Fig.2-7 shows a variation in the excitation temperature as a function of the
argon pressure in 6.78-MHz RF plasma. In this experiment, the forward power was fixed to be at 70 W. The statistical evaluation was as the following: the correlation coefficients of the linear regression were estimated to be −0.9949 at 530 Pa, −0.9946 at 670 Pa, −0.9948 at 800 Pa, −0.9951 at 930 Pa, and −0.9938 at 1200 Pa. The error bars were ± 67 K at 530 Pa, ± 70 K at 670 Pa, ± 69 K at 800 Pa, ± 69 K at 930 Pa, and ± 81 K at 1200 Pa. The temperature became almost constant in a range between 3400 and 3700 K with an increase in the argon pressure. This result may be a little surprising, because the overall density of energetic electrons should be elevated along with increased collisions with argon gas. In fact, the net intensity of all the iron lines was larger with increasing the argon pressure. This result implies that the kinetic-energy distribution of ultimate electrons in the negative glow region would be less varied, even though the pressure of argon is widely varied. Also in DC plasma, a pressure dependence of the excitation temperature has been obtained, so that it is gradually elevated from 3300 to 3550 K with increasing discharge voltage [7]. A slight elevation of the excitation temperature was observed in the DC plasma; however, the effect was fairly limited and also the difference in the excitation temperature was very small between the RF and DC plasmas. Fig.2-8 indicates a variation in slope values in the linear relationship of the log (EF) versus the excitation energy, which is estimated with the same procedure as in Fig.2-6, as a function of the argon pressure in the 6.78-MHz RF plasma. In the RF plasma, the slope value remained to be ca. 1.15 even when the argon pressure increased. On the other hand, it has been reported that it is slightly reduced from 1.18 to 1.01 in the case of DC plasma [7]. Therefore, contribution of the non-thermal excitation process would occur to a constant extent in the 6.78-MHz RF plasma, whereas this contribution would become slightly smaller in the DC plasma especially at higher argon pressures, compared to the RF plasma.
29
Fig 2-3. Boltzmann plot for iron atomic lines in a 6.78-MHz radio-frequency (RF) glow discharge plasma when the RF forward power and the argon pressure was set to be 70 W and 670 Pa, respectively. Each value of the Boltzmann plot was calculated from the emission intensity of iron atomic lines having excitation energies of 3.3–6.9 eV.
30
Fig.2-4 Variation in the excitation temperature in a 6.78-MHz radio-frequency (RF) glow discharge plasma when the RF forward power was varied from 60 to 100 W. The temperature was estimated from a linear relationship of the Boltzmann plot for the iron atomic lines in an excitation-energy range of 3.3–4.4 eV, as indicated in Fig.2-3. Error bars were estimated from the standard error of the slope value in linear regression analysis of the Boltzmann plot.
31
Fig.2-5 Semi-log plot of an enhancement factor for iron atomic lines as a function of the excitation energy. The enhancement factor was defined by a ratio of the observed intensity to the expected intensity extrapolated from the linear part of the Boltzmann plot. The Boltzmann factors appeared in Fig.2-3 were employed for this estimation.
32
Fig.2-6 Slope of the linear regression line in the semi-log plot of the enhancement factor, expressed as a straight line in Fig. 2-5 , when the radio-frequency forward power was varied from 60 to 100 W. Linear relationships of the semi-log plot, such as Fig. 2-5, were observed at different RF forward powers. Error bars were estimated from the standard error of the slope value in linear regression analysis of the enhancement factor.
33
Fig.2-7 Variation in the excitation temperature in a 6.78-MHz radio-frequency (RF) glow discharge plasma when the argon pressure was varied from 530 to 1200 Pa. The RF forward power was fixed to be 70 W. The temperatures and their error bars were estimated using the same procedure as in Fig.2-4.
34
Fig.2-8 Slopes of the linear regression line in the semi-log plot of the enhancement factor, in the excitation energies of 4.8–6.9 eV, when the argon pressure was varied from 530 to 1200 Pa. The slope values and their error bars were estimated by using the same procedure as in Fig 2-6.
35
2.3.3 Consideration of the excitation mechanism
With respect to the low-lying excited levels, their excitations are caused probably by collisions with ultimate electrons, which have relatively low kinetic energy but occupy a majority of electrons in the plasma, and also fast ions and atoms in the negative glow region contribute to such collisions [19, 20]. It should be noted that the difference in the excitation temperature was very small between the RF and DC plasmas. Accordingly, the kinetic-energy distribution of the colliding partners, such as ultimate electrons, in the negative glow region would be similar to each other, under the condition that the pressure of argon was varied in a similar range.
With respect to the high-lying excited levels, their over-population behaviors would support a spontaneous radiative de-excitation process after the electron-recombination of iron ions, which are produced through any non-thermal process such as Penning-type ionization with argon metastables. The sequence of these reactions can be represented as follows:
Feg + Arm → Fe+ + Arg +e−,
Fe+ + e− → Fe⁎⁎ + hν′′ → Fe⁎ + hν′ ...,
where the asterisks mean excited states having different excitation energies, and g and m means a ground state and a metastable state, respectively. The Penning-type ionization is reported to be a major non-thermal process occurring in glow discharge plasma [21]. My observation implies that such excitations for the high-lying levels could occur beyond direct excitation processes with electron collision and to a similar extent between the RF and DC plasmas.
A collisional-radiative rate model was applied to investigate the excitation mechanism in plasmas, which successfully explained the population distribution of various excited states in inductively-coupled plasma [22]. Weiss et al. published scientific papers in which excitation channels of manganese atom/ion were analyzed in glow discharge plasma using several gases, based upon a transition rate diagram [23, 24]. They indicated that the excitation of low-lying excited levels of manganese atom, relating to the resonance atomic lines, was caused by collisions with electrons in the negative glow and/or by fast heavy particles in the region close to the cathode, and that there were particular / selective channels for the cascade decay after higher excitation levels of manganese atom were directly excited, depending on the spin multiplicity [23]. In my analysis on the Boltzmann plot of iron atom, the high-lying excited levels seemed to be excited/de-excited almost independent of the spin multiplicity, even though these excited levels belonged to several different spin multiplicities. A possible explanation for this is that all of the low-lying excited levels have the same spin multiplicity
36
(quintet), and that iron atom has so many de-excitation channels among high-lying excited levels, which are derived from complicated splitting of energy levels just below the ionization limit. In addition, the transition probabilities for several emission lines from high-lying levels were reported with relatively large uncertainties in the database (they were ranked as ‘D’ which meant the uncertainty within 50%) [13]. This might be a reason why any effect concerning the spin configuration is not recognized to an extent that it can be clearly read in the Boltzmann plot. For the present study, I note an experimental result that the high-lying excited levels are generally over-populated beyond the uncertainty factors, and I consider that the major reason would be their step-wise de-excitations as a spontaneous process occurring after the electron recombination of iron ion.
37
2.4 Summary
The Boltzmann characteristics for Fe I emission lines were investigated in a 6.78-MHz RF glow discharge plasma, in comparison with a conventional DC plasma, when a Grimm-style excitation source, was employed. Their Boltzmann plots demonstrated that the excitation phenomenon was controlled in a different manner depending on the excitation energy of emitting species. However, the fundamental process occurred to be analogous between these different power supply modes. A thermal excitation mechanism worked dominantly for excitations of low-lying excited levels of iron atom, so as to follow a Boltzmann distribution, which would occur in the negative glow region through collisions with ultimate electrons. The excitation temperature was in a narrow range of 3400 – 3600 K, which was hardly affected by the forward RF power and the argon pressure in the discharge chamber, and the temperature was in a similar range in the DC glow discharge plasma. This result probably implied that glow discharge plasma could be supported by a self-stabilized negative glow region in which the kinetic energy of electron would be determined under a uniform potential distribution [25], and eventually this region would be less affected by external discharge parameters as far as a stable glow discharge can be maintained not only in the DC plasma but in the RF plasma. An additional excitation, which would be derived from step-wise de-excitation channels after Penning-type ionization of iron atom, resulted in overpopulation in the energy levels having higher excitation energies, thus causing a positive deviation from the normal Boltzmann distribution. Whereas the high-lying excited levels seemed to be over-populated, any selective channel for de-excitations among them was not observed in the Boltzmann plot. This overpopulation occurred to a similar extent between the 6.78-MHz RF plasma and the DC plasma. These results suggested that glow discharge plasma could be supported by a self-stabilized negative glow region, where the kinetic energy distribution of the particles was not changed so largely by the discharge parameters in the RF and DC plasmas, as far as a stable discharge could be maintained.
38
REFERENCES
[1] R. Payling, D.G. Jones, S.A. Gower, In search of the ultimate experiment forquantitative depth profile analysis in glow discharge optical emission spectrometry,Part I: calibration curves, Surf. Interface Anal. 23 (1995) 1–11.
[2] A. Bengtson, T. Nelis, The concept of constant emission yield in GDOES, Anal.Bioanal. Chem. 385 (3) (2006) 568–585.
[3] K.A. Marshall, T.J. Casper, K.R. Brushwyler, J.C. Mitchell, The analytical impact ofpower control in a radio frequency glow discharge optical emission plasma, J. Anal.Atom. Spectrom. 18 (2003) 637–645.
[4] P.W.J.M. Boumans, Theory of Spectrochemical Excitation, Plenum Press, New York,USA, 1966.
[5] K. Wagatsuma, Y. Danzaki, Non-Boltzmann distribution among energy levels ofsingly-ionized vanadium in dc glow discharge and rf inductively coupled dischargeplasmas, J. Anal. Atom. Spectrom. 14 (1999) 1727–1730.
[6] K. Wagatsuma, Some observation of an anomalous excitation behavior of chromiumemission lines in an argon radio-frequency powered glow discharge plasma,Spectrochim. Acta B 58 (2003) 565–573.
[7] L. Zhang, S. Kashiwakura, K. Wagatsuma, Boltzmann statistical consideration on theexcitation mechanism of iron atomic lines emitted from glow discharge plasmas,Spectrochim. Acta B 66 (2011) 785–792.
[8] L. Zhang, S. Kashiwakura, K. Wagatsuma, Deviation from Boltzmann distribution inexcited energy levels of singly-ionized iron in an argon glow discharge plasma foratomic emission spectrometry, Spectrochim. Acta B 67 (2012) 24–31.
[9] X. Zhang, K. Wagatsuma, Emission characteristics of 6.78-MHz radio-frequencyglow discharge plasma in a pulsed mode, Spectrochim. Acta B 133 (2017) 72–80.
[10] Z.Weiss, E.B.M. Steers, J.C. Pickering, Transition rate diagrams and excitation oftitanium in a glow discharge in argon and neon, Spectrochim. Acta B 144 (2018)20–28.
[11] X. Zhang and K. Wagatsuma, Comparative investigation of the emission characteristics between 6.78-MHz radio-frequency and direct-current glow discharge plasma for atomic emission spectrometry, Spectrochim. Acta B, 147 (2018), 109-114. [12] W. Grimm, Eine neue Glimmentladungslampe für die optischeEmissionsspektralanalyse, Spectrochim. Acta B 323 (1968) 443–454.
39
[13] J.R. Fuhr, W.L. Wiese, A critical compilation of atomic transition probabilities forneutral and singly ionized Iron, J. Phys. Chem. Ref. Data 35 (2006) 1669–1809. [14] J. Sugar, C. Corliss, Atomic energy levels of the iron-period elements: potassiumthrough nickel, J. Phys. Chem. Ref. Data 14 (Suppl. 2) (1985) 407–420. [15] ISO14707, Surface Chemical Analysis - Glow Discharge Optical EmissionSpectrometry (GD-OES) - Introduction to Use, (2016).
[16] R.K. Marcus, J.A.C. Broekaert, Glow Discharge Plasmas in Analytical Spectroscopy,John Wiley & Sons, Chichester UK, 2003 (Chap. 3).
[17] K. Takayanagi, Collision of Electron, Atom and Molecule, Baifukan, Tokyo, 1972(Chap 5).
[18] K. Wagatsuma, K. Satoh, Estimation using an enhancement factor on nonlocalthermodynamic equilibrium behavior of high-lying energy levels of neutral atom inargon radio-frequency inductively coupled plasma, Anal. Sci. 32 (2016) 535–541.
[19] A. Bogaerts, R. Gijbels, R.J. Carman, Collisional-radiative model for the sputteredcopper atoms and ions in a direct current argon glow discharge, Spectrochim. ActaB 53 (1998) 1679–1703.
[20] A. Bogaerts, Z. Donko, K. Kutasi, G. Bano, N. Pinhao, M. Pinheiro, Comparison ofcalculated and measured optical emission intensities in a direct current argon/copper glow discharge, Spectrochim. Acta B 55 (2000) 1465–1479.
[21] A. von Engel, Ionized Gases, Clarendon Press, Oxford UK, 1965.
[22]P.W.J.M. Boumans, Inductively Coupled Plasma Emission Spectroscopy Part II,John Wiley & Sons, New York USA, 1987 (Chapter 11).
[23] Z. Weiss, E.B.M. Steers, J.C. Pickering, S. Mushtaq, Transition rate diagrams - a newapproach to the study of selective excitation processes: the spectrum of manganesein a Grimm-type glow discharge, Spectrochim. Acta B 92 (2014) 70–83. [24] Z. Weiss, E.B.M. Steers, J.C. Pickering, Transition rates and transition rate diagramsin atomic emission spectroscopy: a review, Spectrochim. Acta B 110 (2015) 79–90.
40
CHAPTER 3
3. Emission Characteristics of 6.78-MHz Pulsed RF Glow Discharge
Plasma
3.1 Introduction
This chapter describes Boltzmann plots for both atomic and ionic emission lines of iron in an argon glow discharge plasma driven by 6.78-MHz radio-frequency (RF) voltage in a pulsed operation, in order to discuss how the excitation/ionization process is affected by the pulsation [1]. For this purpose, a pulse frequency as well as a duty ratio of the pulsed RF voltage was selected as the experimenter parameters. A Grimm-style radiation source was employed as the excitation/emission source. A Boltzmann plot for low-lying excited levels of iron atom was investigated when the pulse frequency as well as the duty ratio was varied. This observation suggested that the RF plasma could be supported by a self-stabilized negative glow region, where the kinetic energy distribution of the electrons would be changed to a lesser extent. Additional non-thermal excitation processes, such as a Penning-type collision and a charge-transfer collision, led to deviations (overpopulation) of particular energy levels of iron atom or iron ion from the normal Boltzmann distribution. However, their contributions to the overall excitation/ionization were not altered so greatly, when the pulse frequency or the duty ratio was varied in the pulsed RF glow discharge plasma.
3.2 Experimental
The measuring system is the same as the one used in Chapter 2. The RF power was conducted from a matching circuit (MB-300, Yamamoto Vinita Co. Ltd., Japan) to the back of the sample electrode, while the hollow-anode as well as the lamp body were grounded [2]. The matching circuit was connected with a 6.78-MHz RF power generator (RF-300, Yamamoto Vinita Co. Ltd., Japan) with a coaxial cable. The forward power was fixed at 70 W in the continuous mode and the power of 70 W was controlled on a directional wattmeter in the pulsed mode, while the reflected power was able to be controlled to be less than 0.2 W in all the measurements. The pulsed mode was conducted with a function generator (AFG-2005, TEXIO Technology Corp., Japan), where the frequency ranges from 0 (continuous) to 617 Hz at a duty ratio of 50%, and further, the duty ratio of a square wave was varied from 10 to 50% at a pulse frequency of 77 Hz. In the pulsed discharge, a time-averaged value of the self-bias voltage (effective value) was measured on a digital voltmeter (DME1500, Kikusui Electronics
41
Corp., Japan) at a time constant of about 1 s, after the RF component was separated through a low-pass filter circuit having a cut-off frequency of 80 kHz [2].
An iron plate (99.8% purity) was prepared as the sample. It was polished with water-proof emery papers (No.180 - No.600) and then rinsed with ethanol. Before the measurement, pre-discharge was carried out for 5–10 min to remove the surface contaminants. After evacuating down to 1.3 Pa in the discharge chamber, high-purity argon was introduced with a gas pressure maintained during the measurement. The pressure of the plasma gas was measured with a Pirani gauge, whose readings had been corrected for argon gas, at the vacuum port of the discharge chamber.
A monochromator-based spectrometer equipped with a photomultiplier (P-5200, Hitachi Ltd., Japan) was employed for the emission measurement [3]. The focal length is 0.75 m and the grating has 3600 grooves/mm at a blaze wavelength of 200 nm, yielding a reciprocal linear dispersion of 0.29 nm/mm. The emission signal was averaged through a low-pass filter circuit having a time constant of ca. 1 s. Emission lines for analysis of the Boltzmann distribution, the atomic lines (Fe I) [4] and the ionic lines (Fe II) [5], have already been listed in the previous papers. 42 emission lines of the Fe I, whose excitation energies range from 3.3 to 6.9 eV, were chosen in a wavelength range of 368 – 385 nm [6]. These Fe I lines are classified into three groups: 3d74p - 3d74s, 3d64s4p - 3d74s (3d64s2), and 3d64s4d - 3d64s4p optical transitions [7]. The ground state of iron atom is the energy level of 5D4 (0.00 eV) in the 3d64s2 electron configuration. In the Fe II lines, I selected a set of the ionic lines in a wavelength range of 234 – 264 nm, comprising 88 emission lines having excitation energies from 4.7 to 9.0 eV [6]. These Fe II lines are classified into three groups: 3d64p - 3d64s, 3d64p - 3d7, and 3d54s4p - 3d54s2 optical transitions [7]. The 3d64s electron configuration gives the ground state of iron ion, including the lowest energy level of 6D9/2 (0.00 eV). Any correction for the wavelength-dependent sensitivity of the spectrometer system was not needed within each narrow wavelength range of the Fe I and Fe II lines.
For comparison, previous papers regarding a DC glow discharge plasma are cited [4], [5], where the analysis of the Boltzmann plots has been carried out at an argon pressure of 530 Pa in a DC voltage range of 500 – 900 V. The Boltzmann analysis in the DC plasma has been carried out using the same experimental setup for the excitation source as well as spectrometer system as that of this study in the 6.78-MHz RF plasma.