Dissertation
Mathematical and Experimental Study of Anaerobic Digestion
Process and Biogas Generation from Fruit and Vegetable Waste
August, 2017
Puteri Kusuma Wardhani Graduate School of
Environmental and Life Science (Doctor’s Course)
OKAYAMA UNIVERSITY
Abstract
Anaerobic digestion is a biochemical process in which microorganism break down the biodegradable material into biogas (methane and carbon dioxide) under the absence of oxygen. It has been used to treat many types of waste, not only due to energy production but also because it reduces pollutant. Since the complexity and operational stability of anaerobic digestion process may lead to the process failure, understanding of its process dynamics and operation optimizations become necessary. Mathematical modeling and simulations are essential tools for these purposes. Many mathematical models have been proposed and they are available in literature to obtain an optimal anaerobic digestion process. Nevertheless, the applicability of those models may be limited by complexity of anaerobic processes.
The general objective of the thesis is to develop mathematical models suitable to describe anaerobic digestion process of fruit and vegetable waste for process optimization. Scope of the thesis are as follows: Laboratory scale experiment to generate data of accumu- lated methane concentration and biogas volume obtained from fruit and vegetable waste as substrates and sludge from biogas plant as inoculum; Introduction of experimental outcomes into inverse problems of methane generation process; Numerical solution of the inverse problems and estimation kinetic parameters from proposed models; Simulation of a methane co-fermentation process with outcomes form the analysis.
Ordinary Differential Equation (ODE) model of anaerobic digestion processes of fruit and vegetable waste was constructed. The first-order model and Monod model were applied.
Numerical results obtained were compared with experimental data, and showed a good agreement. However, the model incapable of describing anaerobic digestion under inhi- bitions. The kinetic parameters from proposed models were determined by solving the problems numerically. The method used was trial error method, however this method is time consuming.
The modification of model by Grau (1975) was proposed, and it was implemented in Mat- lab. Nonlinear least squares problem for determination of model parameters was solved with the nlinfit, in which the Lavenberg-Marquardt method is applied. The numerical results and experimental data were compared. The results lead to the conclusion that the Levenberg-Marquardt method demonstrated excellent performances for the nonlinear fitting task. Further, simulation results showed a good agreement with the experimental results.
ACKNOWLEDGMENT
I would like to convey my gratitude to the MEXT for granting scholarship for the comple- tion of my doctoral studies. I also would like to thank the Okayama Prefectural Livestock Research Institute (Chikusan Kenkyuujo) for providing the inoculum for this study. This work was partly supported by JSPS KAKENHI Grant Number 16K05276.
My deepest gratitude goes to Prof. Watanabe Masaji for allowing me to carry out my PhD studies under his supervision. His great expertise and unconditional guidance were essential for the successful completion of my PhD. Special thanks go to Prof. Md Azhar Uddin from Lab of Material and Energy Science for his mentorship in the development of the anaerobic reactor, advice on experimental decisions, and management support.
Special thanks also go to Prof. Kameshima Yoshikazu for his guidance in experimental analysis.
In a more personal level, I would like to thank my friends for the amazing experiences lived during the past years. My world was greatly broaden thanks to your friendship that kindly warmed my heart and for which I will always be very grateful. Finally and more deeply, I would like to thank my family for all their unconditional love and support. You taught me all the principles that guide my life and everything I am is because of you.
Everything I have accomplished I owe it to you. Hence, this thesis is dedicated to you as it is more yours than mine.
Contents
Abstract i
ACKNOWLEDGMENT ii
1 Introduction and Problem Statement 1
1.1 General Objective . . . 1
1.2 Prior Studies . . . 2
1.2.1 Modeling of Anaerobic Digestion Processes . . . 2
1.2.2 Modeling Anaerobic Digestion of Fruit and Vegetable Waste . . . . 3
1.3 Scope of the Thesis . . . 4
2 Background and Selected Basic Considerations 5 2.1 Anaerobic Digestion of Fruit and Vegetable Wastes . . . 5
2.1.1 Introduction . . . 5
2.1.2 Stages of Anaerobic Digestion Process . . . 6
2.2 Co-digestion process . . . 8
2.3 Biochemical Reactions of Substrates and Products . . . 8
2.3.1 Carbohydrates . . . 9
2.3.2 Lipids . . . 9
2.3.3 Proteins . . . 9
2.3.4 Volatile Fatty Acids . . . 9
2.4 Biogas . . . 10
2.5 Environmental Factor Influencing the Anaerobic Digestion Process of Fruit and Vegetable Waste . . . 10
2.5.1 Temperature . . . 10
2.5.2 pH . . . 11
2.6 Experimentation Mode . . . 12
2.6.1 Batch Operation . . . 12
2.6.2 Single-stage VS Two-Stage Operation . . . 13
2.7 Operational Conditions of Anaerobic Digester . . . 14
2.8 Basic Models: Kinetics of Biogas Formation from Fruit and Vegetable Waste 16 2.8.1 Kinetics of Microbial Growth: Monod Model . . . 16
2.8.2 Kinetics of Substrate Degradation . . . 17
2.8.3 Kinetics of Product Formation . . . 19
3 Material and Methods 20
3.1 Lab-Scale Digester . . . 20
3.2 Substrate and inoculum . . . 20
3.3 Chemical Analysis Methods . . . 20
3.3.1 COD analysis - Potassium permanganate acidic method . . . 20
3.3.2 Total Solids . . . 21
3.4 Mathematical model of anaerobic digestion of fruit and vegetable waste . . 21
3.4.1 Monod Model . . . 22
3.4.2 P. Sosnowski Model . . . 23
3.4.3 Grau Model . . . 24
3.5 Analysis Method . . . 25
3.5.1 The Monod Model . . . 25
3.5.2 The P. Sosnowski Model . . . 26
3.6 Inverse Problem . . . 27
3.7 Description of Numerical Schemes . . . 28
3.7.1 Levenberg-Marquardt . . . 28
4 Results and Discussion 33 4.1 Experimental Results . . . 33
4.2 Numerical Results . . . 37
4.2.1 The Monod Model . . . 37
4.2.2 The P. Sosnowski Model . . . 39
4.2.3 The Grau Model . . . 40
4.3 Discussions . . . 47
4.3.1 Limitation of Experiments . . . 47
4.3.2 Limitation and Applicability of Proposed Models . . . 50
5 Conclusion 53 5.1 Modeling Anaerobic Digestion of Fruit and Vegetable Waste . . . 53
5.2 Further Studies . . . 54
A Monod Model 55
B P. Sosnowski Model 64
C Grau Model 75
Reference 98
List of Figures
2.1 Reaction Scheme of Anaerobic Digestion of Fruit and Vegetable Waste (Based on H. Bouallagui et al. 2005 [11]) . . . . 6 2.2 Relative growth rate of methane-forming bacteria under different temper-
ature conditions (Based on a result by Gradyet al. 2011 [59]) . . . . 11 2.3 Effect of pH on maximum specific growth rate of bacteria (Based on a
result by Gerberet al. 2008 [36]) . . . . 12 2.4 One-stage anaerobic digester (Based on results by Gerardi, 2003 [35]) . . . 14 2.5 Two-stage anaerobic digester (Based on results by Gerardi, 2003 [35]) . . . 15 2.6 Specific growth rate of bacteria depending on substrate concentration (Based
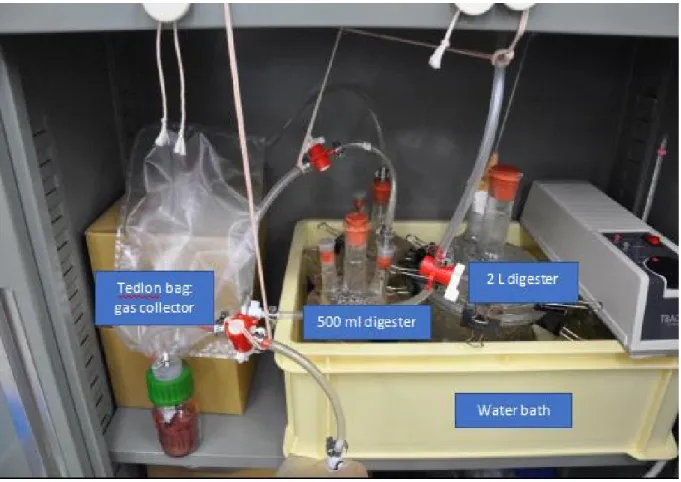
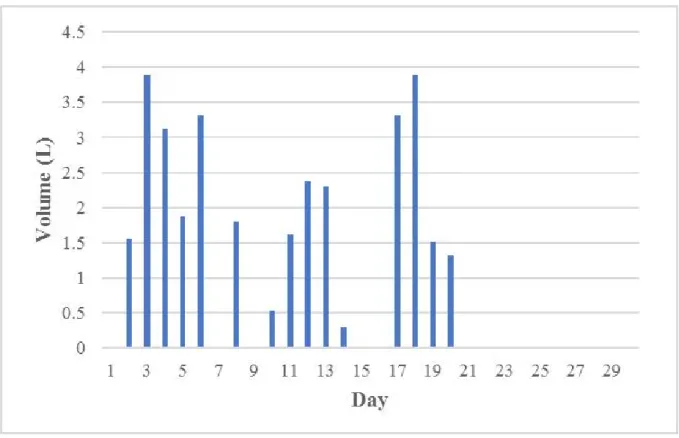
on work by Monod, 1949 [36]) . . . 17 3.1 Experimental set up for 50 L digester [46] . . . 31 3.2 Experimental set up for 500ml and 2000 ml digester . . . 32 4.1 Biogas production of 50 L batch digester with fruit and vegetable waste and
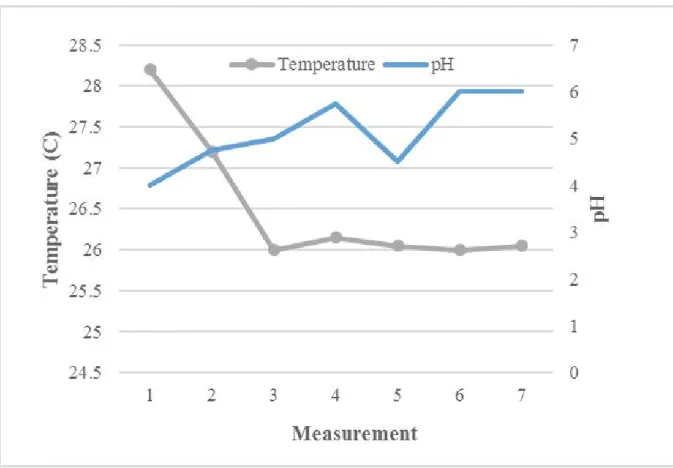
horse dung as substrate and inoculum, respectively. Daily measurement of biogas volume was recorded (in L) [47] . . . 34 4.2 pH and temperature recorded from experiment with 50 L digester . . . 35 4.3 Concentration of methane and carbon dioxide measured on day 16 and day
30, performed with 50 L digester . . . 36 4.4 Concentration of methane, carbon dioxide, and nitrogen performed with
500 ml digester . . . 37 4.5 Concentration of methane and carbon dioxide performed with 500 ml di-
gester under temperature 40 and 45oC, respectively . . . 38 4.6 Concentration of methane and carbon dioxide performed with 2 L digester 39 4.7 Biogas volume performed with 2 L digester [46] . . . 40 4.8 Biogas volume performed with 50 L digester: Comparison between numer-
ical results (line) and experimental results (dots) [47] . . . 41 4.9 Concentration of methane performed with 50 L digester: Comparison be-
tween numerical results (line) and experimental results (dots) [47] . . . 42 4.10 Concentration of carbon dioxide performed with 50 L digester: Comparison
between numerical results (line) and experimental results (dots) [47] . . . . 43 4.11 Numerical results of methane and carbon dioxide concentration based on
the Monod model [47] . . . 44 4.12 Comparison between numerical results and experimental results based on
the P. Sosnowski model (line: simulation, dots: experimental [48] . . . 45 4.13 Numerical results based on the P. Sosnowski model: Degradation of sub-
strate (red) and volatile fatty acid (green) [48] . . . 46
4.14 Numerical results based on the Grau model: comparison of numerical re- sults with experimental results [49] . . . 47 4.15 Numerical results based on the Grau model: S denotes as Substrate, X
denotes as bacteria, and P denotes as methane [49] . . . 48 4.16 Accumulated methane and carbon dioxide concentration generated from 2
L batch anaerobic digester with fruit and vegetable waste and sludge from biogas plant as substrate and inoculum, respectively [49] . . . 49
List of Tables
4.1 Experimental Results under Different Temperature Condition . . . 34 4.2 Results of Parameter Estimation Based on The Monod Model [47] . . . 38 4.3 Description of Kinetics Parameter Used in the P . Sosnowski Model [48] . . 40 4.4 Results of Parameter Estimation Based on The Grau Model [49] . . . 45
Chapter 1
Introduction and Problem Statement
1.1 General Objective
Environmental pollution by solid waste is one of the major problems that human being face in the twenty-first century. The quantity and characteristic of solid waste arising from many activities are the results of growing population and increasing standards of living and technology, and abundance of natural resources [3]. Solid waste contributes significantly to the contamination of the environment by polluting the main elements (soil, water, and air) [2]. In the past, the amount of waste was small, therefore the environment was able to absorb it, causing just a few environmental problems. In modern times, solid waste has become one of the most crucial environmental problems. It poses a constant threats to humans and the environment, because some type of waste are toxic and unsafe [1, 4, 5].
Sustainability is the key to the solution to prevent or reduce those issues. One of the most effective and sustainable approach is to apply anaerobic biotechnology as an alternative [6]. This technology combines waste treatment with the retrieval of useful byproducts, and leads to valuable energy (hydrogen, butanol, and methane) and valuable products (biosolids, organic acids, etc.) [6]. It has been used to process many types of wastes, such as food waste, fruit and vegetable wastes, household waste, agricultural waste, and the organic compound of municipal solid wastes [5].
Anaerobic digestion is a biochemical process in which microorganisms break down the biodegradable material into biogas (methane and carbon dioxide) anaerobically [7]. The process consists of several stages. Firstly, complex organic compounds are hydrolyzed to simpler organic compounds. Secondly, they are fermented to volatile fatty acids by acidogen bacteria. Those microbes are generally both facultative and obligate anaerobic bacteria, which become the most essential factor in the anaerobic process. The stability of the process depends on the environmental conditions, such as pH, temperature, and dissolved oxygen. The latter stage is methane and carbon dioxide formation from fatty acids by methane-generate bacteria. The entire process results in the reduction of organic substance in the waste [1].
Despite many benefits of anaerobic digestion process, the process is burdened by complex- ity, poor practical and operational stability, high sensitivity to changes of environmental conditions, long retention and start-up times, and highly polluted supernatant, which pre- clude this technology from being used optimally [5]. Many researchers have investigated various potential methods to solve the problems mentioned, particularly in anaerobic di-
gestion process of fruit and vegetable waste (H. Bouallaguiet al., 2003 [8]; H. Bouallagui et al., 2004a [9]; 2004b [10]; H. Bouallagui et al., 2005 [11]; H. Bouallagui et al., 2009 [12]). Those studies focused on the optimal conditions for biogas conversion from fruit and vegetable waste, and developed the high rate anaerobic reactors for digester performance.
1.2 Prior Studies
Anaerobic digestion is the most complex process which has substantial chance for it to become unstable and eventually break down. It is important to understand the kinetics of anaerobic digestion process, which enables us to predict the operation of digester. It can also contribute to the understanding of the biodegradation process [1]. Mathematical modeling and simulation can be an excellent tool for these purposes.
In general, mathematical model can be categorized into two groups of types; dynamic or non-dynamic and white-box, grey-box or black-box model. Dynamic models are capable of making continuous predictions in time, while the non-dynamic models only predict one time-independent variable. Dynamic models consist of several ordinary differential equations (ODE’s), based on mass balance principles. Non-dynamic white-box models link up substrate to products on stoichiometric grounds. The difference between white- box, grey-box and black-box models is the amount of a prior selective data. White-box models use a prior selective data for description of the biochemical reactions occurring during digestion process. Black-box models empirically relate the input directly to the output without including any prior knowledge of the physical and chemical reactions.
Grey-box models are those in which the parameters have a physical representation that is adjustable, for example, a parameter estimation procedure [13].
A general application of a mathematical model consists of six steps. The first step is model selection. A choice has to be made between data-driven or mechanistically influenced models. The second step is parameter selection for calibration. This selection should be based on an evaluation of the identifiability of the specific parameters. The third step is data collectioni.e.experimental measurements. The fourth step is parameter estimation.
Various cost functions or objective functions have been used for this step, such as least squares, least-modulus, or maximum likelihoods. Also, a large number of minimization algorithms have been applied: the Gauss-Newton method, the steepest descent method, the Levenberg-Marquardt method (combination of Gauss-Newton method and steepest descent method), and genetic algorithms. The fifth step is accuracy estimation, where the uncertainty is determined. Confidence intervals for the estimated parameters can be developed. If the estimated uncertainty is too large, additional data should be introduced.
At the final step, outcomes should be subjected to a validation procedure the calibration and individually obtained data. A visual review, in which the tendency of the predictions is compared with the measurements, can also be helpful [13].
1.2.1 Modeling of Anaerobic Digestion Processes
Several mathematical models of anaerobic digestion process have been developed. The first modeling was motivated by the demand for efficient operation of processes in the 1940’s (Monod, 1949[14]; Contois, 1959[15]; Chen-Hashimoto, 1978[16]; Hill and Barth, 1977[17]; Hill, 1982[18]). Monod suggested the non-linear relation between specific growth
rate and limited substrate concentration. The specific growth rate increases strongly for low substrate concentration and slowly for high substrate concentration, until a satura- tion of bacteria is reached. Contois proposed that the specific growth rate was considered as a function of the growth-limiting nutrient in both input and effluent substrate con- centration. On this groundwork, Chen-Hashimoto developed kinetic models for substrate utilization and methane production. They suggested that the Contois model would be more suitable than the Monod model to predict digester performance. Hill and Barth (1977) considered anaerobic digestion process as a multi-step process where one slower step controls the global rate. Nonetheless this model was unable to adequately depict the process performance, particularly under transeunt conditions. Hill (1982) considered the concentration of volatile fatty acids as the key parameter, incorporating acidogenesis and acetogenesis into modeling.
Further studies led to a comprehensive model detailing the production and degradation pathways of intermediates (Angelidaki et al., 1993[19], 1999[20]; Siegrist et al., 1993[21];
Vavilin et al., 1994[23], 1995[24]; Batstone et al., 2000[25]). Those models involved ad- ditional processes and species, to detailed kinetics with inhibition and many kind of substrates. Nevertheless, practical applications have been limited by diversity and com- plexity of the models [26].
The Anaerobic Digestion Model No.1 (ADM1), was recently introduced by the IWA Task Group for Mathematical Modeling of Anaerobic Digestion Processes for the reason de- scribed above. It formulates dynamics of 24 species and involves 19 bioconversion pro- cesses. However, large number of parameters and difficulties in their identifiability were the major drawbacks of ADM1. Also, despite the adequate representation of relevant physical processes by the ADM1 model, many reactions can occur quickly without the overall process dynamic [27].
1.2.2 Modeling Anaerobic Digestion of Fruit and Vegetable Waste
Only few studies have been reported modeling and simulation of anaerobic digestion process of fruit and vegetable waste. Mata Alvarez et al. (1993) [28] reviewed several models for methanization of a batch two-phase anaerobic digestion of fruit and vegetable wastes. Three selected and tested models in the investigation were the first-order model, the Monod model, and the Chen-Hashimoto model. Sosnowski et al. (2008) developed a mathematical model based on the first-order model and the Monod model for kinetic investigations of co-fermentation processes [29]. A simplified model of the first-order was developed by Siles et al. (2008)[30] for studying the anaerobic digestion of wastewater derived from the orange rind as by-product of orange juice production. Mathematical models based on the Monod model was also developed by Vavilin (2010)[31] for descrip- tion of methane yield from organic waste. The first-order model was also proposed for formulation of biogas generationeg. Li Chenet al. (2011)[32] and Kafleet al. (2014)[33].
Most of those models reported above were based on the Monod model and the first-order model, and well performed in practical applications.
1.3 Scope of the Thesis
As explained above, many mathematical models are developed and available in literature in order to obtain an optimal anaerobic digestion process. Nevertheless, applicability of the models may be limited by diversity and complexity of anaerobic processes. Com- plexity of the models is not necessarily equated to accuracy. The general objective of the thesis is to develop a simple mathematical models which is suitable for description of anaerobic digestion process of fruit and vegetable waste. The scopes of the thesis are as follow:
1. Laboratory scale experiment to generate data of accumulated methane concentration and biogas volume obtained from fruit and vegetable waste as substrates and sludge from biogas plant as inoculum;
2. Introduction of experimental outcomes into inverse problems of methane generation process;
3. Numerical solution of the inverse problems and estimation kinetic parameters from proposed models;
4. Simulation of a methane co-fermentation process with outcomes form the analysis.
The contents of the thesis are organized as follows:
Chapter 1 contains the motivation behind the study and key aspects of mathematical modeling and numerical simulation of anaerobic digestion process.
In Chapter 2, selected basic considerations which are the most relevant to the biotechno- logical processes are presented.
Chapter 3 encompasses laboratory scale experiment, as well as chemical analysis and mathematical model used.
Chapter 4 presents the results of experiment of biogas from fruit and vegetable wastes, mathematical modeling of anaerobic digestion process, and results of simulation based on the proposed models. Limitation of both experimental and numerical results are de- scribed.
Chapter 5 presents the general conclusion concerning findings and contributions of this study, together with important outlines to be considered for further studies.
Chapter 2
Background and Selected Basic Considerations
2.1 Anaerobic Digestion of Fruit and Vegetable Wastes
2.1.1 Introduction
The estimated fruit and vegetable wastes percentage for each commodity group in each food supply chain, according to Food and Agricultural Organization (FAO), are 15, 9, 25, 10 and 7% in agricultural production, post-harvest handling and storage, processing and packaging, distribution and consumption respectively in South and South-East Asia [34]. In general, solid waste generated in traditional markets including fruit and vegetable wastes are disposed in municipal landfill and caused environmental problems [11].
The central food distribution market in Barcelona produces fruit and vegetable waste around 90 tonnes per day during 250 days per year. In Tunisia, fruit and vegetable waste collected from the market has been measured and estimated to be 180 tons per month. In India, fruit and vegetable waste constitute about 5.6 million tonnes annually and currently those wastes are disposed by dumping on the periphery of the cities [11].
Mostly, anaerobic digestion process with fruit and vegetable wastes contains volatile solids (VS) about 80-90%, and water content about 75-95%. Those are the main cause of heavy odor and plenty of leachate during collection, transportation and landfill of this wastes.
Anaerobic digestion has been suggested as an alternative for handling organic waste for recovery of renewable energy. Some research groups have developed different anaerobic digestion processes for fruit and vegetable wastes [11].
The anaerobic degradation of cellulose-poor wastes like fruit and vegetable waste is limited by methanogenesis rather than by hydrolysis, although anaerobic digestion of particulate form is more likely limited by hydrolysis. One of the causes is a rapid acidification of wastes in the reactor, and another is a larger volatile fatty acids production, which inhibits the activity of methanogenic bacteria [12].
Fruit and vegetable wastes must undergo some pre-treatments before being loaded to the digesters. They are shredded to small particles and homogenized to facilitate optimal digestion process, and then diluted for decrease of the concentration of organic matter.
Some studies also soggste buffer of wastes by the addition of sodium hydroxide solutions for increase of pH of fruit and vegetable wastes. Those wastes are also pre-treated at high temperature for improvement of the efficiency [11].
Figure 2.1: Reaction Scheme of Anaerobic Digestion of Fruit and Vegetable Waste (Based on H. Bouallagui et al. 2005 [11])
2.1.2 Stages of Anaerobic Digestion Process
Biomethanation of fruit and vegetable wastes process is accomplished by four stages of biochemical transformation. Those stages are hydrolysis, acidogenesis, acetogenesis, and methanogenesis. The whole processes is shown on Fig. 2.1.
Hydrolysis
Hydrolysis is the splitting of a compound with water [35]. Generally, the main components of organic matter are carbohydrates, fats, and proteins [36]. In this stage, undissolved compounds of carbohydrates, proteins, and fats are broken down into monomers (water- soluble fragments) by exoenzymes (hydrolase) of facultative and obligatorily anaerobic bacteria [37]. The hydrolysis of carbohydrates takes place within a few hours, while the hydrolysis of proteins and lipids within a few days. Lignocellulose and lignin are degraded only slowly and incompletely [37].
Particulate organic materials of fruit and vegetable waste such as cellulose, hemicellulose, pectin and lignin, must undergo liquefaction by extracellular enzymes before being ab- sorbed by acidogenic bacteria. The rate of this stage is limited by several factors, such as pH, temperature, composition and particle size of the substrate and high concentrations of intermediate products [11].
Acidogenesis
Soluble organic components including products from hydrolysis are converted into organic acids, alcohols, hydrogen, and carbon dioxide by acidogens, and then further converted into acetic acids, hydrogen, and carbon dioxide. Those products results from hydrolysis.
They are discharged into the medium inside the digester, and degraded by a large di- versity of facultative anaerobes and anaerobes through many fermentative process. The degradation of those compounds results in the production of carbon dioxide, hydrogen gas, alcohols, organic acids, some organic-nitrogen compounds, and some organic-sulfur compounds [11, 35].
For example, the degradation process of monosaccharides, important products and stoi- chiometric reactions from glucose degradation are presented as follows [56].
Acetate: C16H12O6+ 2H2O−→2CH3COOH + 2CO2+ 4H2 (2.1)
Butyrate: C16H12O6 −→CH3CH2CH2COOH + 2CO2+ 2H2 (2.2) Acetogenesis
Acetogenesis occurs in the acid-forming stage. Many of acids and alcohols, including butyrate, propionate, and ethanol, are produced during acid-forming stage, and they are degraded to acetate. The acetate is generated through the activity of acetogenic or acetate-forming bacteria. Acetate is an essential substrate used by methane-forming bacteria to produce biogas. Besides, carbon dioxide and hydrogen can be converted directly to acetate or methane. The conversion of large soluble organic compounds to small soluble organic compounds results in little change in the organic strength of the compounds. Some of those compounds are converted into organic acids and alcohols, and some others are converted to new bacterial cells [35].
For example, the conversion reactions of propionate and butyrate are presented as follows [56].
Propionate: CH3CH2COOH + 2H2O−→CH3COOH + 3H2+ CO2 (2.3)
Butyrate: CH3CH2CH2COOH + 2H2O−→2CH3COOH + 2H2 (2.4) A key feature in the anaerobic digestion process is the syntrophic relation between obligate hydrogen producing acetogens (OHPA) and the methane-generate bacteria. The OHPA are only capable of growing in environments with low concentration of their metabolic product H2. Such environments can exist if a H2 consuming species, such as methane- generate bacteria is present. On the other hand, methane-generate bacteria are inhibited by high fatty acids (substrates of OHPA) concentrations. As a result, any significant increase in either of those substrates will eventually lead to the inhibition of both groups of bacteria. Furthermore, in a stable anaerobic digester, consumption of H2 leads to the production of acetate as main residual acid. Hence, high concentrations of propionate and butyrate are indicative of reactor failure [57, 58].
Methanogenesis
In this stage, methane is produced by methanogenic bacteria from acetic acids, hydrogen, and carbon dioxide as well as from other organic compounds, such as formic acid and methanol. All other fermentative products, such as acids, alcohols, and organic nitrogen compounds must be converted by methane-forming bacteria. If these compounds are not degraded, they would be accumulated in the digester, which would be responsible for high organic strength or carbonaceous biochemical oxygen demand (cBOD) of the supernatant. As long as the ”Working Velocity” of acid-producing bacteria and methane- forming bacteria are roughly the same, metabolic activity of the methanogenic stage is safeguarded [35, 11].
The main reactions related to methanogenesis are presented as follows [56].
CH3COOH−→CH4+ CO2 (2.5)
4H2+ CO2 −→CH4+ 2H2O (2.6)
2.2 Co-digestion process
Co-digestion is the term used to describe the combined treatment of several wastes with complementary characteristics. It is being one of the main advantages of the anaerobic technology, which has some benefits for treatment of different kind of wastes in one pro- cess: (1) increasing methane production yield due to supply of additional nutrients from co-substrates; (2) highly efficient for equipments utilization; and (3) low cost needed for processing multiple waste in a single facility [38, 39].
Several studies concerning the utilization of co-digestion, such as co-digestion of organic fraction of municipal solid wastes and agricultural residues, organic solid wastes and sewage sludge, or more specific wastes, have been documented. The recent works con- cerned the synergisms among co-digested substrates. Their results include the optimiza- tion of the carbon to nitrogen ratio for co-digestion process of municipal wastes and sewage sludge, which improved the buffer capacity in methane production. Co-digestion process of fish waste, abattoir waste water, and waste activated sludge were also conducted. The unbalance nutrients for each waste characterised by a low C/N ratio were regarded as an important limitation factor to anaerobic digestion of these organic wastes. By applying this technology, limitation of anaerobic digestion process of fruit and vegetable wastes can be reduced [12, 38].
2.3 Biochemical Reactions of Substrates and Prod- ucts
In chemical reactions, there are reactants (chemical compounds) and products. During reactions, reactants change and often release energy to the environment. The changes that occur to the reactants result in the formation of products. Chemical reactions that occur inside bacterial cells are known as biochemical reactions. During some biochemi- cal reactions, intermediates products are formed. They are usually short-lived and not
accumulated. However, change of specific environmental or operational conditions, such as change in pH or temperature, may cause the accumulation of intermediates. Initial substrates for microbes in anaerobic digesters include carbohydrates, lipids, and proteins.
Those substrates are found as particulates, such as the carbohydrate cellulose and as colloids such as proteins [35].
2.3.1 Carbohydrates
Carbohydrates are synthesized in the green leaves of plants by the conversion of carbon dioxide into glucose during photosynthesis. Within the digester all carbohydrates are degraded inside the cell of facultative anaerobes and anaerobes. Carbohydrates too large to enter the cell, that is, in an insoluble or complex soluble form, must be hydrolyzed into smaller, soluble sugars outside the cell through the use of exoenzymes. Once hydrolyzed, the smaller, soluble sugars enter the cell, where they are degraded by endoenzymes [35].
2.3.2 Lipids
Lipids are usually found in animal and plant tissues, which do not dissolve in water. They are extracted from animal and plant tissues with non-polar organic solvents such ether.
Lipids often disposed to a municipal anaerobic digester include fats and oil. Animal fats and vegetable fats or oils are the most plentiful lipids in nature. Butter and lard are examples of animal fats, while corn, olive, peanut, soybean, and sunflower oils are examples of vegetable oils [35].
In anaerobic digesters fats undergo degradation through two main steps. The first steps, the fats are hydrolyzed to glycerol and fatty acids. Lipase enzymes are used by bacteria to hydrolyze the fats. Glycerol is degraded, and the fatty acids released through hydrolysis are degraded into two carbon units at a time [35].
2.3.3 Proteins
Proteins are complex, high molecular-weight compounds, which have a relatively large surface and do not dissolve in wastewater. They can be classified into two, simple or conjugated according to their chemical composition. Simple proteins release only amino acids and no other compounds on hydrolysis. Blood serum albumin is an example of a simple protein. Conjugated proteins are more common than simple proteins and re- lease amino acids and non-protein substances on hydrolysis. Glycoproteins that contain carbohydrates and lipoproteins that contain lipids are examples of conjugated proteins [35].
2.3.4 Volatile Fatty Acids
Volatile fatty acids appear as substrates and products in the anaerobic digester. Many serve as substrate for methane-generate bacteria, and they are the products of the fer- mentative activities of facultative anaerobes and anaerobes. Production of volatile fatty acids in an anaerobic digester will result in the production of methane. As wastes are degraded, new bacterial cells or sludge are produced. The cellular growth or amount of sludge produced is expressed as net biomass yield. The higher the volatile solids feed to
the digester, the larger amount of volatile fatty acids formed in the digester. The larger amount of volatile fatty acids in the digester, the greater the impact of volatile fatty acids on digester alkalinity and pH [35].
2.4 Biogas
Numerous gases are produced in an anaerobic digester. The gases produced largest quan- tities are methane and carbon dioxide. By volume, methane is 60% to 65%, and carbon dioxide is 35% to 40%. When anaerobic digestion of sludges and wastewaters is inter- rupted by changes in operational conditions, numerous insoluble and volatile compounds are produced. Those compounds may be released wherever anaerobic digestion of organic compounds is interrupted. Many of these compounds are malodorous and often are re- leased in sewage, secondary clarifier sludge blanket, thickener, or anaerobic digester [35].
The inorganic compounds include methane and volatile organic compounds (VOC). The VOC contain volatile fatty acids, nitrogen-containing compounds, and volatile sulphur compounds (VSC). The production of VOC and VSC is due to the degradation of pro- teinaceous wastes [35].
Hydrogen sulfide (H2S) is the most undesirable inorganic gas produced during an anaer- obic digestion process. If biogas contains too much hydrogen sulfide, digester equipment may be damaged. This gas can be scrubbed from biogas, but scrubbing is cost-prohibitive for small wastewater treatment plants. Inorganic gases molecular nitrogen (N2) and ni- trous oxide (N2O) are produced through anoxic respiration (denitrification) in the anaer- obic digester. Anoxic respiration can occur with the transfer of nitrate ions (N O3−) to the digester with suldges. Nitrate-containing compounds such as sodium nitrate (N aN O3) are also one of the causes for anoxic respiration to occur [35].
2.5 Environmental Factor Influencing the Anaerobic Digestion Process of Fruit and Vegetable Waste
Microbial metabolic processes are dependent on various factors. Furthermore, environ- mental requirements of the hydrolysis and acid-forming bacteria of the substrates differ from those of the methane-forming bacteria. It is important to consider and control pa- rameters affecting those processes, so that an anaerobic process can be run in an optimum condition [37].
2.5.1 Temperature
Temperature is the most important environmental factor for bacterial growth. There are three temperature ranges associated with anaerobic digestion process. Those ranges are referred to as psychrophilic, mesophilic, and thermophilic [57, 59]. Methane-forming bac- teria are the ones that are more sensitive to temperature conditions compared to other bacteria involved in a process. The relative growth rate of methane-bacteria under differ- ent temperature conditions is presented in Fig. 2.2 [59].
Generally, methane-forming bacteria belong to the mesophilics (32-42oC)[37]. The anaero- bic digestion under mesophilic range is more stable and requires a smaller energy. Castillo
Figure 2.2: Relative growth rate of methane-forming bacteria under different temperature conditions (Based on a result by Grady et al. 2011 [59])
et al. (2006) found that the best operational temperature was 35oC for 18 day experimen- tal period, while a little fluctuation in temperature from 35oC to 30oC caused a reduction in the rate of biogas production [40].
In some cases, methane can be produced at a low temperature (0.6-1.2oC), e.g. on the surface of the permafrost soils. In laboratory tests, methane formation could be proven also with temperatures below freezing, i.e. down to -3oC [37]. However, this condition is less efficient to produce methane [57].
Anaerobic digestion under thermophilic condition has advantages, such as high metabolic rates and destruction of pathogens. Bouallagui et al. (2004) [10] investigated the per- formance of anaerobic digestion of fruit and vegetable waste under thermophilic (55oC), psychrophilic (20oC), and mesophilic (35oC). They found that biogas production from the experimental thermophilic was higher than from psychrophilic and mesophilic. However, thermophilics has some drawbacks regarding to stability compared to mesophilics. Fur- thermore, energy requirements of thermophilics are higher than mesophilics [10]. Other studies also showed that anaerobic digestion was easily inhibited and less stable at ther- mophilic condition than at mesophilic temperatures [41].
2.5.2 pH
Stability of anaerobic digestion process is closely related to pH value. It is important to maintain a suitable pH in order to accomplish an efficient process. During the fermenta- tion, carbon dioxide is continuously evolved and escapes into air. With falling pH value, more carbon dioxide is dissolved in the substrate as uncharged molecules. With a high pH value, dissolved carbon dioxide generates ionized carbonic acid. A drop in the pH value and a rise of carbon dioxide in the process is an indication of disturbance in an anaerobic digestion process. A first sign of the acidification is the rise of the propionic
Figure 2.3: Effect of pH on maximum specific growth rate of bacteria (Based on a result by Gerber et al. 2008 [36])
acid concentration. If the pH value drops below pH 6.5, then the production of organic acids leads to a further decrease of the pH value by the hydrolytic bacteria and possibly lead to digester failure. Effect of pH on maximum specific growth rate of bacteria is shown on Fig. 2.3 [36, 37].
pH values suitable for anaerobic digestion were reported by various researchers. Ward et al. (2008) found that a pH range of 6.8-7.2 was ideal for anaerobic digestion. Lee et al.
(2009b) reported that methanogenesis in an anaerobic digester occurs efficiently at pH 6.5-8.2, while hydrolysis and acidogenesis occurred at pH 5.5 and 6.5, respectively [40].
Some researchers investigated that pH affects the growth of microorganism during treat- ment of wastes with high concentration of Total Ammonia Nitrogen (TAN). Process insta- bility due to ammonia often results in volatile fatty acids accumulation, which leads to a decrease of pH and thereby declining concentration of free ammonia [41]. The interaction between free ammonia, volatile fatty acids, and pH may lead to a condition where the process is running stably but with a lower methane yield [19, 42].
2.6 Experimentation Mode
2.6.1 Batch Operation
Batch operation is a biological process without interchange of mass with the environment, i.e. there are no input or output flow (except for the gas stream). In such a system, all fruit and vegetable wastes are loaded in a digester at the beginning of the reaction cy- cle, and allowed to undergo all degradation steps sequentially. A whole processes has clear separation between the first stage, where acidification proceeds much faster than
methanogenesis, and the second stage where acids are transformed into biogas [11].
Several advantages have been stated with regards to the use of batch tests for kinetic parameter estimation in anaerobic digestion. Those include: (1) the possibility to record the time evolution of several variables; (2) the relatively short time span as compared to continuous operations; and (3) simplicity and popularity as reflected in a wide acceptance [43]. Some investigations showed a good results on anaerobic digestion process of fruit and vegetable waste tested on batch systems. Convertiet al. (1999) showed that some of fruit and vegetable wastes, for both under mesophilic and thermophilic, quickly degraded [11].
The specific features of batch processes are simple design and process control, robustness towards coarse and heavy contaminants, and lower investment costs [11]. However, the main drawback, stems from the lack of input excitation which result in a lack of parameter sensitivity. Bouallagui et al. (2001) and Marouaniet al. (2002) found that the anaerobic digestion of fruit and vegetable waste with 8% Total Solids in a batch digester was inhib- ited by the VFA accumulation and irreversible decreasing of pH problems [11]. This can be reduced by using different sets of initial conditions and by determining a proper range substrate and biomass (S/X) ratio [43].
2.6.2 Single-stage VS Two-Stage Operation
In a single-stage operation, four stages of anaerobic digestion take place simultaneously in one reactor. This operation has advantages being simple and easy to operate, and requires low investment costs. About 90 percent of the full scale plants in Europe, which treated organic fraction of municipal solid wastes and biowastes, rely on continuous one-stage operations. Many studies concerned waste treatment in this operation. Mata Alvarez et al. (1992) investigated the performance of mesophilic one-stage in a completely stirred di- gester for treatment of organic fraction of waste from food market. Further, Mata Alvarez et al. (1990) mentioned that this waste was more biodegradable, which led to a larger and faster volatile fatty acid production. Those components inhibit the methane-generating bacteria. Lane (1979) reported that overloading of digester with fruit and vegetable waste resulted in a decrease of pH and gas yield, and an increase in the carbon dioxide content [11]. The configuration of one-stage anaerobic digester is shown on Fig. 2.4 [35].
In single-stage anaerobic digestion of solid wastes, problems may occur if the substrate is easily biodegradable. There is possibility for the accumulation of biomass within the anaerobic reactor of solid waste, and slow growing methane-generating bacteria may ap- pear, which lead to high loading rates of organic components [11].
In two or multi-stage operation, the reactions take place sequentially in at least two re- actors. The idea is to separate hydrolysis stage and methanogenesis stage in space and time, with the intention of decreasing the overall retention time and making the operation optimal. By combining acidogenesis and methanogenesis in one stage, uniform conditions are imposed on the both groups of bacteria [11].
The advantages of a two stage anaerobic digestion process are [35]:
1. Improvement in process control.
2. Disposal of excess acidogenic sludge without losing slow growing methanogens.
3. Attenuation of a toxic material in the more robust first stage.
4. Precise pH control in each reactor.
5. Higher methane content in the biogas from the methanogenic stage.
Figure 2.4: One-stage anaerobic digester (Based on results by Gerardi, 2003 [35]) 6. Increased loading rate possible for the methanogenic stage.
The two-stage anaerobic digestion of a mixture of fruit and vegetable waste was studied in different works by Rajeshwari et al. (2001) and Ruynal et al. (1998). Those studies have led to a conclusion that phase-separated digesters may offer the best choice for high efficiency concerning both depuration rates and energy recovery [11]. The configuration of two-stage anaerobic digester is shown on Fig. 2.5 [35]
2.7 Operational Conditions of Anaerobic Digester
The rate-limiting reaction in anaerobic digestion process is usually the conversion of volatile fatty acids to methane. Methane-generating bacteria obtain very little energy from the degradation of volatile fatty acids. Most of the energy released from the volatile fatty acids is transferred to the methane. Because of the low energy yield obtained from volatile fatty acid by methane-generate bacteria, their growth rate is restricted, that is, the amount of substrate utilization per unit organism is high. Therefore, bacterial growth or sludge production is low and optimum operational conditions must be maintained for satisfactory rates of solids destruction and methane production. Those factors are re- sponsible for the rate-limiting reaction of the conversion of volatile fatty acids to methane.
However, if the substrates were mostly slowly degrading particulate materials, then the rate-limiting reaction would be the hydrolysis of the particulate materials [35].
Figure 2.5: Two-stage anaerobic digester (Based on results by Gerardi, 2003 [35]) Start-up phase
Methane-generate bacteria are strict anaerobes and are extremely sensitive to changes in alkalinity, pH, and temperature. Therefore, operational conditions in the digester must be periodically monitored and maintained within optimum ranges. The successful operation of an anaerobic digester requires the activity of an abundant and diverse population of methane-generate bacteria, and cultivation in the digester that is heated to 35oC with fresh inoculum may be helpful. Seeding with inoculum can be practiced during start-up or when the efficiency of the digester is deteriorates, for example, when the digester pH drops. During start-up, loading the digester should proceed slowly. Careful monitoring and control of pH and alkalinity are essential, especially when an efficient inoculum is not provided. One should proceed slowly in start-up period slowly with approximate time of about one month to achieve a steady state condition or an efficient operation [35].
Retention times
There are two significant retention times in an anaerobic digester. Those are solids re- tention time (SRT) and hydraulic retention time (HRT). The SRT is the average time during which microbes (solids) are in the anaerobic digester. The HRT is the time during which the sludge is in the anaerobic digester. Because the regeneration time required for a population of methane-generate bacteria to double in size is relatively long compared to aerobic bacteria and facultative anaerobic bacteria, typical SRT for anaerobic digesters are more than 12 days. Detention times for less than ten days are not recommended, because there is significant methane forming bacteria wash-out may occur [35].
High SRT values are advantageous for anaerobic digesters. This values maximize the removal capacity, reduce the required digester volume, and provide the buffering capacity for protection against the effects of shock loadings and toxic compounds in sludges. High SRT values also help permit biological acclimation of toxic compounds [35].
HRT values affect the rate and extent of methane production. This values control the conversion of volatile solids to gaseous products in an anaerobic digester. The design of the HRT is an essential factor for the final disposition of the digested sludge. The HRT may be relatively high or low, if the digested sludge is to be disposed with landfill or incineration. However, increases in detention time more than 12 days do not contribute significantly to the increase of volatile solids destruction [35].
2.8 Basic Models: Kinetics of Biogas Formation from Fruit and Vegetable Waste
It is important to considers growth of microbes, degradation of substrate, and formation of products to investigate the kinetics of biogas formation. The substrate balance of a continuous or a discontinuous process can be expressed by
dS
dt(accumulation) = D.S0(input)−D.S(output) + dS
dt(reaction) , (2.7) where D is dilution rate (flow per volume of digester, in 1/h) and S is substrate concen- tration [36]. The reaction rate is proportional to product formation and depending on the cell concentration. The kinetics of bacterial growth is strongly depending on growth requirements and the medium. The balance of microbial cells can be expressed as follow [36].
dX
dt(accumulation) = D.X0(input)−D.X(output) +µX(growth) + kdX(death) , (2.8) where X is bacterial concentration (g/L), and µ is specific growth rate of bacteria. The bacterial growth depends on the specific growth rate, which influences by several factors, including substrate concentration, temperature, and pH.
The dilution rate for batch reactor is zero. The mass balances for bacteria and substrate can be expressed by
dS
dt =−dS
dt =−rsX , (2.9)
dX
dt =µX + kdX , (2.10)
where rs is consumption rate of substrate [44].
2.8.1 Kinetics of Microbial Growth: Monod Model
Monod discovered a non-linear relation between specific growth rate and substrate con- centration, which the investigation was based on the work by Michaelis-Menten theory.
Figure 2.6: Specific growth rate of bacteria depending on substrate concentration (Based on work by Monod, 1949 [36])
The formulation of microbial growth can be expressed by µ=µmax
S
KS+ S , (2.11)
whereµmax is the limit of the specific bacteria growth rate when the saturation is reached, KS is monod-constant describes substrate concentration at 50% of the maximum specific growth rate of bacteria [45].
The substrate concentration is the limiting factor, in which the component limits the specific growth rate due to its concentration. KS is the affinity of bacteria to the limiting substrate. If the substrate concentration is greater than KS, the specific growth rate is approximately linear, and KS is always greater than zero. Thus, the values of KS
S+S is always less than one, and the values of the specific growth rate is less than µmax. If the substrate is not the limited factor due to a high enough concentration of substrate, the maximum specific growth rate can be reached (Fig. 2.6) [36].
The Monod model for homogeneous and simple substrates is highly accurate. However, it is not appropriate for heterogeneous and complex substrate, such as degradation of municipal solid wastes. Furthermore, the lag phase is not included in the model [36].
2.8.2 Kinetics of Substrate Degradation
The substrate degradation can be calculated based on the specific growth rate of microbes.
They need substrate to synthesis new cell material, to produce products such as acetic
acid or methane, and to supply requires maintenance and growth energy. The whole degradation process of substrate can be formulated as the sum of three terms [36].
dS dtr
= dS dtx
+dS dte
+dS dtc
(2.12) Synthesis new cell material
The substrate degradation to biomass can be described stoichiometrically. The relation for acid forming bacteria use glucose as substrate, which can be expressed as follows [60].
C6H12O6+ 1.2NH3 −→1.2C5H7NO2+ 3.6H2O (2.13) According to this reaction, 1.2 mol acid-forming bacteria are formed by 1 mol glucose.
Considering the molar mass of glucose and biomass and assuming that theC5H7N O2 rep- resents 92% of the dry biomass, the yield coefficient of glucose to acid-forming bacteriaYx
is 0.82 g/g [60]. Based on this condition, substrate degradation due to biomass formation depends on the change of cell concentration of microbes can be expressed by [36].
dS dtx
=− 1 Yx
dX
dt =−µX
Yx (2.14)
Energy supply of bacteria
Bacteria need energy for their living to the synthesize cell ingredients, which are degraded continuously to sustain the concentration gradient between cell interior and exterior. The energy demand can be divided into growth energy and maintenance energy. The required energy is provided by substrate [36].
The maintenance energy coefficient is specified by Moletta & Albagnac (1984) with 0.0169 mol ATP per g biomass and per hour. Assuming that degradation of 1 mol glucose to 3 mol acetic acid will result in 6 ATP, the maintenance energy rate Kmx is 12.1 g glucose per g active biomass and per day.[36]
According to Moletta et al. (1986)[60], the substrate degradation for energy supply is expressed by
dS dte
= KsxXµ+ KmxX S
KS+ S (2.15)
The first term on the right side is the substrate degradation for growth energy supply and the second term is the substrate degradation for maintenance energy supply.
Conversion of substrate
The conversion of substrate to products can be considered stoichiometrical as well, for example, the degradation of acetic acid to methane is expressed by
CH3COOH−→CH4+ CO2 , (2.16)
The degradation of 1 mol acetic acid results in 1 mol methane. Using the molar mass of acetic acid and methane, the yield coefficient of acetic acid to methane, Ys, is 0.27 g/g.
Using the calculated yield coefficient, the substrate degradation due to product formation is determined by the expression (2.17) [36].
dS dtc
= 1 Ys
(dP dt
)
p
(2.17)
2.8.3 Kinetics of Product Formation
The end product of fermentation process is biogas. Nevertheless, a lot of intermediates are also very important products. The kinetics of product formation can be calculated by principles based on the kinetics of substrate degradation and of bacterial growth, respectively. Gaden (1959) investigated fermentation processes and classified products into three types [36]:
Type I products, which result from primary energy metabolism. The product is produced at the same time as substrate is degraded.
dP
dt = Yp1µX = Yp1
dX
dt (2.18)
Type II products, which result from energy metabolism indirectly. The product is pro- duced at side reactions or following interactions of direct metabolic products. Therefore, the product formation is delayed and two maxima appear in substrate degradation and bacterial growth.
dP
dt = Yp1µX + Yp2X = Yp1dX
dt + Yp2X (2.19)
Type III products, which do not result from energy metabolism. The formation of complex molecules (biosynthesis), such as the formation of antibiotics is the example of this process.
Energy metabolism is practically complete while the complex product accumulates.
dP
dt = Yp2X (2.20)
Chapter 3
Material and Methods
3.1 Lab-Scale Digester
The laboratory-scale digesters used for experiments were a batch single-stage anaerobic digester. The reactors used were 50 L made of aluminium, 500 and 2000 ml batch digesters made of glass. The temperature for 500 and 2000 ml were maintained at 30-45 ◦C using water bath, while temperature for 50 L digester was not maintained (under ambient temperature). Digester set up for each digester is shown in Figure 3.1 and Figure 3.2.
3.2 Substrate and inoculum
The substrate used in the experiments were fruit and vegetable waste, while inoculum used in the experiments were horse dung and sludge from biogas plant located in Tsuyama and Kojima. The preparation was as follows: sorting of wastes, homogenizing the size of wastes by blender, and adding water before the wastes mixed with inoculum, finally adding inoculum and mixed into digester.
3.3 Chemical Analysis Methods
Several analysis was done for the experimental results of biogas production from fruit and vegetable waste, including biogas volume and concentration, elemental analysis (CHN), COD (chemical oxygen demand), TS (total solids), and water content.
Biogas volume was measured by displacement method. Elemental analysis (CHN) was performed with The PerkinElmer 2400ii CHN Elemental Analyzer. Concentration of methane and carbon dioxide was analyzed with gas chromatograph Shimadzu GC-8A1F (FID). COD and TS was performed in accordance to Standard Methods [48].
3.3.1 COD analysis - Potassium permanganate acidic method
Sample Pre-treatment
Samples were collected and separated from solid compounds by centrifuging.
Analysis
Samples were poured into a 300ml conical flask and the volume was increased to 100 ml by adding water (dilution of the sample should be enough so that about a half of potassium permanganate solution can remain after the next procedure). Once 10 ml sulfuric acid (1+2) and 10ml potassium permanganate were added, the flask was stirred and imme- diately put into a boiling water bath to heat up for 30 minutes, under temperature 60 - 80oC. After the flask was taken out from the bath, 10 ml sodium oxalate was added and subsequently, the flask was stirred. Titration was conducted until the color of the solution turns slightly red due to the potassium permanganate solution (wait for 30 sec- onds at this point). In parallel, 100 ml of distilled or deionized water was poured into a conical flask, and the same procedure was conducted. The oxidation of permanganate and oxidation-reduction potentiometric titration are expressed as below
2KMnO4+ 3H2SO4 −→K2SO4+ 2MnSO4+ 3H2O + 5O (3.1)
2KMnO4+ 5Na2C2O4+ 3H2SO4 −→K2SO4+ 5Na2SO4+ 10CO2+ 3H2O (3.2) CODMn (mgO/l) is calculated by following equation:
COD(mgO2/l) = (a−b)f1000
V (3.3)
where a is volume of potassium permanganate solution required in titration (ml) used for samples, b is volume of potassium permanganate solution required in titration (ml) used for blank, f is factor of potassium permanganate solution, and V is volume of the water sample (ml), respectively.
3.3.2 Total Solids
Total solids is the amount of solid present in the sample after the water is vaporised. The sample, approximately 10 gr, is taken and poured into combustion boat and dried to a constant weight at about 105oC in furnace. Total solids in mg/L is formulated as follows.
TS(g/L) = (A−B)x100
V (3.4)
where A is weight of dried residue and combustion boat (g), B is weight of combustion boat (g), and V is volume of sample (ml).
3.4 Mathematical model of anaerobic digestion of fruit and vegetable waste
The modeling of biogas formation from fruit and vegetable waste were based on several models, including the first-order model, the Monod model, the Sosnowski model, and the Grau model. Those models are based on the microbial growth and substrate consumption rates which depend on a growth-limiting substrate concentration. Nutrients were assumed to be substrates that are supplied in excess [45, 51].
3.4.1 Monod Model
The model involves two stages of anaerobic digestion: first hydrolysis-acidogenesis stage, and second acetogenesis-methanogenesis stage. First stage, soluble organic compounds are converted into acids and then into volatile fatty acids and carbon dioxide by acidogenic and acetogenic bacteria. As the hydrolysis is not the limiting step in the anaerobic process of fruit and vegetable waste, the hydrolysis was assumed to be done in a very short time.
Fruit and vegetable waste tends to rapid acidogenesis and acetogenesis because the low pH of this wastes [12]. The reaction is described below:
FVW(sol) + bacteria−→VFA + CO2 (3.5)
Second stage, volatile fatty acids and carbon dioxide produced from the previous stage are converted into methane and carbon dioxide by methanogenic bacteria. The reaction is described below:
VFA + bacteria−→CH4+ CO2 (3.6)
Effect of temperature on microbial growth was considered in this study. This is similar to the observation of enzyme activity, where an increase of temperature up to a certain point increases the bacterial activity while the decrease of temperature decreases the activity [44].
k = kmaxexp (
−Ea RT
)
(3.7) where k is rate constant, Ea is constant of activation energy (J mol−1), T is temperature (K), and R is constant of gas molar (J K−1mol−1). This equation has been applied to a various parameters, such as specific growth rate (Siegristet al., 2002 [22]), the maximum specific growth rate (Angelidaki et al., 1993 [19]), the saturation constant (Siegrist et al., 2002 [22]), the hydrolysis rate, the death rate (Siegrist et al., 2002 [22]), the dissociation constant (Angelidakiet al., 1993 [19]), etc. For an empirical description, the temperature dependence implied by Arrhenius may be adapted [36].
The formulation of temperature as the influence factor for microbial growth is expressed by a principle based on the adaptation of Arrhenius law cf. Bergter (1983) and Sinclair and Kristiansen (1993) [36, 47].
µmax(T) = k1exp (
−Ea RT
)
−k2exp (
−Ea RT
)
(3.8) wherek1,k2 are rate constant (day−1),Ea is constant of activation energy (J mol−1), T is temperature (K), and R is constant of gas molar (J K−1mol−1).
According to the equations explained above, the mass balance of substrate degradation, growth of bacteria, and biogas formation for batch is formulated [47]:
dS dt = 1
YµX , (3.9)
dX
dt =µX , (3.10)
dP
dt = YpµX , (3.11)
where P is concentration of biogas formation, Y and Yp are yield coefficient for sub- strate and biogas, respectively. By substituting Eq.(3.8) into Eq. (3.9 - 3.11), system of equations (3.12), (3.13), (3.14) as follow [47].
dS dt = 1
Y
µmaxXS
Ks+ S , (3.12)
dX
dt = µmaxXS
Ks+ S , (3.13)
dP
dt = YpµmaxXS
Ks+ S , (3.14)
where P represents the concentration of methane and carbon dioxide, which can be ex- pressed by
dCH4
dt = YpµmaxXS
Ks+ S , (3.15)
dCO2
dt = YpµmaxXS
Ks+ S . (3.16)
3.4.2 P. Sosnowski Model
P. Sosnowski et al. (2008) proposed a model for 2 stages of anaerobic digestion process, hydrolysis stage and methanogenesis stage. The hydrolysis stage and the methanogenesis stage were modeled by first-order kinetic and Monod-like reaction, respectively [48].
Hydrolysis Stage
P. Sosnowski assumed that the process of anaerobic digestion of complex substrate of particulate material, such as solid waste and sewage sludge, were limited by the hydrolysis stage. Particulate organic material must be decomposed to solutes capable of being actively or passively transported across cell membranes for microbial metabolism. There are two mechanisms to describe the hydrolytic process [51]:
1. The microbes secrete enzymes into the culture medium for extracellular degradation for size reduction.
2. The microbes adhere to a particle and consume soluble products released by reactions that are catalyzed by enzymes locally produced.
The first-order model also used to describe hydrolysis stage of organic polymer, as the enzymatic activity is not influenced by bacterial growth. The formulation of first-order model can be expressed by
rs= Kh.S (3.17)
where Kh is hydrolytic constant [45].
Methanogenesis Stage
Methanogenesis is assumed to be the rate-limiting step of the anaerobic digestion of com- plex substrates. Modeling efforts often view methanogenesis as the limiting step because methanogenic bacteria have the higher sensitivity and lower growth rates compared to those in the non-methanogenic group bacteria. When substrates were overloaded in one digester, high volatile fatty acid product concentrations would inhibit polymer hydrolysis and acidogenesis and resulted in methanogenesis, as opposed to hydrolysis, and methano- genesis stage would become the overall anaerobic digestion rate-limiting step [51, 52].
Based on the stages described, ordinary differential equations of the process can be for- mulated by
dS
dt =−kS , (3.18)
dV
dt = YVFA/SkS−VVFAX0 VFA
Ks+ VFA , (3.19)
dCH4
dt = YCH4/VFAVVFAX0
VFA
Ks+ VFA , (3.20)
dCO2
dt = YCO2/SkS + YCO2/VFAVVFAX0 VFA
Ks+ VFA , (3.21)
wherek is constant of first-order kinetic (d−1), and V F Ais concentration of volatile fatty acids [48]. YV F A/S, VV F A, YCH4/V F A, YCO2/S, and YCO2/V F A represent as yield factor of VFA from substrate S, maximum specific utilization of V F A, yield factor of methane fromV F A, yield factor of carbon dioxide from substrateS and fromV F A, respectively.
3.4.3 Grau Model
The mechanism of substrate utilization by a bacterial cell can be generally described as a sequence of three complex processes: contact of a cell with the molecule of substrate;
transport of the molecule into the cell; and intermediate metabolism of the substrate.
On the basis of the described general mechanism it is practical to classify various types of substrates into three main groups: (a) single component substrate, which are directly transportable into the cell;(b) multicomponent substrates, which are mixtures of several single substrates; and (c) complex substrates, which have to be changed externally prior to the transportation into the cell [50].
Grau et al. (1975) considered multicomponent substrate degradation rate, for which the concept was based on the linear degradation by Monod. The decrease of removal rate caused by a reduced number of components and thus the decrease in total substrate con- centration with time must also be explained. To reflect this, Grau [50] used an exponent similar to the order of chemical reactions, which can be formulated.
dS
dt =−ksXS S0
n
. (3.22)


![Figure 2.4: One-stage anaerobic digester (Based on results by Gerardi, 2003 [35]) 6. Increased loading rate possible for the methanogenic stage.](https://thumb-ap.123doks.com/thumbv2/123deta/5845696.1039153/22.892.252.585.142.562/figure-anaerobic-digester-results-gerardi-increased-possible-methanogenic.webp)
![Figure 2.5: Two-stage anaerobic digester (Based on results by Gerardi, 2003 [35]) Start-up phase](https://thumb-ap.123doks.com/thumbv2/123deta/5845696.1039153/23.892.190.693.158.548/figure-stage-anaerobic-digester-based-results-gerardi-start.webp)
![Figure 2.6: Specific growth rate of bacteria depending on substrate concentration (Based on work by Monod, 1949 [36])](https://thumb-ap.123doks.com/thumbv2/123deta/5845696.1039153/25.892.191.701.146.528/figure-specific-growth-bacteria-depending-substrate-concentration-based.webp)
![Figure 3.1: Experimental set up for 50 L digester [46]](https://thumb-ap.123doks.com/thumbv2/123deta/5845696.1039153/39.892.110.791.291.949/figure-experimental-set-up-for-l-digester.webp)