• 検索結果がありません。

Elimination Technique for Alkali Metal Ion Adducts from an Electrospray Ionization Process Using an On-line Ion Suppressor

N/A
N/A
Protected

Academic year: 2021

シェア "Elimination Technique for Alkali Metal Ion Adducts from an Electrospray Ionization Process Using an On-line Ion Suppressor"

Copied!
4
0
0

読み込み中.... (全文を見る)

全文

(1)

ANALYTICAL SCIENCES JUNE 2010, VOL. 26 715

Introduction

High-performance liquid chromatography (HPLC) coupled with an electrospray ionization mass spectrometric (ESI-MS) method is a proven technique for the quantitative determination of drugs in biological matrices. Generally, ESI-MS results in protonated molecules, [M+H]

+

, in the positive-ion mode; however, for some molecules the formation of alkali metal ion adducts, like [M+Na]

+

or [M+K]

+

, instead of proton addition are often observed. When the process is not controlled, facile adduct formation can lead to large variations and unreliable results during the quantitative method development of drugs with LC/ESI-MS.

1,2

Modulating the temperature or voltage for the ESI condition is insufficient to completely suppress the formation of alkali metal ion adducts.

3

Neubauer and Anderegg reported that the addition of sodium acetate to the HPLC mobile phase during an LC/ESI-MS experiment encourages the formation of sodium adduct ions.

4

Jemal et al. demonstrated that a rugged LC/ESI-MS bioanalytical method can be developed by utilizing an electrospray-generated sodium-ion adduct of the analyte for selected-ion monitoring.

3

Wujcik and Kadar showed the utility of the sodium adduct as a means to enhance the stability of sulopenem prodrug in both in-source collision-induced dissociation (CID) and thermolysis.

5

However, the non-volatile nature of a sodium buffer makes it unsuitable to be used with LC/ESI-MS methods. Although Li and coworkers reported that the summation of the proton, ammonium and sodium ion adducts could provide more reproducible results for the quantification of ginkgolides or bilobalide,

1

the addition of the responses of the different MS/MS traces complicates matters when performing selective reaction monitoring (SRM).

2

In addition, the summation approach assumes that the response factor for all adduct ions is equal.

Stefansson et al. demonstrated that primary alkylamines as

additives to the electrosprayed solution were effective for inhibiting the sodium adduction for model compounds, such as artemisinin.

6

Furthermore, Zhao et al.,

7

Mortier et al.,

2

and Karnes’ group

8,9

reported the same usefulness of alkylamines for simvastatin, paclitaxel, and docetaxel, respectively.

Teshima  et al. investigated an application of 1-alkylamines for quantitative analysis using LC/ESI-MS,

10–12

while other chemicals have been studied as well.

13,14

The aforementioned mobile-phase additive is useful for regulating the multimer and improving the sensitivity of detection.

15

On the other hand, another approach is to completely exclude alkali metal ions from the HPLC mobile phase. This seems to be quite laborious due to an ubiquitous presence of sodium, often originating from the glassware, stainless-steel, and/or as impurity in chemicals or solvents, even when being ultra pure, thoroughly deionized water is used.
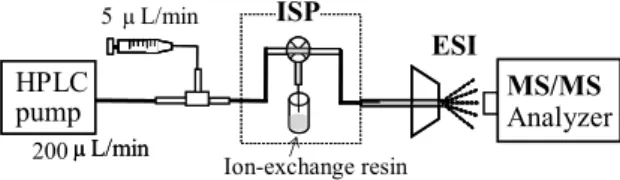
6

We have recently examined  the mass spectra of the electrochemical oxidation products of nifedipine so as to improve the sensitivity using electrochemistry/ESI-MS coupled with an ion suppressor (ISP) device. It was found that the sodium ion adduct of nifedipine was eliminated with ISP, even though the intensity of the sodium ion adduct was relatively low compared to the protonated molecule in the mass spectra without ISP.

16

Huber and coworkers demonstrated that on-line cation-exchange resins with triethylammonium ions were useful for suppressing the sodium adduct formation of oligonucleotides in negative-ion ESI-MS.
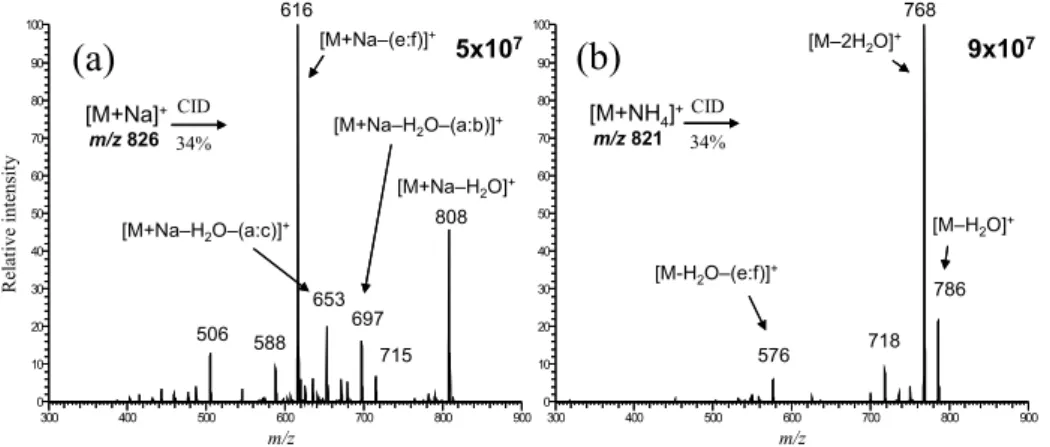
17,18

Herein, a macrolide immunosuppressive drug, tacrolimus, was selected as a model compound that can easily form the sodium adduct ion derived from the ESI process in the positive-ion mode.

19,20

In this report, an on-line ISP technique is described as a simple and new way to eliminate alkali metal ion adducts derived from the positive-ion ESI process.

2010 © The Japan Society for Analytical Chemistry

To whom correspondence should be addressed.

E-mail: [email protected]

Elimination Technique for Alkali Metal Ion Adducts from an Electrospray Ionization Process Using an On-line Ion Suppressor

Kazuyoshi N OZAKI , Akira T ARUI , Issey O SAKA , Hideya K AWASAKI , and Ryuichi A RAKAWA

Department of Applied Chemistry, Faculty of Chemistry, Materials and Bioengineering,   Kansai University, 3-3-35 Yamatecho, Suita, Osaka 564–8680, Japan

The effects of an on-line ion suppressor device on alkali metal ion adduct formations of the model compound tacrolimus were investigated. The base peak ion in the positive ion ESI-MS spectrum of tacrolimus was a sodium ion adduct, [M+Na]

+

. On the other hand, an ammonium ion adduct, [M+NH

4

]

+

, was the base peak ion in the full-scan mass spectrum of tacrolimus with a cation-exchange suppressor resin, and both [M+Na]

+

and [M+K]

+

were eliminated. These results indicate that the combination of an on-line ion suppressor with ESI-MS is a simple and effective technique that eliminates undesirable alkali metal ion adduct formations in the positive-ion mode.

(Received February 10, 2010; Accepted April 20, 2010; Published June 10, 2010)

Notes

(2)

716 ANALYTICAL SCIENCES JUNE 2010, VOL. 26

Experimental

Materials and sample solutions

Tacrolimus (FK506, Fig. 1) was provided by Astellas Pharma Inc. HPLC-grade methanol was purchased from Kanto Chemical Co., Inc. (Tokyo, Japan). House deionized water was further purified by a Milli-Q water purifying system consisting of Elix 5UV and Gradient A10 (Millipore Corporation, Bedford, MA). A stock solution of tacrolimus at a concentration of 0.5 mg/mL was prepared by dissolving the drug in methanol.

The stock solution was further diluted with methanol to give a final concentration of 10 μg/mL.

Instrumentation and experimental conditions

The HPLC instrument used was an Agilent 1100 Series (Agilent, Palo Alto, CA), consisting of a binary pump and a vacuum degasser. The solution of tacrolimus at a concentration of 10 μg/mL, delivered by a syringe pump with a 250-μL syringe (Unimetrics, Sohorewood, IL) at a flow rate of 5 μL/min, was mixed through a T-piece with an HPLC effluent that contained 50% (v/v) of methanol in water, as shown in Fig. 2.

The mobile-phase flow rate was set at 0.2 mL/min. A suppressor module of an ion chromatography (IC) system IC-2001 (Tosoh, Tokyo, Japan) was used as an ion-suppressor (ISP) device with a cation-exchange resin (TSKsuppress IC-A from Tosoh, 200 μm diameter, 1.7 equiv/L).

21

The resin for suppression was conditioned with water according to the instructions for use in the instrument manual. The tacrolimus in the HPLC effluent through the ISP device was introduced directly into the ion-trap mass spectrometer LCQ deca equipped with an ESI interface (Thermo Fisher Scientific Inc., San Jose, CA).

The positive-ion mode of ESI-MS was used for all measurements. The heated capillary was set at 330° C, and the spray voltage was kept at 4.5 kV. The sheath gas flow (N

2

) and auxiliary gas flow (N

2

) were set to 75 and 10 arbitrary pressure units, respectively. Capillary and lens voltages were systematically optimized for the sodium or ammonium ion adduct of tacrolimus using autotune. Full mass spectra were acquired in the 200 – 1000 m/z range. The CID was then used to acquire the product ion spectra using helium as a collision gas in the ion trap. The CID energy was set at 34% for the sodium ion adduct at m/z 826.4 as a precursor ion with a width of 2, or the ammonium ion adduct at m/z 821.2 as a precursor ion with a width of 3.5. The results were processed using the

Xcalibur

®

Ver. 2.0 (Thermo Fisher) software package. All spectra presented are raw data, and have not been subjected to smoothing, filtering, a background correction, or other manipulative procedures.

Results and Discussion

Effect of ISP on alkaline ion adduct formation of tacrolimus The positive ion ESI mass spectrum of tacrolimus is given in Fig. 3a. The base peak ion in the mass spectrum was a sodium ion adduct, [M+Na]

+

, at m/z 826 (M represents the tacrolimus molecule). Other adducts, such as [M+NH

4

]

+

(m/z 821) and [M+K]

+

(m/z 842) were present at low intensity; however, no protonated tacrolimus [M+H]

+

at m/z 804 was detected. The formation of these adducts indicate the ubiquitous presence of alkali metal ions, like sodium, often originating from the glassware, stainless-steel, and/or as impurity in chemicals or solvents,

2

even though no sodium, potassium, and ammonium ions were added to the standard solution of tacrolimus and the HPLC mobile phase. Furthermore, it is difficult to completely exclude all contaminant ions from water. As shown in Fig. 1, tacrolimus, a 23-membered macrolide antibiotic, has plenty of oxygen atoms in its chemical structure, which enables it to form alkali metal ion adducts facilely. A quantitative assay of tacrolimus using the sodium ion adduct has been reported as its factual evidence.

19,20

We therefore selected tacrolimus as a model compound to examine the effect of ISP on alkali metal ion adduct formation. The IC-2001 system used in this report had a suppressor device, which contained an ion-exchange suppressor resin and a switching valve to utilize fresh resin with each run.

21

Ito has presented the on-line use of the suppressor device to remove an ion-pair reagent in the mobile phase in order to develop a sensitive LC/MS method for the determination of nicotine and its metabolites in human serum.

22

The positive ion ESI mass spectrum of tacrolimus with the on-line ISP device is given in Fig. 3b. In its full-scan mass spectrum, the ammonium ion adduct, [M+NH

4

]

+

, at m/z 821 became a base peak ion instead of the sodium ion adduct, [M+Na]

+

, at m/z 826. The ion intensity of [M+NH

4

]

+

, optimized using autotune, was the same as that of [M+Na]

+

in the mass spectrum without ISP. Furthermore, the peaks of both [M+Na]

+

and [M+K]

+

ions were eliminated in the mass spectrum with ISP (Fig. 3b). The formation of [M+NH

4

]

+

in the mass spectrum with ISP indicates that the cation-exchange suppressor resin was not able to remove the ammonium ion completely due to its weak basicity (NH

3

+ H

+

 NH

4+

).

One target ion related to an analyte is preferred to prevent unreliable variations from changing the ratio of the ion intensity among adduct ions by sample matrices and LC/MS conditions.

Successful attempts for LC/ESI-MS assay development of tacrolimus have been made to replace all adducts by one desired adduct ion with alkali metal ions or primary alkylamines when adduct ion formation is observed.

23–26

The mass spectra of Fig. 1 Chemical structure of tacrolimus and its fragmentations.

Fig. 2 Schematic of LC/ESI-MS/MS with an on-line ISP system.

(3)

ANALYTICAL SCIENCES JUNE 2010, VOL. 26 717

tacrolimus with the on-line ISP revealed that this elimination technique for alkali metal ion adducts formed in the ESI process was a simple method, similar to mobile-phase additives.

Difference of MS/MS product ion spectra with and without ISP A major fragment ion [M+Na–(e:f)]

+

at m/z 616 was observed besides [M+Na–H

2

O]

+

(m/z 808) and other weak ions in the CID spectrum of [M+Na]

+

(m/z 826) without ISP (Fig. 4a). On the other hand, the fragment ion [M+H–2H

2

O]

+

at m/z 768 was the major ion in the CID spectrum of [M+NH

4

]

+

(m/z 821), which was the base peak ion in the full-scan mass spectrum with ISP (Fig. 4b). These fragmentations were consistent with the data published by Tozuka (Fig. 1).

27

Fragments in the CID spectra of the sodium ion adduct kept to have a strong affinity for the sodium ion. The ion intensity of the product ion at m/z 768 with ISP was about two-fold stronger than that at m/z 616 without ISP.

The results indicate that the on-line ISP technique can be useful for improving the sensitivity of the LC/ESI-MS/MS assay for drugs. Sodium ion adducts are not suitable for MS/MS detection of some drugs because of their poor fragmentation, though they can be helpful in determining the molecular weight of unknown analytes. The LC/ESI-MS/MS with on-line ISP would, therefore, be an advantageous method for elucidating the structure of drug metabolites if the new fragment ion is obtained from the precursor ion besides the alkali metal ion adducts.

Conclusions

We have demonstrated that the combination of an on-line ion suppressor with ESI-MS is a simple and effective technique to eliminate undesirable alkali metal ion adduct formation in the positive-ion mode. In addition, we speculate that the information on new product ions from a non-alkali metal ion adduct would be useful for developing a sensitive LC/ESI-MS/MS assay.

Although adduct formation is compound and instrument dependent, we believe that our experimental approach and results can be helpful for other drugs and metabolites susceptible to adduct formation.

Acknowledgements

This work was partially supported by a Grant-in-Aid for Scientific Research (B) and by Strategic Project to Support the Formation of Research Bases at Private Universities from MEXT. The authors would also like to thank Tosoh Corp. for its support and assistance.

References

1. X.-F. Li, M. Ma, K. Scherban, and Y. K. Tam, Analyst, 2002, 127, 641.

Fig. 3 Full-scan mass spectra of tacrolimus: (a) without ISP, and (b) with ISP.

Fig. 4 Typical product ion spectra of tacrolimus: (a) without ISP, and (b) with ISP.

(4)

718 ANALYTICAL SCIENCES JUNE 2010, VOL. 26

2. K. A. Mortier, G. F. Zhang, C. H. V. Peteghem, and W. E.

Lambert, J. Am. Soc. Mass Spectrom., 2004, 15, 585.

3. M. Jemal, R. B. Almond, and D. S. Teitz, Rapid Commun. 

Mass Spectrom., 1997, 11, 1083.

4. G. Neubauer and R. J. Anderegg, Anal.  Chem., 1994, 66, 1056.

5. C. E. Wujcik and E. P. Kadar, Rapid  Commun.  Mass  Spectrom., 2008, 22, 3195.

6. M. Stefansson, P. J. R. Sjöberg, and K. E. Markides, Anal. 

Chem., 1996, 68, 1792.

7. J. J. Zhao, A. Y. Yang, and J. D. Rogers, J. Mass Spectrom., 2002, 37, 421.

8. S. S. Iyer, S. Gao, Z.-P. Zhang, G. E. Kellogg, and H. T.

Karnes, Rapid Commun. Mass Spectrom., 2005, 19, 1221.

9. S. Gao, Z.-P. Zhang, L. E. Edinboro, L. C. Ngoka, and H.

T. Karnes, Biomed. Chromatogr., 2006, 20, 683.

10. K. Teshima, T. Kondo, C. Maeda, T. Oda, T. Hagimoto, R.

Tsukuda, and Y. Yoshimura, J.  Mass  Spectrom., 2002, 37, 631.

11. K. Teshima and T. Kondo, Anal. Biochem., 2005, 338, 12.

12. K. Teshima, T. Yoneyama, and T. Kondo, J. Pharm. Biomed. 

Anal., 2008, 47, 962.

13. N. P. Lopes, C. B. W. Stark, H. Hong, P. J. Gates, and J.

Staunton, Analyst, 2001, 126, 1630.

14. M. Greig and R. H. Griffey, Rapid  Commun.  Mass  Spectrom., 1995, 9, 97.

15. S. Gao, Z.-P. Zhang, and H. T. Karnes, J. Chromatogr., B,

2005, 825, 98.

16. K. Nozaki, A. Tarui, I. Osaka, H. Kawasaki, and R.

Arakawa, in the 56th Annual Conference on Mass Spectrometry, Tsukuba, Japan, 2008, 510 – 511.

17. C. G. Huber and M. R. Buchmeiser, Anal. Chem., 1998, 70, 5288.

18. C. G. Huber and A. Krajete, J. Mass Spectrom., 2000, 35, 870.

19. G. L. Lensmeyer and M. A. Poquette, Ther.  Drug  Monit., 2001, 23, 239.

20. M. A. Poquette, G. L. Lensmeyer, and T. C. Doran, Ther. 

Drug Monit., 2005, 27, 144.

21. S. Sato, Y. Ogura, A. Miyanaga, T. Sugimoto, K. Tanaka, and H. Moriyama, J. Chromatogr., A, 2002, 956, 53.

22. S. Ito, in the 55th Annual Conference on Mass Spectrometry, Hiroshima, Japan, 2007, 468 – 469.

23. K. Iwasaki, H. Matsuda, T. Shiraga, A. Kawamura, Y.

Miyazaki, Y, Teramura, Z. Tozuka, and T. Hata, Drug  Metab. Pharmacokinet., 1995, 10, 837.

24. P. J. Taylor, A. Jones, G. A. Balderson, S. V. Lynch, R. L.

G. Norris, and S. M. Pond, Clin. Chem., 1996, 42, 279.

25. Y.-L. Chen, H. Hirabayashi, S. Akhtar, M. Pelzer, and M.

Kobayashi, J. Chromatogr., B, 2006, 830, 330.

26. J.-L. Li, X.-D. Wang, C.-X. Wang, Q. Fu, L.-S. Liu, M.

Huang, and S.-F. Zhou, J. Chromatogr., B, 2008, 867, 111.

27. Z. Tozuka, J. Mass Spectrom. Soc. Jpn., 1997, 45, 377.

Fig. 2 Schematic of LC/ESI-MS/MS with an on-line ISP system.
Fig. 4 Typical product ion spectra of tacrolimus: (a) without ISP, and (b) with ISP.

参照

関連したドキュメント