2017 年度 博士論文
Characterization of Active Materials for Lithium Ion Batteries
by Single Particle Measurement
(
単 粒 子 測 定 法 を 用 い たリ チ ウ ム イ オ ン 電 池 用 活 物 質 の 特 性 評 価
)
March, 2018
Yuto Yamada
Graduate School of Urban Environmental Sciences,
Tokyo Metropolitan University
i
Contents
General introduction 1 - 21
Lithium ion battery
Single particle measurement
Outline of this work
Chapter 1 22 - 54
Investigation of carbon-coating effect on the electrochemical performance of
LiCoPO4 single particle
1-1. Introduction 1-2. Experimental
1-3. Results and discussion 1-4. Conclusions
Chapter 2 55 -73
Development of tweezers-type current collecting probe for single particle
measurement
2-1. Introduction
ii 2-2. Experimental
2-3. Results and discussion 2-4. Conclusions
Chapter 3 74 - 102
Electrochemical analysis of Si anode material for lithium ion batteries by single
particle measurement
3-1. Introduction 3-2. Experimental
3-3. Results and discussion 3-4. Conclusions
General conclusions 103 - 104
Acknowledgements 105 - 107
1
General introduction
Lithium ion battery
Lithium ion batteries have higher operating voltage and specific capacity than other practical batteries such as lead-acid, nickel-cadmium and nickel-metal hydride batteries [1], because of low standard electrode potential of anode and low weight of lithium. In addition, lithium ion batteries have low self-discharge rate and memory effect [2,3]. Therefore, they have been used as power sources for various electric devices such as mobile phone and laptop computer. Recently, the demand of lithium ion batteries is expanding for large scale devices such as electric vehicles and smart grid systems. These applications always need batteries with higher performance. Therefore, improvement of battery properties such as energy density, cycle performance, rate capability, cost and safety, are required.
Lithium ion batteries consist of cathode and anode active materials, electrolytes, separators, current collectors and battery cases. Fig. 1 shows a typical schematic illustration of a lithium ion battery. Charge and discharge reactions occurred through insertion/removal of lithium ion between cathode and anode active materials. Typical electrode reactions of a lithium ion battery using LiCoO2 and graphite for cathode and
2
anode active materials, respectively, are shown below.
Cathode : LiCoO2 ⇄ Li1-xCoO2 + xLi+ + xe- Anode : 6C + xLi+ + xe- ⇄ LixC6
Entire : 6C + LiCoO2 ⇄ LixC6 + Li1-xCoO2
Properties of batteries are strongly depended on the properties of active materials.
In 1980, Goodenough et al. reported the usefulness of LiCoO2 as a cathode material [4]. LiCoO2 has α-NaFeO2 type layered structure and operates at 3.9 V vs.
Li/Li+ with high cycle stability and rate capability [5]. Thus, it is the most common cathode material for lithium ion batteries. The element Co is more expensive than other transition metal elements. Therefore, other layered cathode materials with smaller amount of Co such as LiNixCoyMn1-x-yO2, LiNixCoyAl1-x-yO2, LiNiO2, have been reported [6-12]. These materials have large theoretical capacity (for example 274 mA h g-1).
However, their practical capacities are limited (for example 140 mA h g-1) because of the instability of crystal structure during charge and discharge [13]. LiMn2O4 having spinel structure has also been reported as a cathode active material. Its theoretical capacity and operating potential are 148 mA h g-1 and around 4.0 V vs. Li/Li+, respectively [14,15]. LiNi0.5Mn1.5O4 derived by substitution of Ni into LiMn2O4 is one
3
of the promising cathode active materials because of high operating potential (4.7 V vs.
Li/Li+) [16-18]. LiMPO4 (M= Fe, Mn, Co or Ni) is the cathode materials with olivine structure having the theoretical capacity of around 170 mA h g-1 [19-25]. They have high thermal and structural stability [26]. LiFePO4 is one of the practically used materials for lithium ion batteries. However, their intrinsic electric and lithium conductivities are low [27,28].
Graphite is the most common anode material for lithium ion batteries because of its high cycle stability, rate capability and low operating potential (0.1 V vs. Li/Li+) [29]. However, the theoretical capacity is not so high (372 mA h g-1). Lithium metal is an ideal anode active material having high theoretical capacity (3860 mA h g-1) and low operating potential (0 V vs. Li/Li+). Most serious problem for the practical use of lithium metal is a safety of battery. This is caused by dendrite growth during cycling [30]. The lithium dendrites penetrate into separator, leading to internal short circuit. To overcome the safety problems, improved separators and electrolyte including solid electrolyte have been examined [31-33]. Alloys, such as Si and Sn, are also expected as anode active material having high theoretical capacities (3600 mA h g-1 and 994 mA h g-1 for Si and Sn, respectively) [34,35]. However, these materials show poor cycle performance, because of large volume change during charge and discharge leading to
4
mechanical collapse of electrode. Li4Ti5O12 is one of the practical anode materials for lithium ion batteries [36,37]. Despite its low theoretical capacity (175 mA h g-1) and high operating potential (1.5 V vs. Li/Li+), it has been utilized in practical batteries because of high thermal stability, good cycle performance and high rate capability [38].
Organic solvents such as ethylene carbonate, propylene carbonate, ethyl methyl carbonate, dimethyl carbonate and diethyl carbonate with lithium salts, such as LiPF6
and LiClO4 have been commonly used as electrolyte for lithium ion batteries [39-41].
These electrolytes have safety problems because of flammability of organic solvent [42].
In addition, higher electrochemical stability is required for batteries with higher energy densities. New electrolytes such as polymer electrolytes, ionic liquids, aqueous electrolytes and solid electrolytes have been studied for higher safety and higher energy density [43-50].
Separators play an important role to prevent internal short circuit between cathode and anode. Polypropylene separator having porous structure has been used for lithium ion batteries [51]. For the application of lithium metal as anode, 3-dimensionally ordered microporous (3DOM) separator has also been claimed, which can prevent the growth of lithium dendrite [52].
Al and Cu foils have been used as current collectors for cathode and anode
5
electrodes, respectively. The current collector also affects the energy density of batteries [53-55].
In commercialized lithium ion batteries, composite electrodes are used for both electrodes (Fig. 2). The composite electrode includes active materials, conductive carbon materials and binders. Conductive carbons are used to improve the electric conductivity of the composite electrodes. Acetylene black or ketjen black is mainly used for conductive carbon. [56] Binder is used to bind those materials in the composite electrodes: active materials, conductive carbons and the current collector.
Polyvinylidene difluoride, carboxymethyl cellulose and styrene-butadiene rubber are used as binders. [57] The composite electrodes are prepared from coating slurry containing these materials and solvent, such as of N-methyl-2-pyrrolidone or water.
This coating slurry is applied on the current collector, and dried to obtain composite electrodes.
Single particle measurement
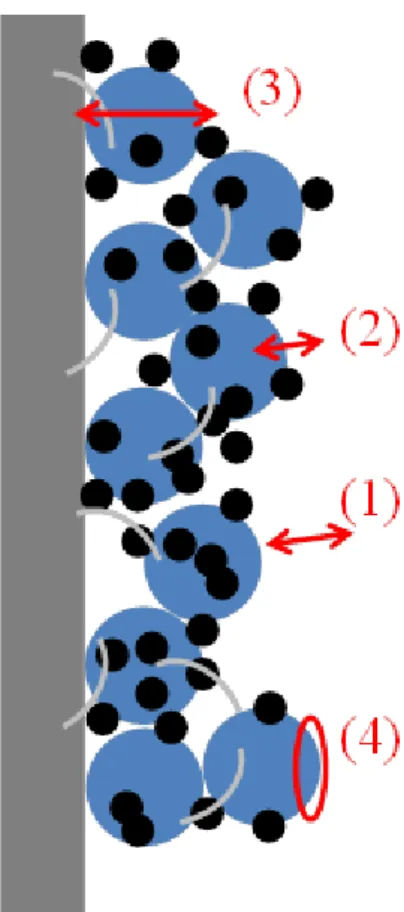
Electrochemical evaluations of active materials using composite electrodes are important. Fig. 3 shows elemental reactions of the composite electrode during charge or discharge process. Elemental reactions are listed below.
6 (1) Diffusion of Li+ ion in electrolyte
(2) Charge transfer process at electrolyte/active material particle interface (3) Diffusion of Li+ ion in active material particle
(4) Side reactions related to electrolyte
However, composite electrodes are not suitable to investigate intrinsic electrochemical properties of active materials. This is because that the electrochemical properties of composite electrodes include the influence of mixing ratio of materials and structures of the electrodes, such as thickness and porosity [58,59]. To solve these problems, single particle measurement method has been developed [60-74]. One active material particle can be evaluated. Therefore, the intrinsic characteristics of the active materials can be obtained without any additive and structural effects. Single particle measurement has some advantages as follows.
1. No influence from mixing ratio of additives and structures of the electrodes 2. Small iR drop because of small current value (~nA scale)
3. Electrochemical parameters of active materials can be analyzed by using model assuming simple particle shape, such as true sphere or cube.
4. Rapid diffusion of Li+ ion in the electrolyte because of spherical diffusion of microelectrode.
7
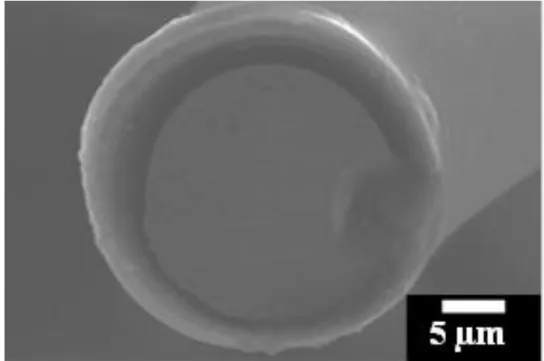
In the single particle measurement, the active material particles having 5 ~ 30 µm in diameter are usually measured. Typical current collector is a Pt or Au wire with a diameter of 10 or 20 µm, which side is surrounded by glass. The scanning electron microscope (SEM) image of micro current collecting probe is shown in Fig. 4.
In this study, the intrinsic electrochemical properties of various active materials were analyzed by this method.
Outline of this work
To improve properties of lithium ion batteries, the development of new active materials are important. Fig. 5 shows theoretical capacity and operating potential of several active materials. Active materials having higher theoretical capacity are the most suitable for batteries. Operating potentials are also important. Electromotive force of batteries is determined by the deference in operating potentials between anode and cathode. Therefore, active materials having lower and higher operating potential are suitable for cathode and anode, respectively. Blue plots in Fig. 5 denote conventional used active materials. These materials have good cycle performance, adequate rate capability and high safety. However, the performance of these materials is limited for the application to next generation batteries which required higher energy density. Red
8
plots in Fig. 5 are the active materials having better performances. However, these materials have some problems (i.e. low cycle performance, low rate capability and low safety) for practical use. Now, detailed analysis of electrochemical reactions is required to solve these problems. In this research, electrochemical properties of the active materials for next generation batteries are analyzed by single particle measurement.
In Chapter 1, electrochemical properties of LiCoPO4 have been analyzed by single particle measurement. LiCoPO4 having high operating potential (4.7 V vs. Li/Li+) is one of promising cathode active materials. Its low electric conductivity is one of the problems for practical use. To solve this problem, carbon-coating was applied on the surface of LiCoPO4 particles and the coating effects were investigated by single particle measurement.
In Chapter 2, a new current collecting probe has been developed for single particle measurement technique. The traditional needle-type current collecting probe so far used for the single particle measurements is not suitable for measurement of active materials having large volume change during charge and discharge. Therefore, tweezers-type probe have been developed and applied to the single particle measurement. The usefulness of the tweezers-type probe was discussed based on the comparison of electrochemical properties obtained by using needle and tweezers-type
9 probes.
In Chapter 3, electrochemical properties of Si were analyzed by single particle measurement. Si is one of promising anode active materials because of high theoretical capacity. However, poor cycle performance caused by large volume change during charge and discharge is the most serious problem for its practical use. So far, new binders have been studied to improve mechanical stability of Si electrode. The effect of the binder was investigated by single particle measurement. The properties of Si particle with and without binder were compared and the role of binder was discussed.
10 References
1. J.-M. Tarascon, M. Armand, Nature, 414, 359-367, (2001).
2. T. Sasaki, Y. Ukyo, P. Novák, Nat. Mater., 12, 569–575, (2013).
3. R.M. Dell, Mater. Design, 7 (3), 124-131, (1986).
4. K. Mizushima, P.C. Jones, P.J. Wiseman, J.B. Goodenough, Mater. Res. Bull., 15 (6), 783-789, 1980.
5. T. Ohzuku, A. Ueda, J.Electrochem. Soc., 141, 2972-2977, (1994).
6. I. Belharouak , Y.-K. Sun , J. Liu , K. Amine, J. Power Sources, 123, 247-252, (2003).
7. K.M. Shaju, G.V. Subba Rao, B.V.R. Chowdari, Electrochim. Acta, 48, 145-151, (2002).
8. N. Yabuuchi, T. Ohzuka, J. Power Sources, 119-121, 171-174, (2003).
9. C.H. Chen, J. Liu, M.E. Stoll, G. Henriksen, D.R. Vissers, K. Amine, J. Power Sources, 128, 278-285, (2004).
10. T. Ohzuku, A. Ueda, M. Nagayama, Y. Iwakoshi, H. Komori, Electrochim. Acta, 38 (9), 1159-1167, (1993).
11. T. Ohzuka, A. Ueda, M. Nagayama, J. Electrochem. Soc., 140, 1862-1870, (1993).
12. J.R. Dahn, J.Electrochem. Soc., 138, 2207-2211, (1991).
11
13. G.G Amatucci, J.M. Tarascon, L.C. Klein, Solid State Ionics, 83, 167-173, (1996).
14. M.M. Thackeray, P.J. Johnson, L.A. de Picciotto, P.G. Bruce, J.B. Goodenough, Mater. Res. Bull., 19 (2), 179-187, (1984).
15. J.M. Tarascon, E. Wan, K. Shokoohi, J.Electrochem. Soc., 138, 2859-2864, (1991).
16. Q. Zhong, A. Bonakdarpour, M. Zhang, Y. Gao, J.R. Dahn, J.Electrochem. Soc., 144, 205-213, (1997).
17. K. Kanamura, W. Hoshikawa, T. Umegaki, J.Electrochem. Soc., 149 (3), A339-A345, (2002).
18. R. Santhanam, B. Rambabu, J. Power Sources, 195, 5442-5451, (2010).
19. A.K. Padhi, K.S. Nanjundaswamy, J.B. Goodenough, J.Electrochem. Soc., 144, 1188-1194, (1997).
20. G. Li, H. Azuma, M. Tohda, Electrochem. Solid-State Lett., 5 (6), A135-A137, (2002).
21. K. Amine, H. Yasuda, M. Yamachi, Electrochem. Solid-State Lett., 3 (4), 178-179, (2000).
22. Y. Maeyoshi, S. Miyamoto, Y. Noda, H. Munakata, K. Kanamura, J. Power Sources, 337, 92-99, (2017).
23. Y. Maeyoshi, S. Miyamoto, H. Munakata, K. Kanamura, J. Power Sources, 350,
12 103-108, (2017).
24. Y. Maeyoshi, S. Miyamoto, H. Munakata, K. Kanamura, J. Power Sources, 376, 18-25, (2018).
25. J. Wolfenstine, J. Allen, J. Power Sources, 142 (1-2), 389-390, (2005).
26. J. Jiang, J.R. Dahn, Electrochem. Commun., 6, 39-43, (2004).
27. S.-Y. Chung , J.T. Bloking , Y.-M. Chiang, Nat. Mater., 1, 123-128, (2002).
28. D. Morgan, A. Van der Ven, G. Ceder, Electrochem. Solid-State Lett., 7 (2), A30-A32, (2004).
29. R. Yazami, Ph. Touzain, J. Power Sources, 9 (3), 365-371, (1983).
30. Z. Li, J. Huang, B. Yann Liaw, V. Metzler, J. Zhang, J. Power Sources, 254, 168-182, (2014).
31. H. Munakata, Y. Yamamoto, K. Sasajima, M. Kijima, D. Yamamoto, S. Woo, K.
Kanamura, 216th ECS Meeting Abst., 632, (2009).
32. P.C. Howlett, D.R. MacFarlane, A.F. Hollenkamp, Electrochem. Solid-State Lett., 7 (5), A97-A101, (2004).
33. Y. Lu, Z. Tu, L.A. Archer, Nat. Mater., 13, 961–969, (2014).
34. B.A. Boukamp, G.C. Lesh, R.A. Huggins, J.Electrochem. Soc., 128 (4), 725-729, (1981).
35. M.N. Obrovac, V.L. Chevrier, Chem. Rev., 114 (23), 11444-11502, (2014).
13
36. S.-I. Pyun, S.-W. Kim, H.-C. Shin, J. Power Sources, 81-82, 248-254, (1999).
37. L. Kavana, M. Grätzel, Electrochem. Solid-State Lett.,5 (2), A39-A42, (2002).
38. K. Nakahara, R. Nakajima, T. Matsushima, H. Majima, J. Power Sources, 117, 131-136, (2003).
39. G.E. Blomgren, J. Power Sources, 81-82, 112-118, (1999).
40. L.O. Valøen, J.N. Reimers, J.Electrochem. Soc., 152 (5), A882-A891, (2005).
41. A. Vallée, S. Besner, J. Prud'Homme, Electrochim. Acta, 37 (9), 1579-1583, (1992).
42. G.G. Botte, R.E. White, Z. Zhang, J. Power Sources, 97-98, 570-575, (2001).
43. F. Croce, G.B. Appetecchi, L. Persi, B. Scrosati, Nature, 394, 456, (1998).
44. D. Saikia , A. Kumar, Electrochim. Acta, 49, 2581-2589, (2004).
45. M. Watanabe, M.L. Thomas, S. Zhang, K. Ueno, T. Yasuda, K. Dokko, Chem. Rev., 117 (10), 7190-7239, (2017).
46. Y. Yamada, K. Usui, K. Sodeyama, S. Ko, Y. Tateyama, A. Yamada, Nature Energy, 1 (10), 16129, (2016).
47. R. Murugan, V. Thangadurai, W. Weppner, Angew. Chem., 119, 7925–7928, (2007).
48. J. Wakasugi, H. Munakata, K. Kanamura, J.Electrochem. Soc., 164 (6), A1022-A1025, (2017).
49. J. Wakasugi, H. Munakata, K. Kanamura, Electrochemistry, 85 (2), 77-81, (2017).
14
50. J. Wakasugi, H. Munakata, K. Kanamura, Solid State Ionics, 309, 9-14, (2017).
51. S.S. Zhang, J. Power Sources, 164, 351-364, (2007).
52. H. Munakata, M. Kotobuki, K. Sasajima, Y. Yamamoto, K. Kanamura, 15th IMLB Meeting Abst., 180, (2010).
53. M. Yao, K. Okuno, T. Iwaki, M. Kato, S. Tanase, K. Emura, T. Sakai, J. Power Sources, 173, 545-549, (2007).
54. S. Zhang, Y. Xing, T. Jiang, Z. Du, F. Li, L. He, W. Liu, J. Power Sources, 196, 6915-6919, (2011).
55. H. Abe, M. Kubota, M. Nemoto, Y. Masuda, Y. Tanaka, H. Munakata, K. Kanamura, J. Power Sources, 334, 78-85, (2016).
56. O. Chusid, E.Ein Ely, D. Aurbach, M. Babai, Y. Carmeli, J. Power Sources, 43 (1-3), 47-64, (1993).
57. T.C. Nirmale, B.B. Kale, A.J. Varma, Int. J. Biol. Macromol., 103, 1032-1043, (2017).
58. L. Fransson, T. Eriksson, K. Edström, T. Gustafsson, J.O. Thomas, J. Power Sources, 101 (1), 1-9, (2001).
59. Y.-H Chen, C.-W. Wang, G. Liu, X.-Y. Song, V.S. Battaglia, A.M. Sastry, J.Electrochem. Soc., 154 (10), A978-A986, (2007).
15
60. M. Nishizawa, R. Hashitani, T. Itoh, T. Matsue, I. Uchida, Electrochem. Solid-State Lett., 1 (1), 10-12, (1998).
61. K. Dokko, M. Mohamedi, Y. Fujita, T. Itoh, M. Nishizawa, M. Umeda, I. Uchida, Electrochem. Solid-State Lett., 148 (5), A422-A426, (2001).
62. K. Dokko, M. Mohamedi, M. Umeda, I. Uchida, J.Electrochem. Soc., 150 (4), A425-A429, (2003).
63. K. Dokko, N. Nakata, K. Kanamura, J. Power Sources, 189, 783-785, (2009).
64. K. Dokko, N. Nakata, Y. Suzuki, K. Kanamura, J. Phys. Chem. C, 114, 8646–8650, (2010).
65. H. Munakata, B. Takemura, T. Saito, K. Kanamura, J. Power Sources, 217, 444-448, (2012).
66. K. Nishikawa, H. Munakata, K. Kanamura, J. Power Sources, 243, 630-634, (2013).
67. J.E. Chae, K. Annaka, K. Hong, S.-I. Lee, H. Munakata, S.-S. Kim, K. Kanamura, Electrochimica Acta, 130, 60-65, (2014).
68. L.M. Reinold, Y. Yamada, M. Graczyk-Zajac, H. Munakata, K. Kanamura, R.
Riedel, J. Power Sources, 282, 409-415, (2015).
69. N. Zettsu, K. Nishikawa, K. Yubuta, K. Sakurai, Y. Yamamoto, Y. Mizuno, S. Oishi,
16
K. Teshima, J. Mater. Chem. A, 3, 17016-17021, (2015).
70. K. Nishikawa, J. Moon, K. Kanamura, J. Power Sources, 302, 46-52, (2016).
71. K. Kanamura, Y. Yamada, K. Annaka, N. Nakata, H. Munakata, Electrochemistry, 84 (10), 759–765, (2016).
72. S. Lim, J.-H. Kim, Y. Yamada, H. Munakata, Y.-S. Lee, S.-S. Kim, K. Kanamura, J.
Power Sources, 355, 164-170, (2017).
73. K. Nishikawa, N. Zettsu, K. Teshima, K. Kanamura, J. Electroanal. Chem., 799, 468-472, (2017).
74. K. Nishikawa, N. Zettsu, K. Teshima, K Kanamura, Electrochemistry, 85 (2), 72-76, (2017).
17
Fig. 1. A schematic illustration of the lithium ion battery.
18
Fig. 2. A schematic illustration of the composite electrode.
19
Fig. 3 Elemental reactions of the composite electrode.
20
Fig. 4. The SEM image of micro current collecting probe.
21
Fig. 5. Theoretical properties of several active materials.
22
Chapter 1
Investigation of Carbon-coating Effect on the Electrochemical Performance of LiCoPO
4Single Particle
1. Introduction
Lithium ion batteries have been used as power sources for portable electric devices due to their high energy density. Recently, their applications have been expanded for larger scale devices such as electric vehicles. Lithium metal phosphates (LiMPO4, M = Fe, Mn, Co, Ni) having olivine structures expected as promising cathode materials for such large lithium ion batteries, because they have excellent thermal and structural stability due to strong covalent bond of P-O. In fact, LiFePO4 has been already commercialized and used as a cathode for large lithium ion batteries [1,2].
However, the operating potential of LiFePO4 is as low as 3.4 V vs. Li/Li+ compared to
~4 V vs. Li/Li+ of other conventionally used cathode materials such as LiCoO2 and LiMn2O4. In order to obtain high energy density of batteries, cathode materials having higher operating potentials are required. LiCoPO4 is an attractive phosphate cathode material since it has high operation potential (4.7 V vs. Li/Li+) and large theoretical
23 capacity (167 mA h g-1) [3].
However, the electronic and lithium ionic conductivities of LiMPO4 are basically very low. To solve this problem, many researches have been done, in which carbon-coating and particle design have been mainly performed [4,5].
Active materials for lithium ion batteries are usually evaluated by making their composite electrodes including conductive carbon and polymer binder. To investigate the electrochemical properties of composite electrode is important for battery design.
However, it is not necessarily effective to investigate the intrinsic electrochemical properties of active materials, because the electrochemical response of composite electrode is influenced by the mixing ratio of materials, electrode porosity and thickness.
Especially, for the cases of active materials with poor conductivity including LiMPO4, the electrochemical properties of composite electrode are strongly influenced by those factors [6,7]. Therefore, porous composite electrode is not suitable to investigate the intrinsic electrochemical properties of LiMPO4. In order to overcome this problem, we have employed a single particle measurement, which can evaluate one active material particle, resulting in the effective elimination of additive and structure effects on the electrochemical responses of active material in the composite electrode [2,8-10].
In this study, the carbon-coating effect on the electrochemical properties of
24
LiCoPO4 was investigated by single particle measurement to clarify its optimal coating.
Micrometer-scale particles are suitable not only for single particle measurement but also for the suppression of electrolyte decomposition in high voltage region. Therefore, the LiCoPO4 particles with and without carbon-coating were synthesized in micro-scale sizes by hydrothermal method, which is one of useful methods to control particle size of active material [5,11,12]. To prepare larger size particles for single particle measurement, hydrothermal treatment with a carbon source is not suitable, because some carbon sources prevent the particle growth [5]. Therefore, carbon-coating process was carried out after synthesizing pristine LiCoPO4. Sucrose has been used as a carbon source, which is typical material for carbon-coating after synthesizing LiMPO4 [13,14].
2. Experimental
0.09 mol of Li3PO4 (Koujundo Chemical Laboratory Co., Ltd) as Li and P sources, and 0.09 mol of CoSO4 (CoSO4·7H2O, Wako Pure Chemical Industries, Ltd.) as Co source were dissolved into 30 ml of water deaerated with N2 gas. This process was carried out under N2 atmosphere. The prepared precursor solution was put into an autoclave. Then, hydrothermal treatment was carried out at 200 C for 48 h with stirring.
After the hydrothermal treatment, the LiCoPO4 particles were separated, collected by
25
centrifugation and freeze-dried. As a carbon source, 0.05, 0.1 or 0.2 g of sucrose (Wako Pure Chemical Industries, Ltd.) was dissolved into 1 mL of water and stirred for 3 min.
2.0 g of the synthesized LiCoPO4 was mixed with this solution. After stirring for 15 min, the mixed solution was dried under air at 110 C, and then heated at 700 C for 1 hour
under a mixed gas of Ar and H2 (97 : 3 in volume) to obtain carbon-coated LiCoPO4. The carbon-coated LiCoPO4 prepared with 0.05 g, 0.1 g and 0.2 g sucrose were described as LiCoPO4/C0, LiCoPO4/C1 and LiCoPO4/C2, respectively.
Crystal structures of samples were identified by X-ray diffraction (XRD, RINT 2000/PC, Rigaku Co.) with Cu K radiation. The particle size and morphology were
observed by scanning electron microscopy (SEM, JSM-7500F, JEOL Ltd.). Raman spectroscopy was conducted withNRS-1000 (Jasco Co.) to confirm the coating states of carbon on sample particles. The elemental mapping of the sample particles was obtained by energy dispersive X-ray spectroscopy (EDX, X-Max 50, Oxford Instruments plc).
The amount of carbon was evaluated by thermogravimetric analysis (DTG-60H, Shimadzu Co.).
Electrochemical properties of synthesized samples were evaluated by single particle measurement. Fig. 1 shows an original measurement system. A measurement cell including an electrolyte, a counter electrode and active material particles was put on
26
the stage of an optical microscope (VHX-1000, KEYENCE CORPORATION). A mixed solvent of ethylene carbonate and ethyl methyl carbonate in a volume ratio of 3 : 7 containing 1 mol dm-3 LiPF6 (Kishida chemical Co., Ltd.) was used as the electrolyte. A piece of lithium foil attached on Ni wire was used as the counter electrode. A micro current collector of Au wire with a diameter of 10 µm was used, whose side was surrounded by glass to reduce a background current caused by double layer capacitance.
The tip of micro current collector was contacted to one particle of LiCoPO4 samples by using a manipulator system (QuickPro, Micro Support Co., Ltd.) under observation with an optical microscope. The charge/discharge tests were carried out with an electrochemical analyzer (SP-200, BioLogic Science Instruments) at room temperature under Ar atmosphere.
Electrochemical properties of LiCoPO4 were also evaluated by making their composite electrodes with a weight ratio of synthesized LiCoPO4, ketjen black and PVdF in 75 : 15 : 10. These materials were dispersed in N-methyl-2-pyrrolidone to prepare a slurry. The slurry was coated on Al foil as a current collector and then dried at 80 °C overnight. The electrode was punched into a circle in a diameter of 14 mm. 2032 coin-type cells which were composed of the prepared LiCoPO4 electrode, polypropylene separator, electrolyte and Li foil (Honjo Metal Co., Ltd.) anode were
27
prepared in Ar atmosphere. A mixed solvent of ethylene carbonate and diethyl carbonate with 1 : 2 in volume containing 1 mol dm-3 LiPF6 (Kishida chemical Co., Ltd.) was used as an electrolyte. The charge/discharge tests were carried out with a battery charge/discharge system (HJ1001SD8).
3. Results and discussion
Fig. 2 shows the SEM images of LiCoPO4, LiCoPO4/C0, LiCoPO4/C1 and LiCoPO4/C2. Cubic-shape particles were observed. Several particles had over 10 µm size. These particles were utilized for single particle measurement. Significant difference in particle size and shape were not observed in these samples. Moreover, carbon was not clearly observed in SEM images of carbon-coated samples.
To confirm the distribution of carbon, the elemental mappings of O, P and C for LiCoPO4/C0, LiCoPO4/C1 and LiCoPO4/C2 was carried out, as shown in Fig. 3. All samples showed uniform distribution of O and P. In addition, homogeneous carbon was also observed on the surface of particles, indicating that the carbon-coating was performed uniformly. Especially, LiCoPO4/C2 showed larger amount of carbon compared with other carbon-coated samples.
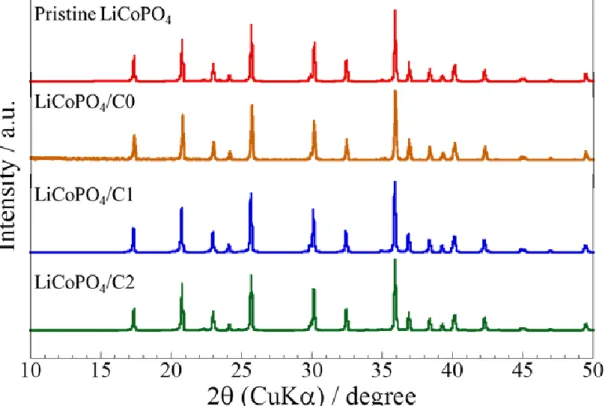
X-ray diffraction patterns of LiCoPO4, LiCoPO4/C0, LiCoPO4/C1 and
28
LiCoPO4/C2 are shown in Fig. 4. All patterns were indexed based on olivine structure with orthorhombic Pnma space group, suggesting that well-crystallized particles were obtained. From this result, it is confirmed that the carbon-coating process in this study does not effect on the crystal structure of LiCoPO4.
Raman spectroscopy was performed to confirm carbon-coating state of samples [15,16]. Raman spectra of LiCoPO4, LiCoPO4/C0, LiCoPO4/C1 and LiCoPO4/C2 are shown in Fig. 5. A sharp peak was observed at 950 cm-1 ascribed to PO43-
anions symmetric stretching in all samples. In the carbon-coated samples, the broad peaks also observed at 1350 cm-1 and 1500 cm-1 can be ascribed to D band and G band of carbon, respectively. As increasing amount of carbon, stronger peaks of carbon were observed.
From the results of EDX (shown in Fig. 3), uniform carbon distribution was observed for carbon-coated samples. However, the peak of PO43-
was clearly observed even for carbon-coated samples. From this result, two patterns of carbon-coating state are considered. When the thickness of carbon layer is 5-12 nm, very weak PO43-
peak is observed [17]. Therefore, one of possible reasons is that carbon layer is very thin (less than 5 nm). Another possible reason is that LiCoPO4 particle is not fully covered with carbon [5].
The amount of carbon was estimated by thermogravimetric analysis as shown
29
in Fig. 6. The measurement was carried out in air atmosphere with a heating rate of 10
C min-1. In carbon-coated samples, the weight loss due to oxidation of the carbon on LiCoPO4 surface were observed from 440 C to 660 C. The increase in weight at around 390 C is attributable to the oxidation of cobalt [16,18]. The amount of carbon
for LiCoPO4/C0, LiCoPO4/C1 and LiCoPO4/C2 were determined by the weight loss as 0.3wt%, 0.8 wt% and 1.7 wt% respectively (Fig. 6). Theoretical values calculated from the amounts of sucrose used for carbon-coating were 1.04 wt% (LiCoPO4/C0), 2.06 wt% (LiCoPO4/C1) and 3.94 wt% (LiCoPO4/C2), respectively. Therefore, it can be seen that some amount of sucrose was not converted to carbon in the synthesis process.
Electrochemical performance of LiCoPO4 samples were evaluated by charge/discharge tests of coin-type cells using their composite electrodes. The charge and discharge curves of the coin-type cell of LiCoPO4 without carbon-coating are shown in Fig. 7(a). The charge was performed at 0.1 C until the potential reached to 5.1 V vs. Li/Li+ and then the potential was hold until the current declined to 0.01 C. The discharge was conducted at 0.1 C until potential reached to 2.5 V vs. Li/Li+. A potential plateau was clearly observed at 4.7 V vs. Li/Li+. The initial discharge capacity was 71 mA h g-1 which was lower than the half of theoretical capacity (167 mA h g-1), due to low electric conductivity of LiCoPO4. An irreversible capacity due to electrolyte
30
decomposition was observed [19]. The charge and discharge curves of LiCoPO4/C0, LiCoPO4/C1 and LiCoPO4/C2 were shown in Fig. 7(b), (c) and (d), respectively. The discharge and charge conditions were the same with those used for the LiCoPO4
evaluation. Both the potential plateau and irreversible capacity were observed as similar to those of pristine LiCoPO4. The larger initial discharge capacities of 105, 110 and 114 mA h g-1 were observed for LiCoPO4/C0, LiCoPO4/C1 and LiCoPO4/C2, respectively.
This is due to an improvement of electric conductivity by carbon-coating on the surface of LiCoPO4.
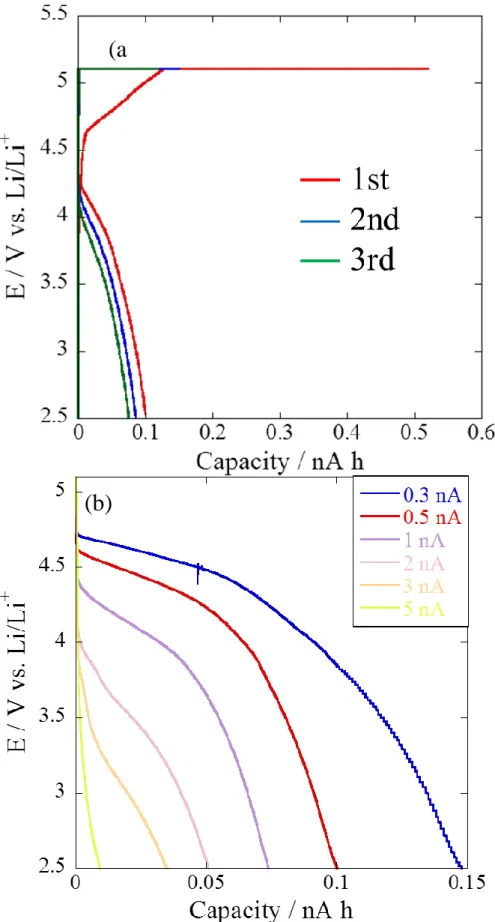
Fig. 8 shows the charge and discharge curves of LiCoPO4 single particle without carbon-coating. The particle size was 50 µm in diameter. The particle was charged at 0.2 nA until the potential reached to 5.1 V vs. Li/Li+ and then the potential was held at 5.1 V for 2 hours. The discharge were carried out at 0.2 nA until the potential reached to 2.5 V vs. Li/Li+. When the charge was started, the potential rapidly increased and then reached to 5.1 V vs. Li/Li+. In the discharge process, the potential plateau was observed at 4.5 V vs. Li/Li+ in the 1st cycle and those appeared at lower potentials in the following cycles (4.3 V vs. Li/Li+ in 2nd, 4.2 V vs. Li/Li+ in 3rd).
These values were lower than theoretical operating potential [3]. In addition, LiCoPO4
showed very small discharge capacity. These results indicate that LiCoPO4 particle
31
without carbon-coating has very high electrochemical impedance. In the case of composite electrode including binder and conductive material, LiCoPO4 without carbon-coating showed a clear potential plateau at 4.7 V vs. Li/Li+ in the discharge process. Probably, the difference between the single particle and composite electrodes of LiCoPO4 is due to the improvement of electric conductivity by the conductive material in the composite electrode.
Fig. 9(a) shows the charge and discharge curves of LiCoPO4/C0 single particle at initial 3 cycles. The particle size was 20 µm in diameter. The particle was charged at 3 nA until the potential reached to 5.1 V vs. Li/Li+ and then the potential was held until the charge current dropped to 0.3 nA. The discharge was carried out at 3 nA until the potential reached to 2.5 V vs. Li/Li+. This current was higher than that for pristine LiCoPO4 single particle measurement. LiCoPO4/C0 single particle showed potential plateaus in the 1st charge process and the 1st ~ the 3rd discharge processes. Fig. 9(b) shows the discharge rate capability of LiCoPO4/C0. All charge processes were carried out at 3 nA until the potential reached to 5.1 V vs. Li/Li+ and then the potential was held until the charge current dropped to 0.3 nA. The discharge processes were carried out at various current values from 0.3 nA to 5 nA. In the discharge process at 0.3 nA, the potential plateau was observed at 4.7 V vs. Li/Li+, which corresponds to the plateau in
32
composite electrode shown in Fig.7 (b). These results indicate the improvement of electrochemical performance of LiCoPO4 particle by the carbon-coating. However, the polarization was still large.
Fig. 10(a) shows the charge and discharge curves of LiCoPO4/C1 single particle during initial 3 cycles at the same current value for LiCoPO4/C0 single particle measurement. The particle size was 20 µm in diameter. The potential plateaus were observed in both charge and discharge curve. Although irreversible capacity and capacity fading were observed during 3 cycles, the charge and discharge curves similar to those of composite electrodes were obtained. Fig. 10(b) shows the discharge rate capability of LiCoPO4/C1. All charge processes were same with LiCoPO4/C0 single particle measurement. The discharge processes were carried out at various current values from 0.3 nA to 20 nA. The electrochemical performance was greatly improved by coating 0.8 wt% of carbon.
Fig. 11(a) shows the charge and discharge curves of initial 3 cycles and discharge rate capability of LiCoPO4/C2 single particle. The particle size was 20 µm and electrochemical measurement was carried out in the same current values with LiCoPO4/C1 shown in Fig. 10. In the initial 3 cycles, irreversible capacity and capacity fading were observed as similar to LiCoPO4/C1. Electrochemical performance was
33
improved compared with pristine LiCoPO4. The rate capability in Fig. 11(b) was not so different from that for LiCoPO4/C1. Therefore, it can be concluded that 0.8 wt% or higher of carbon-coating is suitable for single particle electrode of LiCoPO4.
For more detailed investigation, quasi Tafel plots were made for LiCoPO4/C1 and LiCoPO4/C2 single particles from their rate capabilities. Fig. 12 shows the quasi Tafel plot of LiCoPO4/C1 in the state of depth of discharge (DOD) 10 %. DOD was calculated from the capacity in the discharge process at 0.3 nA. Current densities were calculated from the discharge current value and the surface area of particle by assuming that the particle is a cube with 20 µm on each side. When the relationship between potentials and current densities accords to Tafel equation, kinetics of the electrochemical reactions are limited by the charge transfer process. Tafel equation is given as
log 𝑖 = log 𝑖0+ 2.303𝑅𝑇𝛼𝐹 𝜂. (1)
Here, i is current density, i0 is the exchange current density, α is the transfer coefficient, F is the faraday constant, R is the gas constant, T is the reaction temperature, and η is
the overpotential. The overpotential η in this study was obtained from the potential difference between the equilibrium potential (Eequ) and discharge potential at each current value. Here, Eequ was assumed to be the potential value in the discharge process
34
at 0.3 nA, because Eequ was difficult to estimate due to the self-discharge of LiCoPO4
[20,21]. In this experiment, α was considered as 0.5, and T was 298 K. i0 can be obtained by the intersection point of the Tafel equation and the equilibrium potential.
The charge transfer resistance Rct is calculated with formula (2).
𝑅ct = 𝐹𝑖𝑅𝑇
0 (2)
In the high current values, the obtained plots deviated from the Tafel equation. This indicates that kinetics of the electrochemical reactions are limited by the Li+ diffusion process in the LiCoPO4 particle. In the case of one-dimensional diffusion, the diffusion coefficient D can be estimated by formula (3).
𝑙 = √2𝐷𝑡 (3)
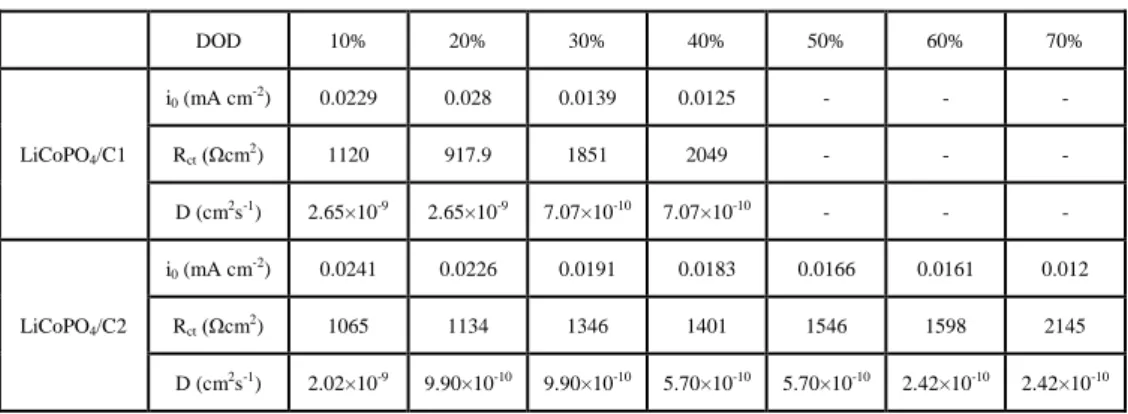
Here, l is the radius of the particle, t is the discharge time for the current value at starting of the deviation from the Tafel equation. The value of i0, Rct, and D at various DODs were summarized in Tables 1. At the high DOD region, electrochemical parameters could not be obtained due to large deviation from Tafel equation even at low discharge currents. Rct of LiCoPO4/C1 showed higher value than that of LiCoPO4/C2 except for DOD 20 %. Larger amount of carbon maybe provide lower Rct. D for LiCoPO4/C1 and LiCoPO4/C2 were 10-11 to 10-9 cm2 s-1, which were similar values.
This indicated that D is independent from carbon-coating. These values were
35
comparable to the diffusion coefficient of LiFePO4 secondary particle estimated by single particle measurement [2]. Other studies have reported the D value of approximately 10-13 cm2 s-1 using composite electrode of LiCoPO4 [5,22,23]. These values are smaller than that of single particle in several orders of magnitude. The difference between this study and other studies is due to the difference of the measurement systems: one active material and composite electrode. Namely, Li+ diffusion in the composite electrodes is affected by Li+ diffusion in electrolyte. On the other hand, the single particle electrodes have no effect of diffusion in electrolyte due to spherical diffusion. Moreover, the D value of carbon-coated LiCoPO4 estimated by single particle measurement is closer to the values calculated by first-principles method (10-5 cm2 s-1 and 10-9cm2 s-1 for CoPO4 and LiCoPO4, respectively), compared with the value estimated using composite electrode [24]. However, the D values were not so close to calculated values. This indicates that suitable particle design and crystalline are also important to improve electrochemical performance of LiCoPO4.
Discharge were carried out at 3 nA after rate capability test for the particle of LiCoPO4/C1 and LiCoPO4/C2, as shown in Fig. 10 and Fig. 11, respectively. Fig. 13(a) shows the discharge curves of LiCoPO4/C1 after rate capability test. The discharge capacities of LiCoPO4/C1 and LiCoPO4/C2 were 0.275 nA h and 0.352 nA h which are
36
42 % and 55 % of 1st discharge, respectively. In high voltage range, electrolyte decomposition actively occurred at direct contact area of LiCoPO4 with electrolyte [20], which cause capacity fading [25]. Therefore, the better cycleability for LiCoPO4/C2 was observed, probably due to larger coverage area of carbon. However, cycle performance was still low even for LiCoPO4/C2. To prevent capacity fading, improvement of carbon-coating or development of electrolyte with high stability at high voltage are required.
4. Conclusions
The micrometer-scale LiCoPO4 particles with and without carbon-coating were prepared by hydrothermal method. Their electrochemical performance was evaluated by single particle measurement. In the charge and discharge curves of coin-type cells with composite electrodes, both pristine LiCoPO4 and carbon-coated LiCoPO4 showed clearly a discharge plateau at 4.7 V vs. Li/Li+, and the carbon-coated LiCoPO4 showed larger discharge capacity (over 105 mA h g-1) than that of pristine LiCoPO4 (71 mA h g-1). In contrast, the single particle of pristine LiCoPO4 and 0.3 wt% carbon-coating LiCoPO4 showed poor discharge capacity and lower potential plateau, indicating that 15 wt% of conductive material in the composite electrode played an important role for
37
electric conductivity of electrodes. On the other hand, 0.8 and 1.7 wt% carbon-coating LiCoPO4 single particle showed extremely improved electrochemical performances.
Therefore, when using 0.8 wt% carbon-coating LiCoPO4 particles, the amount of conductive carbon additive in the composite electrode can be reduced, which can improve the capacity density of electrode. The diffusion coefficient of Li+ ion in the carbon-coated LiCoPO4 particle showed the values from 10-11to 10-9 cm2s-1 at different DODs, which is higher than those reported in the previous studies using composite electrodes. The diffusion coefficient could be evaluated without the effect of Li+ diffusion in the electrolyte by single particle measurement. However, these values were lower than the value calculated by first-principle mothed. Moreover, cycle performance of carbon-coated LiCoPO4 particle was still low. Therefore, further improvement is required.
38 References
1. H. Huang, S.-C. Yin, and L.F. Nazar, Electrochem. Solid-State Lett., 4 (10), A170-A172, (2001).
2. H. Munakata, B. Takemura, T. Saito, K. Kanamura, J. Power Sources, 217, 444-448, (2012).
3. K. Amine, H. Yasuda, and M. Yamachi, Electrochem. Solid-State Lett., 3 (4), 178-179, (2000).
4. J. Wolfenstine, J. Read, J.L. Allen, J. Power Sources, 163, 1070–1073, (2007).
5. Y. Maeyoshi, S. Miyamoto, Y. Noda, H. Munakata, K. Kanamura, J. Power Sources, 337, 92-99, (2017).
6. V. Palomares, A. Goñi, I. G. de Muro, I. de Meatza, M. Bengoechea, I. Cantero, T.
Rojo, J. Power Sources, 195, 7661–7668, (2010).
7. X. Qi, B. Blizanac, A. DuPasquier, M. Oljaca, J. Li, M. Winter, CARBON, 64, 334–
340, (2013).
8. K. Dokko, M. Mohamedi, M. Umeda, I. Uchida, J. Electrochem. Soc., 150 (4), A425-A429, (2003).
9. K. Kanamura, Y. Yamada, K. Annaka, N. Nakata, H. Munakata, Electrochemistry, 84 (10), 759–765, (2016).
39
10. S. Lim, J.-H. Kim, Y. Yamada, H. Munakata, Y.-S. Lee, S.-S. Kim, K. Kanamura, J.
Power Sources, 355, 164-170, (2017).
11. B. Ellis, W.H. Kan, W.R.M. Makahnouk, L.F. Nazar, J. Mater. Chem., 17, 3248–
3254, (2007).
12. X. Huang, J. Ma, P. Wu, Y. Hu, J. Dai, Z. Zhu, H. Chen, H. Wang, Mater. Lett., 59, 578– 582, (2005).
13. S. Franger, F. Le Cras, C. Bourbon, H. Rouault, Electrochem. Solid-State Lett., 5 (10), A231-233, (2002).
14. H.-C. Dinh, S.-I. Mho, Y. Kang, I.-H. Yeo, J. Power Sources, 244, 189-195, (2013).
15. Z. G. Lu, M. F. Lo, and C. Y. Chung, J. Phys. Chem. C, 112, 7069-7078, (2008).
16. E. Markevich, R. Sharabi, O. Haik, V. Borgel, G. Salitra, D. Aurbach, G. Semrau, M.A. Schmidt, N. Schall, C. Stinner, J. Power Sources, 196, 6433–6439, (2011).
17. A. Vadivel Murugan, T. Muraliganth, and A. Manthiram, J. Phys. Chem. C, 112, 14665–14671, (2008).
18. I. Belharouak, C. Johnson, K. Amine, Electrochem. Commun., 7, 983–988, (2005).
19. K. Xu, S.P. Ding, T.R. Jow, J. Electrochem. Soc., 146 (11), 4172-4178, (1999).
20. N.N. Bramnik, K. Nikolowski, C. Baehtz, K.G. Bramnik, H. Ehrenberg, Chem.
Mater., 19 (4), 908–915, (2007).
40
21. J. Manzi, F.M. Vitucci, A. Paolone, F. Trequattrini, D. Di Lecce, S. Panero, S. Brutti, Electrochim. Acta, 179, 604–610, (2015).
22. S. Brutti, J. Manzi, D. Meggiolaro, F.M. Vitucci, F. Trequattrini, A. Paolone, O.
Palumbo, J. Mater. Chem. A, 5, 14020–14030, (2017).
23. J. Xie, N. Imanishi, T. Zhang, A. Hirano, Y. Takeda, O. Yamamoto, J. Power Sources, 192, 689–692, (2009).
24. D. Morgan, A. Van der Ven, and G. Ceder, Electrochem. Solid-State Lett., 7 (2), A30-A32, (2004).
25. A. Eftekhari, J. Electrochem. Soc., 151 (9), A1456-A1460 (2004).
41
DOD 10% 20% 30% 40% 50% 60% 70%
LiCoPO4/C1
i0 (mA cm-2) 0.0229 0.028 0.0139 0.0125 - - -
Rct (Ωcm2) 1120 917.9 1851 2049 - - -
D (cm2s-1) 2.65×10⁻⁹ 2.65×10⁻⁹ 7.07×10⁻¹⁰ 7.07×10⁻¹⁰ - - -
LiCoPO4/C2
i0 (mA cm-2) 0.0241 0.0226 0.0191 0.0183 0.0166 0.0161 0.012
Rct (Ωcm2) 1065 1134 1346 1401 1546 1598 2145
D (cm2s-1) 2.02×10⁻⁹ 9.90×10⁻¹⁰ 9.90×10⁻¹⁰ 5.70×10⁻¹⁰ 5.70×10⁻¹⁰ 2.42×10⁻¹⁰ 2.42×10⁻¹⁰
Table 1. Electrochemical parameters of LiCoPO4/C1 and LiCoPO4/C2 single particle at various DOD.
42
Fig. 1. Single particle measurement system.
43
Fig. 2. SEM images of (a) pristine LiCoPO4, (b) LiCoPO4/C0, (c) LiCoPO4/C1 and (d) LiCoPO4/C2.
44
Fig. 3. EDX mappings of O, P and C for LiCoPO4/C0, LiCoPO4/C1 and LiCoPO4/C2.
45
Fig. 4. XRD patterns of pristine LiCoPO4, LiCoPO4/C0, LiCoPO4/C1 and LiCoPO4/C2.
46
Fig. 5 Raman spectroscopy of pristine LiCoPO4, LiCoPO4/C0, LiCoPO4/C1 and LiCoPO4/C2.
600 800
1000 1200
1400 1600
1800
Pristine LCP/C0 LCP/C1 LCP/C2
Int e n sit y / a .u.
Raman shift / cm -1
47
Fig. 6. Thermogravimetric analysis of pristine LiCoPO4, LiCoPO4/C0, LiCoPO4/C1 and LiCoPO4/C2.
48
Fig. 7. Charge/discharge curves of (a) pristine LiCoPO4, (b) LiCoPO4/C0, (c) LiCoPO4/C1 and (d) LiCoPO4/C2 as composite electrodes.
49
Fig. 8. Charge/discharge curves of pristine LiCoPO4 single particle.
50
(a
(b)
Fig. 9. (a) Charge/discharge curves at initial 3 cycles and (b) rate capability of LiCoPO4/C0.
51
(a
(b)
Fig. 10. (a) Charge/discharge curves at initial 3 cycles and (b) rate capability of LiCoPO4/C1.
52
Fig. 11. (a) Charge/discharge curves at initial 3 cycles and (b) rate capability of LiCoPO4/C2.
(a)
(b)
53
Fig. 12. Tafel plot of LiCoPO4/C1 in the state of DOD 10 %.
54
(a)
(b)
Fig. 13. Discharge curve of (a) LiCoPO4/C1 and (b) LiCoPO4/C2 particle at 3 nA after rate capability test.
55
Chapter 2
Development of tweezers-type current collecting probe for single particle measurement
1. Introduction
Lithium ion batteries have been used as power sources for various electric devices. Recently, they are used for large scale electric devices such as electric vehicles and smart grid systems. Batteries are composed of various materials such as active materials, separators, electrolytes and so on. The active materials are the most important in batteries, which play an important role for charge and discharge reactions. Therefore, a characterization for electrochemical properties of the active materials is very important to improve properties of batteries.
In most publications, active materials have been evaluated by using composite electrodes which are composed of active materials, conductive carbon and binders.
However, the evaluation by using composite electrodes may not be suitable to investigate intrinsic electrochemical properties. In fact, the electrochemical properties of composite electrodes can be influenced by mixing ratio of materials, thickness and porosity of electrodes [1,2]. A single particle measurement, which is one of methods to
56
solve the problem have been carried out [3-17]. In this method, the electrochemical properties of one active material particle can be measured without any effects from mixing ratio, thickness and porosity of electrodes. Therefore, intrinsic electrochemical properties of active materials can be evaluated. Several studies have been published to evaluate the intrinsic electrochemical properties of various active materials by using this method.
In the single particle measurement method, a needle-type micro probe has been used as a current collector. The tip of micro probe is a metal wire with a diameter of 10 or 20 µm surrounded by a glass capillary to reduce contact area with electrolyte, in order to prevent the reaction of electrolyte on current collector. By using this probe, electrochemical properties of one active material particle can be measured more precisely. However, it is difficult to measure active materials having large volume change during charge and discharge. The disconnection between the current collecting probe and active material particle occurred by the large volume change. Therefore, a new current collecting probe has been required to expand measurable materials by single particle method. In this study, a tweezers-type micro probe as current collector was developed and applied to single particle measurement.
57 2. Experimental
LiCoO2 (MTI Corporation) was used as an active material. The schematic illustration of single particle measurement system is shown in Fig 1. An optical microscope (VHX-1000, KEYENCE CORPORATION) was set in the glovebox. The measurement cell was put on the stage of optical microscope. A mixed solvent of ethylene carbonate and propylene carbonate with 1 : 1 in volume containing 1 mol dm-3 LiClO4 (EC/PC/LiClO4) was used as an electrolyte. A lithium foil (Honjo Metal Co., Ltd.) attached on Ni wire was used as a counter electrode. An active material particle was picked up with tweezers (5UF.S, Ideal-tek) under optical microscope observation by operating a manipulator (QuickPro, Micro Support Co., Ltd.) and a pick up tool (MTW-1, Micro Support Co., Ltd.). The tweezers were coated by seal material for batteries (1171E, ThreeBond Fine Chemical Co., Ltd.) to reduce background reactions of electrolyte on tweezers. A needle-type probe was also used. The tip of needle-type probe was a Au wire with a diameter of 10 µm surrounded by a glass capillary. The electrochemical tests were carried out with an electrochemical analyzer (SP-200, BioLigic Science Instruments) at room temperature.
3. Results and discussion
58
To investigate background reactions of electrolyte on each current collecting probe, cyclic voltammetry was carried out without active material particle. Fig 2 shows cyclic voltammograms of each current collecting probe from 3.0 to 4.2 V vs. Li/Li+ in EC/PC/LiClO4 at the scan rate of 10 mV s-1. Although tweezers-type probe showed larger background current than that for needle-type probe, the current was enough small to evaluate electrochemical properties of one LiCoO2 particle.
Fig. 3 shows charge and discharge curves of LiCoO2 single particles using needle-type and tweezers-type probes at initial 3 cycles. Both particles have 20 µm in diameter. Charge and discharge were carried out at 3 nA in the potential range from 3.0 to 4.2 V vs. Li/Li+. The potential plateaus were observed at 3.9 V vs. Li/Li+ corresponding to electrochemical properties of LiCoO2. Though the irreversible capacities were observed in the first cycle, 100 % of coulombic efficiency was approximately observed for both current collecting probes during the second and the third cycles, as shown in the table 1. Similar curves were obtained for needle-type and tweezers-type probes.
The rate capabilities of LiCoO2 single particle measured with needle-type and tweezers-type probes were shown in Fig. 4. All charge processes were carried out at 3 nA and discharge processes were carried out at various currents from 3 to 100 nA. In the
59
discharge process at 100 nA, 76.9 % and 78.3 % of capacities in the discharge process of 3 nA were observed for needle-type probe and tweezers-type probe, respectively.
In order to analyze the electrochemical properties of LiCoO2, quasi tafel plots were made from the results of rate capabilities. Fig. 5 shows the tafel plots of LiCoO2
single particles obtained from single particle measurement by using needle-type and tweezers-type probes at the state of depth of discharge (DOD) 10 %. Current densities were calculated from each discharge current and the surface area of particle by assuming true sphere particles having 20 µm in diameter. When the plots obey the tafel equation, kinetics of the electrochemical reactions are limited by the charge transfer process. Tafel equation is given as
log 𝑖 = log 𝑖0+ 2.303𝑅𝑇𝛼𝐹 𝜂. (1)
Here, i is current density, i0 is the exchange current density, α is the transfer coefficient, F is the faraday constant, R is the gas constant, T is temperature. And η is a over
potential which is the potential deviation feom the equilibrium potential (Eequ). Eequ was calculated with formula (2).
𝐸equ =𝐸DOD 𝑥 % +𝐸SOC (100−𝑥) %
2 (2)
x is the percent of DOD which equals to 10 for the tafel plots shown in Fig. 5. EDOD and ESOC mean the potential in the discharge and charge process, respectively. In this
60
experiment, α was considered as 0.5, and T was 298 K. i0 can be obtained by the intersection point of the tafel plot at the equilibrium potential. Charge transfer resistance Rct is calculated with formula (3).
𝑅ct = 𝐹𝑖𝑅𝑇
0 (3)
In high current, the obtained plot was deviated from the tafel plot. This indicates that kinetics of the electrochemical reactions are limited by the Li+ diffusion process in the LiCoO2 single particle. The diffusion coefficient can be estimated from formula (4).
𝑙 = √6𝐷𝑡 (4)
Here, l is the radius of the particle, t is the discharge time at the current whrn the deviation from the tafel equation start. The electrochemical parameters, i0, Rct and D of LiCoO2 calculated from the results measured with needle-type probe were 1.52 mA cm-2, 16.9 cm2 and 3.03 × 10⁻⁹ cm2 s-1, respectively. On the other hand, i0, Rct and D measured with tweezers-type probe ware 1.04 mA cm-2, 24.8 cm2 and 3.09 × 10⁻⁹ cm2 s-1, respectively. The electrochemical parameters measured with each current collecting probe at various DOD (10-90 %) were calculated and summarized in Table 2 and Fig. 6.
LiCoO2 measured with tweezers-type probe showed slightly higher Rct than that obtained by using needle-type probe. This may due to lower surface area contacting with electrolyte, the difference of particle shape and the individually different
61
electrochemical performance of each LiCoO2 particle.
Fig 7 shows the cycle performance of LiCoO2 single particle measured with needle-type and tweezers-type probes. Charge and discharge were carried out at current of 3 nA during 50 cycles. The LiCoO2 particle measured with needle-type and tweezers-type probes had 91 % and 89 % of capacity retention at the 50th cycle, respectively.
4. Conclusions
The electrochemical analysis of LiCoO2 by using single particle measurement method has been carried out by using both the conventional needle-type and the new tweezers-type probes. Although tweezers-type probe showed larger background current due to larger surface area of the current collecting probe contacting to electrolyte, the current value was enough small to measure LiCoO2 single particle in the potential range from 3.0 to 4.2 V vs. Li/Li+. From the results of rate capability obtained by using each current collecting probe, the LiCoO2 particle measured with tweezers-type probe showed slightly larger charge transfer resistance. Nevertheless, each parameter is almost similar. The cycle performance of LiCoO2 particles measured with each probe showed almost same properties. These results indicate that the tweezers-type current collecting
62
probe can be utilized to single particle measurement instead of conventional needle-type probe. Charge/discharge properties of the active materials having large volume change will be evaluated by using tweezers-type probe.