Phase of Antiferroelectric PbHfO3
著者 Fujishita Hideshi, Kato Kenichi, Nishibori Eiji, Takata Masaki, Sakata Makoto, Katano Susumu
著者別表示 藤下 豪司
journal or
publication title
Journal of the Physical Society of Japan
volume 87
number 12
page range 124603
year 2018‑12
URL http://doi.org/10.24517/00055243
doi: 10.7566/JPSJ.87.124603
Structural Modulations in the Intermediate Phase of Antiferroelectric PbHfO
3Hideshi Fujishita
1∗, Kenichi Kato
2, Eiji Nishibori
3, Masaki Takata
2,4, Makoto Sakata
5, and Susumu Katano
61
Institute of Liberal Arts and Science, Kanazawa University, Kanazawa 920-1192, Japan
2
RIKEN SPring-8 Center, Sayo, Hyogo 679-5148, Japan
3
Faculty of Pure and Applied Sciences, Tsukuba Research Center for Energy Materials Science, University of Tsukuba, Tsukuba, Ibaraki 305-8571, Japan
4
Institute of Multidisciplinary Research for Advanced Materials (IMRAM), Tohoku University, Sendai 980-8577, Japan
5
Japan Synchrotron Radiation Research Institute, SPring-8, Sayo, Hyogo 679-5198, Japan
6
Graduate School of Science and Engineering, Saitama University, Saitama 338-8570, Japan
We determine the crystal structure of the intermediate antiferroelectric (A
2) phase of PbHfO
3by a Rietveld method using X-ray and neutron di ff raction. The structure can be described by modulations associated with the lattice vibrational mode Σ
3(TO) with q = (0.15, 0.15, 0) and the R
25xymode, although the latter modulation is relatively distorted. The size of the orthorhombic unit cell is √
2 × 10 √
2 × 2 times as large as that of the high-temperature cubic cell. The space group is Pbam-D
92h(No. 55), and is the same as that of the room-temperature antiferroelectric (A
1) phase of PbHfO
3.
1. Introduction
Many ABO
3perovskite oxides undergo phase transitions from the paraelectric (PE) state to the ferroelectric (FE), antiferroelectric (AFE), and other PE states on cooling. These tran- sitions occur owing to the small energy di ff erences among these states. Perovskite PbZrO
3was the first AFE material to be discovered.
1–3)A D-E double-hysteresis loop is observed in the AFE phase, in contrast to the observation of the double-hysteresis loop in the PE phase of BaTiO
3. This is one of the pieces of direct evidence of the AFE property of PbZrO
3. The
∗fujishit@staff.kanazawa-u.ac.jp
double-hysteresis loop of PbZrO
3is observed owing to the forced transition from the AFE state to the FE state. The small energy di ff erence between these states is overcome by the application of an external electric field. Applications of perovskite oxides in technology are possible owing to the small energy di ff erences. The AFE perovskites have attracted much attention because of their applications in technology such as actuators, transducers, and FE random access memories, for example.
4)Another piece of direct evidence of the AFE property of PbZrO
3is the antiparallel shifts of Pb atoms in the [110] direction of the high-temperature cubic perovskite cell.
5)These shifts cause a superstructure with the unit cell of 4a
p× 4a
p× c
p, where a
pand c
pare the lattice parameters of the pseudotetragonal perovskite sublattice. Cochran and Zia first pointed out that the structural modulation with the antiparallel shifts of Pb atoms is the modulation associated with the lattice vibrational mode Σ
3(TO) with the wave vector q = (1 / 4, 1 / 4, 0).
6)We showed that structural modulations in the AFE phase are those associated with the lattice vibrational modes Σ
3(TO) and R
xy25,
7)although the latter modulation is relatively distorted.
8, 9)The latter modulation causes a superstructure with the unit cell of 2a
p× 2a
p× 2c
p. Then, the superstructure of the AFE PbZrO
3has the unit cell of 4a
p× 4a
p× 2c
p. The size of its crystallographically standard unit cell is √
2a
p× 2 √
2a
p× 2c
p.
Perovskite PbHfO
3undergoes two AFE phase transitions.
10, 11)The room-temperature AFE phase (A
1) of PbHfO
3is isostructural with that of PbZrO
3.
12)We showed that structural modulations in the A
1phase are those associated with the lattice vibrational modes Σ
3(TO) with the wave vector q = (1 / 4, 1 / 4, 0) and R
25xy, although the modulation associated with the R
25xymode is relatively distorted.
13)PbHfO
3has an intermediate AFE phase (A
2).
10, 11)We have reported that AFE superlat-
tice reflections with q = (1 / 4, 1 / 4, 0) disappear at 435 K, and reflections associated with
a large cell volume appear between 435 and 480 K by heating in powder X-ray di ff raction
experiments of PbHfO
3.
14)The reflections associated with R
25xyremain in the A
2phase. We
suggested that the superstructure has a size of 5a
p× 5a
p× 8c
p. Recently, the symmetry of
the A
2phase has been determined to be orthorhombic by X-ray di ff raction and birefringence
measurements.
15)We can determine the crystal structure of the A
2phase of PbHfO
3by syn-
chrotron radiation and neutron di ff raction experiments in this work. The details of the study
are reported herein. The unit cell size of the superstructure is revised on the basis of our re-
sults.
2. Experimental details
2.1 Synthesis
Ceramic samples were obtained by a solid-state reaction of PbO and HfO
2. The purity of PbO was 99.999% (Rare Metallic), and that of HfO
2was 99.95% (Rare Metallic). A mixture of PbO and HfO
2was successively fired at 600, 800, and 1000
◦C, and subsequently at 1150
◦
C for 10 h with intermediate grinding.
2.2 X-ray di ff raction data collection
An X-ray di ff raction pattern was collected at 460 K using synchrotron radiation. The ex- periment was performed using a large Debye-Scherrer camera with a radius of 286.5 mm installed at the BL02B2 beam line in SPring-8.
16)It uses an imaging-plate system as a de- tector. The intensity data were collected at steps of 0.01
◦(2 θ ) from the imaging plate. The wavelength of the incident beam was 0.5 Å. The powder sample was sealed into a quartz capillary of 0.1 mm internal diameter and 0.01 mm thickness. The absence of the preferred orientation e ff ect was ascertained by the uniform intensity along each Debye ring. The sample was heated by a hot air flow. The temperature was controlled to within 1 K.
2.3 Neutron di ff raction data collection
A powder neutron di ff raction pattern was obtained at 460 K using a high-resolution pow- der di ff ractometer (HRPD) installed at JRR-3M in JAERI. This di ff ractometer consists of 64 detectors, and the angle between the detectors is 2.5
◦. The incident neutron wavelength was 1.8232 Å. The collimation was 40’-20’-6’. The powder specimen obtained by grinding the ceramic samples was placed in an electric furnace. The temperature was controlled to within 1 K. A vanadium sample cell of 10 mm diameter was used to avoid di ff raction peaks from the cell. The intensity data were collected by scanning using a counter system with 0.05
◦steps (2 θ ) over an angle of 2.5
◦.
2.4 Analysis
The obtained di ff raction patterns were analyzed by the Rietveld method using the com- puter program RIETAN-FP.
17)The background level was fitted using a polynomial expression throughout the analysis. A pseudo-Voigt function was applied to the profile of the di ff raction peaks. A conjugate direction method was employed in the least-squares refinements.
We analyzed the obtained X-ray di ff raction pattern between 2 θ = 5.8
◦and 75.3
◦. A rela-
tively strong background peak exists at 7
◦, which is caused by the quartz capillary. The peak
was di ffi cult to express using the polynomial background function. Subsequently, the back-
ground level where no di ff raction peaks appear below 9
◦was replaced by the calculated back- ground. The replaced areas were excluded in the refinement calculations. The background level below 11
◦where peaks appear was drawn to connect the replaced areas smoothly by linear functions.
The sample contained heavy Pb atoms and Hf atoms. Subsequently, the absorption was corrected in the analysis of the X-ray di ff raction pattern. We used 0.6 for the value of µ r because of the reason stated previously for the same sample.
18)The absorption was also cor- rected in the analysis of the neutron di ff raction pattern, because the absorption of neutrons by Hf atoms is large (102 × 10
−24cm
2for neutrons with a wavelength of 1.8 Å). A packing ratio of 0.41 was used for the correction. This value was calculated using the weight and volume of our sample. The volume was measured using a graduated cylinder.
3. Results
A low-angle part of the X-ray di ff raction pattern in the intermediate AFE phase (A
2) of PbHfO
3measured at 460 K is delineated by a red line in the upper portion of Fig. 1. The X-ray di ff raction pattern in the A
1phase of PbHfO
3at 400 K is drawn by a blue line in the lower portion for comparison; we reported this pattern previously.
18)All the di ff raction peaks could be successfully indexed as shown in the figure, where the indices are based on a pseudotetragonal perovskite cell; q
I= 0.15 and q
A= 0.25. Furthermore, R
25indicates the peak caused by a structural modulation associated with the R
25lattice vibrational mode.
Fig. 1. (Color online) Low-angle X-ray diffraction patterns of PbHfO3measured at 460 K (A2phase; red line in the upper portion) and 400 K (A1 phase; blue line in the lower portion). The X-ray wavelength is 0.5 Å.
Indices are assigned on the basis of a pseudotetragonal perovskite cell, where qI =0.15 andqA=0.25. R25
is a reflection caused by a structural modulation associated with the lattice vibrational mode R25. Indices of unobserved reflections are also shown. An impurity peak is indicated by “x”.
Fig. 2. (Color online) Enlarged X-ray diffraction pattern around (110) reflection of PbHfO3at 460 K to show the appearance of superlattice reflection (1±qI, 1∓qI, 0), whereqI=0.15.
Superlattice reflections with the indices (1 ± q
I, 1 ± q
I, 0) disappear around the strongest fundamental (110) reflection, where the compounds are in the same order. However, reflec- tions with (1 ± q
I, 1 ∓ q
I, 0) appear, although they are close to the fundamental reflection and we can only confirm their existence as a “shoulder” at the hem of the fundamental reflection, as shown in Fig. 2. These facts indicate that the structural modulation has a character of a transverse mode with the wave vector q = (0.15, 0.15, 0) polarized in the (001) plane. The superlattice-reflection intensities around the very weak (100) reflection have the same order as those around (110): they have no simple relation with the intensity of the fundamental reflection. This fact indicates that the modulation has a character of an optical mode. Typi- cally, a lattice vibrational Σ
3(TO) branch traveling in the [110] direction is the lowest-energy branch in optical branches along [110] in perovskite compounds. In fact, the modulation in the A
1phase of PbHfO
3is associated with the Σ
3(TO) mode with q = (1 / 4, 1 / 4, 0). The modulation associated with the Σ
3(TO) mode with q = (0.15, 0.15, 0) causes a superstructure with the unit cell size of 20a
p× 20a
p× c
p, where a
pand c
pare the lattice parameters of the pseudotetragonal perovskite sublattice.
Superlattice reflections with indices (h ± 1 / 2, k ± 1 / 2, l ± 1 / 2) are caused by the modula- tion associated with the R
25xymode, where h, k, and l are integers. This modulation consists of those associated with the R
25xand R
y25modes: the former is antidirectional rotations of oxygen octahedra around [100] in the adjacent perovskite cell, while the latter is those around [010].
Both the amplitudes are equal and defined as A
R. The modulations cause the superstructure with the unit cell of 2a
p× 2a
p× 2c
p. Then, the superstructure of the A
2phase has the unit cell of 20a
p× 20a
p× 2c
p. Its crystallographically standard orthorhombic unit cell has a size of √
2a
p× 10 √
2a
p× 2c
p. There are three wavelengths of the Σ
3(TO)-type modulation in the length of 10 √
2a
palong [110] in the perovskite cell.
Referring to Cowley’s table,
19)the atomic displacements in the A
2phase of PbHfO
3asso-
ciated with the Σ
3(TO) with q = (0.15, 0.15, 0) and R
25xymodes can be concluded, as schemat- ically shown in Fig. 3, if we ignore the distortions in the modulations. The space group is Pbam-D
92h(No. 55), which is the same as that of the A
1phase. The atomic positions associ- ated with these modes are summarized in Appendix. In Cowley’s table, oxygen atoms of the cubic perovskite structure are labeled as OI, OII, and OIII, and their positions are (1 / 2, 1 / 2, 0), (1 / 2, 0, 1 / 2), and (0, 1 / 2, 1 / 2), respectively. Moreover, the positions of Pb and Hf atoms are (0, 0, 0) and (1 / 2, 1 / 2, 1 / 2), respectively.
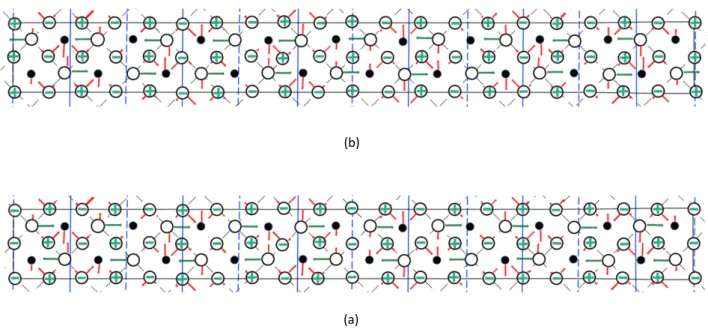
(a) (b)
Fig. 3. (Color online) Schematic projections of undistorted atomic displacements associated with modes with Σ3(TO) withq=(0.15, 0.15, 0) and R25xyonto the ab plane of PbHfO3in the intermediate (A2) phase. The solid circles and open circles indicate Pb atoms and oxygen atoms, respectively. (a) shows the atoms in the planes z=0 andz=cp/2, while (b) shows the atoms in the planesz=cpandz=3cp/2, wherecpis the pseudotetrago- nal lattice parameter of the perovskite sublattice in thez-direction. The perovskite sublattices in the ab plane are delineated by dashed black lines. The solid black lines delineate the orthorhombic cell. The dashed and solid blue lines indicate the nodes and antinodes of modulation with q, respectively. The arrows and+or - signs denote the directions of the displacement of atoms from the cubic perovskite sites. The red arrows and green arrows or signs denote the directions associated withΣ3(TO) and R25xy, respectively. The lengths of arrows are drawn on the basis of the amplitudes of modulations obtained by the analysis of X-ray and neutron diffraction patterns, but are exaggerated. Hf atoms are omitted on the basis of the analysis.
The X-ray and neutron di ff raction patterns in the A
2phase were analyzed by the Rietveld
method on the basis of this structure model. Selected structural parameters of Pb and Hf
atoms were refined by the X-ray di ff raction pattern. Other parameters were subordinated to
Fig. 4. (Color online) X-ray Rietveld refinement pattern of PbHfO3at 460 K (A2phase). Only the low-angle and small-intensity part of the pattern is displayed. The X-ray wavelength is 0.5 Å. The calculated pattern is denoted by the blue line passing through the red data points in the upper portion. The calculated background level is indicated by the black line. The difference between the observed and calculated patterns is shown by the blue line in the lower portion. The short green bars indicate the positions of possible reflections. The refinement was performed using six selected fractional coordinates of atoms and three thermal parameters for three elements (see text).
these parameters. Subsequently, selected structural parameters of oxygen atoms were refined by the neutron di ff raction pattern. This procedure was repeated several times until converged results were obtained. The R-factors R
wpwere 3.05 and 6.81% for the X-ray and neutron di ff raction, respectively. The result of profile fitting to the observed X-ray di ff raction pattern is shown in Fig. 4, where only the small-intensity part at the low angle is indicated to show the fitting to superlattice reflections well. The obtained parameters were x(Pb1) = 0.7671(1), B
Pb= 2.84 (2) Å
2, x(Hf1) = 0.2521(1), B
Hf= 0.56 (1) Å
2, x(O1) = 0.2358(7), y(O1) = 0.02948(3), x(O8) = -0.0204(9), y(O8) = 0.04877(8), B
O= 1.73 (5) Å
2, where the same values of thermal parameters were assumed for atoms of the same element. These coordinates mean that the amplitudes of the modulations in Appendix are A
Pb= 0.220 (2) Å, A
Hf= 0.027 (2) Å, A
OI= - 0.186 (9) Å, A
OII= 0.042 (10) Å, A
OIII= 0.168(10) Å, and A
R= 0.185 (3) Å. The value of A
Rcorresponds to the 7.3 (2)
◦rotation of the oxygen octahedra around [110].
Finally, we refined all crystallographically independent parameters. The positions of the
Pb and Hf atoms were refined by the X-ray di ff raction pattern, and the oxygen positions were
refined by the neutron di ff raction pattern. This procedure was repeated several times until
converged results were obtained. The R-factors R
wpwere 2.97 and 5.92% for the X-ray and
neutron di ff raction, respectively. The result of profile fitting to the X-ray di ff raction pattern
is shown in Fig. 5. The orthorhombic lattice parameters are a = 5.850(3) Å, b = 58.50(3) Å,
and c = 8.235(3) Å. The result of profile fitting to the neutron di ff raction pattern is shown in
Fig. 6. The obtained structural parameters are listed in Table I.
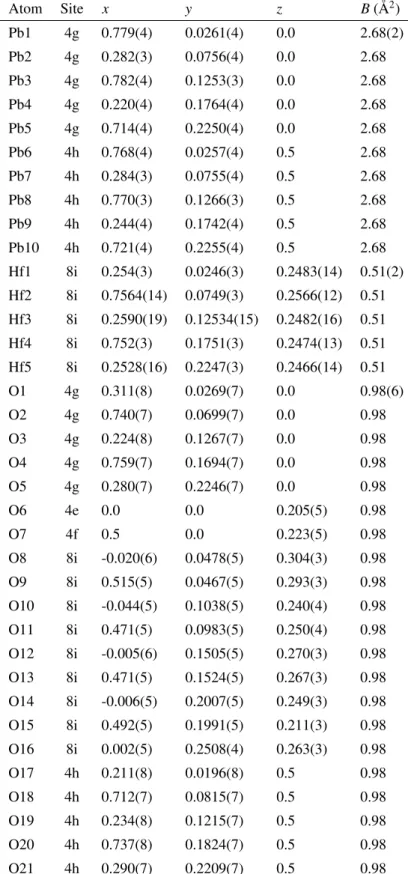
Table I. Structural parameters (fractional coordinates and thermal parameters) of PbHfO3obtained by X-ray and neutron diffraction in intermediate antiferroelectric (A2) phase. The space group Pbam-D92h (No. 55) was used. Isotropic thermal parameters were used for all atoms. The numbers in parentheses indicate the estimated standard deviations. The lattice parameters area=5.850(3) Å,b=58.50(3) Å, andc=8.235(3) Å.
Atom Site x y z B(Å2)
Pb1 4g 0.779(4) 0.0261(4) 0.0 2.68(2)
Pb2 4g 0.282(3) 0.0756(4) 0.0 2.68
Pb3 4g 0.782(4) 0.1253(3) 0.0 2.68
Pb4 4g 0.220(4) 0.1764(4) 0.0 2.68
Pb5 4g 0.714(4) 0.2250(4) 0.0 2.68
Pb6 4h 0.768(4) 0.0257(4) 0.5 2.68
Pb7 4h 0.284(3) 0.0755(4) 0.5 2.68
Pb8 4h 0.770(3) 0.1266(3) 0.5 2.68
Pb9 4h 0.244(4) 0.1742(4) 0.5 2.68
Pb10 4h 0.721(4) 0.2255(4) 0.5 2.68
Hf1 8i 0.254(3) 0.0246(3) 0.2483(14) 0.51(2) Hf2 8i 0.7564(14) 0.0749(3) 0.2566(12) 0.51 Hf3 8i 0.2590(19) 0.12534(15) 0.2482(16) 0.51 Hf4 8i 0.752(3) 0.1751(3) 0.2474(13) 0.51 Hf5 8i 0.2528(16) 0.2247(3) 0.2466(14) 0.51
O1 4g 0.311(8) 0.0269(7) 0.0 0.98(6)
O2 4g 0.740(7) 0.0699(7) 0.0 0.98
O3 4g 0.224(8) 0.1267(7) 0.0 0.98
O4 4g 0.759(7) 0.1694(7) 0.0 0.98
O5 4g 0.280(7) 0.2246(7) 0.0 0.98
O6 4e 0.0 0.0 0.205(5) 0.98
O7 4f 0.5 0.0 0.223(5) 0.98
O8 8i -0.020(6) 0.0478(5) 0.304(3) 0.98
O9 8i 0.515(5) 0.0467(5) 0.293(3) 0.98
O10 8i -0.044(5) 0.1038(5) 0.240(4) 0.98 O11 8i 0.471(5) 0.0983(5) 0.250(4) 0.98 O12 8i -0.005(6) 0.1505(5) 0.270(3) 0.98 O13 8i 0.471(5) 0.1524(5) 0.267(3) 0.98 O14 8i -0.006(5) 0.2007(5) 0.249(3) 0.98 O15 8i 0.492(5) 0.1991(5) 0.211(3) 0.98 O16 8i 0.002(5) 0.2508(4) 0.263(3) 0.98
O17 4h 0.211(8) 0.0196(8) 0.5 0.98
O18 4h 0.712(7) 0.0815(7) 0.5 0.98
O19 4h 0.234(8) 0.1215(7) 0.5 0.98
O20 4h 0.737(8) 0.1824(7) 0.5 0.98
O21 4h 0.290(7) 0.2209(7) 0.5 0.98
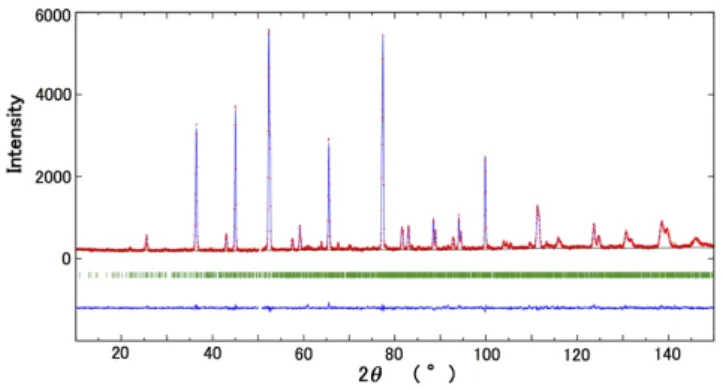
Fig. 5. (Color online) X-ray Rietveld refinement pattern of PbHfO3at 460 K (A2phase) obtained using all possible parameters for Pb and Hf atoms. The X-ray wavelength is 0.5 Å. Only the positions of 15000 possible reflections with 2θ <66◦are indicated by short green bars.
Fig. 6. (Color online) Neutron Rietveld refinement pattern of PbHfO3at 460 K (A2phase) obtained using all possible parameters for oxygen atoms. The neutron wavelength is 1.8232 Å.
4. Discussion
The X-ray and neutron powder di ff raction patterns of PbHfO
3in the A
2phase could be fitted well by the structural modulations associated with the lattice vibrational mode Σ
3(TO) with q = (0.15, 0.15, 0) and the R
25xymode. The fitting to the X-ray di ff raction pattern was not improved significantly using all the crystallographically independent parameters for Pb and Hf atoms. This result indicates that structural modulations for Pb and Hf atoms associated with the Σ
3(TO) mode are not distorted significantly. In fact, no meaningful displacements of Hf atoms could be detected from the pseudotetragonal perovskite positions. No meaningful displacements of Pb atoms could be detected along the b-direction as well. In addition, no meaningful di ff erences could be detected between the displacements along the a-direction for Pb atoms with z = 0 and 0.5, although the errors are relatively large.
The fitting to the neutron di ff raction pattern was improved using all the crystallographi-
cally independent parameters for the oxygen atoms. This result indicates that the structural
modulation associated with the R
xy25mode is relatively distorted. In fact, meaningful distor- tions of oxygen displacements are observed along the c-direction.
Two independent lattice vibrational modes, Σ
3(TO) with q = (0.15, 0.15, 0) and R
25xy, cause the PE to AFE A
2phase transition. The successive transition to the AFE A
1phase is caused by the lattice vibrational mode Σ
3(TO) with q = (1 / 4, 1 / 4, 0), which has the same symmetry as the Σ
3(TO) mode with q = (0.15, 0.15, 0), thus extricating the modulation associated with the Σ
3(TO) mode with q = (0.15, 0.15, 0). Such mechanisms are expected to create first-order transitions. In fact, the dielectric constant
10, 11)and specific heat
20)measurements have shown the first-order nature of the successive phase transitions.
The dielectric constant of PbHfO
3becomes large at the PE to A
2phase transition in the PE phase. This means that the FE Γ
15mode becomes soft, which is the Σ
3(TO) mode with q
= 0. Subsequently, the energy of the Σ
3(TO) branch along [110] is expected to be low from q
= 0 to (1 / 4, 1 / 4, 0) in the PE phase. The detection of this softening is desirable.
5. Conclusions
The crystal structure of the intermediate AFE (A
2) phase of PbHfO
3was analyzed by X-ray and neutron powder di ff raction experiments. The structure could be described by the structural modulations associated with the lattice vibrational mode Σ
3(TO) with q = (0.15, 0.15, 0) and the R
xy25mode. The size of the orthorhombic unit cell was √
2 × 10 √
2 × 2 times as large as that of the high-temperature cubic cell. The space group was Pbam-D
92h(No. 55), and was the same as that of the room-temperature AFE (A
1) phase.
Acknowledgments
The synchrotron radiation experiments were performed at BL02B2 in SPring-8 with the approval of the Japan Synchrotron Radiation Research Institute (JASRI) (Proposal No.
2001A0192-ND-np).
References
1) E. Sawaguchi, G. Shirane, and Y. Takagi, J. Phys. Soc. Jpn. 6, 333 (1951).
2) G. Shirane, E. Sawaguchi, and Y. Takagi, Phys. Rev. 84, 476 (1951).
3) E. Sawaguchi and T. Kittaka, J. Phys. Soc. Jpn. 7, 336 (1952).
4) J. F. Scott, Science 315, 954 (2007).
5) E. Sawaguchi, H. Maniwa, and S. Hoshino, Phys. Rev. 83, 1078 (1951).
6) W. Cochran and A. Zia, Phys. Status Solidi 25, 273 (1968).
7) H. Fujishita and S. Hoshino, J. Phys. Soc. Jpn. 53, 226 (1984).
8) H. Fujishita and S. Katano, J. Phys. Soc. Jpn. 66, 3484 (1997).
9) H. Fujishita, Y. Ishikawa, S. Tanaka, A. Ogawaguchi, and S. Katano, J. Phys. Soc. Jpn.
72, 1426 (2003).
10) G. Shirane and R. Pepinsky, Phys. Rev. 91, 812 (1953).
11) G. A. Samara, Phys. Rev. B 1, 3777 (1970).
12) D. L. Corker, A. M. Glazer, W. Kaminsky, R. W. Whatmore, J. Dec, and K. Roleder, Acta Crystallogr., Sect. B 54, 18 (1998).
13) H. Fujishita, A. Ogawaguchi, and S. Katano, J. Phys. Soc. Jpn. 77, 064601 (2008).
14) H. Fujishita and Y. Ishikawa, Ferroelectrics 269, 135 (2002).
15) S. Huband, A. M. Glazer, K. Roleder, A. Majchrowski, and P. A. Thomas, J. Appl. Crys- tallogr. 50, 378 (2017).
16) E. Nishibori, M. Takata, K. Kato, M. Sakata, Y. Kubota, S. Aoyagi, Y. Kuroiwa, M.
Yamakata, and N. Ikeda, Nucl. Instrum. Methods Phys. Res., Sect. A 467-468, 1045 (2001).
17) F. Izumi and K. Momma, Solid State Phenom. 130, 15 (2007).
18) H. Fujishita, Y. Ishikawa, A. Ogawaguchi, K. Kato, E. Nishibori, M. Takata, and M.
Sakata, J. Phys. Soc. Jpn. 74, 2743 (2005).
19) R. A. Cowley, Phys. Rev. 134, A981 (1964).
20) M. Maczka, T. H. Kim, A. Gagor, I. Jankowska-Sumara, A. Majchrowski, and S. Kojima,
J. Alloys Compd. 622, 935 (2015).
Appendix: Numbers of equivalent positions, Wyckoffnotations, and fractional coordinates of atoms
The number of equivalent positions and Wyckoffnotation of each atom are written in parentheses immediately after the name of the atom. The fractional coordinates (x, y, z) of the atom from the undistorted structural modulations associated with the Σ3(TO) mode withq=(0.15, 0.15, 0) and Rxy25are written in the next parentheses. The space group is Pbam-D92h(No. 55).ap
andcpare lattice parameters of the pseudotetragonal perovskite sublattice.APb,AHf,AOI,AOII, andAOIIIare the amplitudes of the structural modulations associated with theΣ3(TO) mode.ARis the amplitude of the oxygen atoms associated with Rx25and Ry25.
Pbn(n=1 – 5) (4g) (0.25×(2n+1)+APbsin(6π×0.025×(2n−1))/√
2ap,0.025×(2n−1),0.0) Pbn(n=6 – 10) (4h) (0.25×(2n−9)+APbsin(6π×0.025×(2n−11))/√
2ap,0.025×(2n−11),0.5) Hfn(n=1 – 5) (8i) (0.25×(2n−1)+AHfsin(6π×0.025×(2n−1))/√
2ap,0.025×(2n−1),0.25) On(n=1 – 5) (4g) (0.25×(2n−1)+AOIsin(6π×0.025×(2n−1))/√
2ap,0.025×(2n−1)+(−1)n+1×AR/10ap,0.0) On(n=6, 7) (4e/4f) (0.0,0.5×(n−6),0.25−AR/2cp)
On(n=8,12,16) (8i) (0.5×(n−6)−(AOII+AOIII)sin(6π×0.025×(n−6))/2ap,
0.025×(n−6)+(AOII−AOIII)sin(6π×0.025×(n−6))/20ap,0.25+AR/2cp) On(n=9,13) (8i) (0.5×(n−6)−(AOII+AOIII)sin(6π×0.025×(n−6))/2ap,
0.025×(n−7)−(AOII−AOIII)sin(6π×0.025×(n−7))/20ap,0.25+AR/2cp) On(n=10,14) (8i) (0.5×(n−6)−(AOII+AOIII)sin(6π×0.025×(n−6))/2ap,
0.025×(n−6)−(AOII−AOIII)sin(6π×0.025×(n−6))/20ap,0.25−AR/2cp) On(n=11,15) (8i) (0.5×(n−6)−(AOII+AOIII)sin(6π×0.025×(n−7))/2ap,
0.025×(n−7)+(AOII−AOIII)sin(6π×0.025×(n−7))/20ap,0.25−AR/2cp) On(n=17 – 21) (4h) (0.25×(2n−33)+AOIsin(6π×0.025×(2n−33))/√
2ap,0.025×(2n−33)+(−1)n−16×AR/10ap,0.5)