Procedia Engineering 191 ( 2017 ) 886 – 893
1877-7058 © 2017 The Authors. Published by Elsevier Ltd. This is an open access article under the CC BY-NC-ND license (http://creativecommons.org/licenses/by-nc-nd/4.0/).
Peer-review under responsibility of the organizing committee of EUROCK 2017 doi: 10.1016/j.proeng.2017.05.258
ScienceDirect
Symposium of the International Society for Rock Mechanics
Estimation of Mode I Fracture Toughness of Rock by Semi-Circular Bend Test under Confining Pressure Condition
Minami Kataoka
a*, Eqlima Mahdavi
b, Takahiro Funatsu
c, Takashi Takehara
d, Yuzo Obara
e, Katsunori Fukui
a, Kimihiro Hashiba
aaThe University of Tokyo, 7-3-1 Hongo Bunkyo-ku, Tokyo 113-8654, Japan
bIran University of Science and Technology, Narmak, Tehran 16846-13114, Iran
cCurtin University, Locked Bag 30, Kalgoorlie WA 6433, Australia
dNational Institute of Advanced Industrial Science and Technology, 1-1-1 Higashi, Tsukuba 305-8567, Japan
eKumamoto University, 2-39-1 Kurokami Chuo-ku, Kumamoto 860-8555, Japan
Abstract
It is essential to understand the mode I fracture toughness of rock under in situ conditions found underground, such as confining pressure, for assessment of the stability of underground rock structures. Some researchers have performed several types of fracture toughness tests of rocks under confining pressure condition. However, the ordinary fracture toughness tests do not consider the effect of confining pressure in their estimation equations. A modified estimation equation for the mode I fracture toughness of rock under confining pressure condition was suggested in this study. This study was intended for the semi-circular bend (SCB) test, which is one of the ISRM-suggested methods for determining the mode I fracture toughness of rock. The SCB test under various confining pressures from 0 to 10 MPa was performed using Kimachi sandstone. A finite element analysis of the SCB test considering several confining pressure conditions was performed to calculate the stress intensity factor. Based on the numerical simulation results, the modification of the fracture toughness estimation was suggested. Applicability of the suggested estimation was discussed with comparing the mode I fracture toughness of the rock obtained in this study and previous research.
© 2017 The Authors. Published by Elsevier Ltd.
Peer-review under responsibility of the organizing committee of EUROCK 2017.
Keywords: Mode I fracture toughness; Confining pressure; Semi-circular bend test; Kimachi sandstone
* Corresponding author. Tel.: +81-3-5841-7067; fax: +81-3-5841-7067.
E-mail address: [email protected]
© 2017 The Authors. Published by Elsevier Ltd. This is an open access article under the CC BY-NC-ND license (http://creativecommons.org/licenses/by-nc-nd/4.0/).
Peer-review under responsibility of the organizing committee of EUROCK 2017
1. Introduction
Fracture toughness Kc is one of the most important mechanical properties in fracture mechanics. It is considered to be the critical value of stress intensity factor K and indicates the resistance to fracture initiation. In rock engineering, Kc has been applied as a parameter for classification of rock materials, and interpretation and modeling of rock fracturing [1, 2]. It is essential to understand KIc of rocks under in situ conditions found underground, such as water content, temperature and confining pressure, for its application. Mode I (opening mode) is the most important mode of fracture initiation because it is the predominant loading condition over the fracture of rocks [1].
Many researchers have been conducting the fracture toughness tests under confining pressure [3–6]. It was found that Kc tends to increase with increasing confining pressure. However, some results show that Kc is not changed under several confining pressure values. In the experiments under confining pressure, the specimen is immersed in an incompressible fluid such as oil, and the fluid pressure is often used as confining pressure. The specimen requires jacketing to prevent contamination by the oil. The specimen in fracture toughness tests has a notch, and the previous results may show the different trends due to the different conditions of the pressure inside the notch as well as pore pressure. It also should be pointed out that the general fracture toughness tests [7–9] have not been theorized for the mechanical condition of the specimen under confining pressure. Some researchers have attempted modifications considering the effect of pressure inside the notch [4, 6]. Numerical simulation may support the estimation of the fracture toughness of rocks under confining pressure.
In this study, in order to understand the influence of confining pressure on the mode I fracture toughness of rocks, the fracture toughness test under various confining pressures from 0 to 10 MPa was conducted using Kimachi sandstone. The semi-circular bend (SCB) test [9], which is one of the ISRM-suggested methods for determining the mode I fracture toughness of rocks, was used. Numerical simulations of the SCB test considering several confining pressure conditions were performed. The experimental evaluation method for the mode I fracture toughness under confining pressure was discussed based on the numerical simulation results.
2. Semi-circular bend test
The geometry of the SCB specimen is shown in Fig. 1 (a). During the test, a three-point loading is applied to the specimen. The mode I fracture toughness KIc is evaluated using the following equations [9]:
Nomenclature
a notch length of SCB specimen K stress intensity factor
Kc fracture toughness KIc mode I fracture toughness
KIc* apparent mode I fracture toughness KIf stress intensity factor at P = Pmax
KI0 stress intensity factor at P = 0 P load applied to SCB specimen Pf fracture initiation load Pmax maximum load
r radius of SCB specimen
s half of support span of SCB specimen t thickness of SCB specimen
YI normalized stress intensity factor σcp confining pressure
σcpo outer confining pressure σcpi inner confining pressure
max I
Ic 2
π P tr Y a
K (1)
where a, r and t are the notch length, radius and thickness of the specimen, respectively, and Pmax is a maximum load. The normalized stress intensity factor YI is a dimensionless function decided by specimen shape and its dimension. In case of the SCB specimen, YI is shown as a function of the ratios of a half of the support span to radius s/r and normalized notch length a/r [9].
The confining pressure was not considered in this estimation equation. In this paper, the fracture toughness under confining pressure estimated by Equation (1) is described as apparent fracture toughness KIc*.
3. Experiment under confining pressure 3.1. Specimen
Kimachi sandstone was used as a test material. The average grain diameter is 0.4–0.6 mm [10] and the porosity is approximately 20 % [11]. The other material properties are listed in Table 1. The geometrical dimensions of the SCB specimens are shown in Fig. 1 (a). In the specimen preparation process, firstly, a rock core was drilled from a rock block. Then, the core was cut into disks and each disk was cut into halves to form two semi-circular specimens. Finally, a straight edge notch was produced using a diamond blade with a thickness of 0.4 mm.
The direction of the notch was normal to the sedimentation. The length of the notch is given by a/r = 0.5. After the preparation, the specimens were kept in an electric drying oven at 60o C for more than 30 days.
Fig. 1. SCB specimen; (a) the geometrical dimensions of the specimen and loading configuration, and (b) and (c) the picture of Specimen (O) and Specimen (I) (defined in Section 3.1), respectively.
Table 1. Material properties of Kimachi sandstone.
Material property Value
Uniaxial compressive strength 59.3 MPa
Young’s modulus 7.7 GPa
Poisson’s ratio 0.22
Tensile strength 6.17 MPa
Elastic wave velocity 2.6–2.9 km/sec b
c
2s= 60 mm
a= 18.75 mm r= 37.5 mm
t= 25 mm
a LoadingP
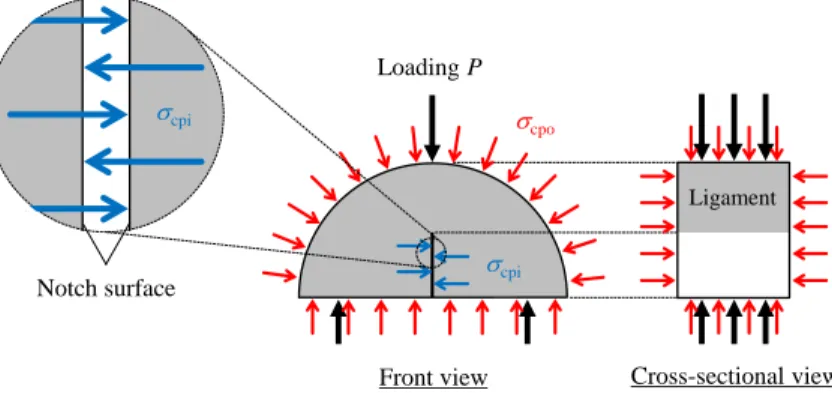
Fig. 2. Schematic of pressure applied to the SCB specimen.
The specimen was immersed in an oil vessel and subjected to the confining pressures during the test.
The specimens were covered with silicone to prevent contamination of the oil. As shown in Fig. 2, the pressure applied to the notch surfaces is defined as an inner confining pressure σcpi, while that not to the notch surfaces is an outer confining pressure σcpo in this paper. σcpo is the hydraulic pressure of the oil vessel. In Specimen (O) shown in Fig. 1 (b), the notch was sealed by a copper sheet before the silicone covering. As a result, the silicone did not flow into the notch and the pressure was not applied to the notch surface, namely σcpi = 0. On the other hand, the silicone flowed into the notch in Specimen (I) as shown in Fig. 1 (c). A portion of the fluid pressure might have been applied on the notch surfaces through the silicone, namely σcpi > 0. However, this pressure value could not be measured directly. Moreover, it was found that the silicone layer did not affect KIc value; several SCB tests under atmospheric pressure conditions were performed using specimens with and without silicone coating and there were few differences in KIc values between them.
3.2. Experimental system and method
The tests were performed using a special testing system [6]. This testing machine facilitates loading a specimen in a three-point bending test while it is immersed in an oil vessel. The oil vessel can be raised to a hydraulic pressure of up to 30 MPa. The test was performed at room temperature, though the oil vessel can be heated up to 200o C.
The specimen was placed on the loading apparatus and loaded vertically through one upper and two support rollers.
The support span 2s used is shown in Fig. 1 (a). YI was calculated as 6.67 in this study (a/r = 0.5 and s/r = 0.8) [9].
Moreover, one set of knife-edges were mounted at the notch mouth for attachment of a clip-type displacement gauge to measure a crack opening displacement (COD).
During the test, the loading apparatus with the specimen was immersed in the oil vessel and subjected to confining pressure. Before the test, the hydraulic pressure inside the oil vessel was raised stepwise by 2 MPa to the desired confining pressure. The SCB tests under atmospheric pressure conditions were also performed as a test under a confining pressure of 0 MPa. The specimen was loaded under displacement control using a loading rate of 0.01 mm/min. The displacement was measured by a differential displacement transducer. The load applied to the specimen was measured using a load cell installed on the system.
Loading P
Ligament Vcpo
Vcpi
Cross-sectional view Front view
Vcpi
Notch surface
3.3. Results
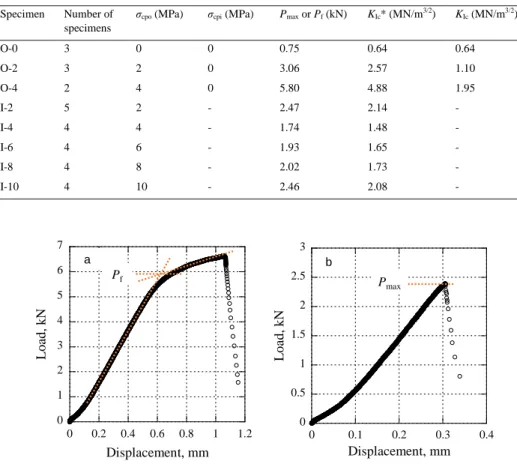
The test results are summarized in Table 2. In the test using Specimen (O), σcpi was zero and σcpo (fluid pressure) was set to 0, 2, and 4 MPa. The test under the condition of σcpo higher than 4 MPa could not be performed because some σcpo of 4 MPa and 6 MPa tore the silicone layer and the oil flooded into the notch before the specimen fractured. In the test using Specimen (I), σcpo was set to six conditions: 0, 2, 4, 6, 8, and 10 MPa. σcpi could not be measured in this case. Fig. 3 shows typical load-displacement curves. The curve of Specimen (I) in Fig. 3 (b) is almost linear until a specimen fractured at the maximum load Pmax. This value was used to estimate the apparent fracture toughness KIc* using Equation (1). On the other hand, as shown in Fig. 3 (a), there is a yield point at some load level in the curves in Specimen (O), and then the deformation behavior changes to ductility. This ductile behavior may be induced by confining pressure, and Pmax does not indicate the load condition of fracture initiation in this case. Therefore, as shown in Fig. 3 (a), tangents for two linear parts were drawn and the load at the intersection of the lines was assumed as the fracture initiation load Pf. This value was used to estimate KIc* in the case of Specimen (O), as Pmax in Equation (1).
As shown in Table 2, average KIc* tends to increase with increasing σcpo. However, the value of Specimen (O) is higher than that of Specimen (I). In Specimen (I), KIc* at σcpo of 2 MPa is higher than the others. In order to interpret the fracture toughness under confining pressure, numerical simulations for the SCB test considering several confining pressure conditions were performed.
Table 2. Results of experimental SCB test. Pmax or Pf, KIc* and KIc are the average value of each specimen.
Specimen Number of specimens
σcpo (MPa) σcpi (MPa) Pmax or Pf (kN) KIc* (MN/m3/2) KIc (MN/m3/2)
O-0 3 0 0 0.75 0.64 0.64
O-2 3 2 0 3.06 2.57 1.10
O-4 2 4 0 5.80 4.88 1.95
I-2 5 2 - 2.47 2.14 -
I-4 4 4 - 1.74 1.48 -
I-6 4 6 - 1.93 1.65 -
I-8 4 8 - 2.02 1.73 -
I-10 4 10 - 2.46 2.08 -
Fig. 3. Load-displacement curves; (a) Specimen (O-4), and (b) Specimen (I-2).
0 1 2 3 4 5 6 7
0 0.2 0.4 0.6 0.8 1 1.2
Load, kN
Displacement, mm Pf
0 0.5 1 1.5 2 2.5 3
0 0.1 0.2 0.3 0.4
Load, kN
Displacement, mm Pmax
a b
4. Numerical simulation considering confining pressure 4.1. Outline of the simulation
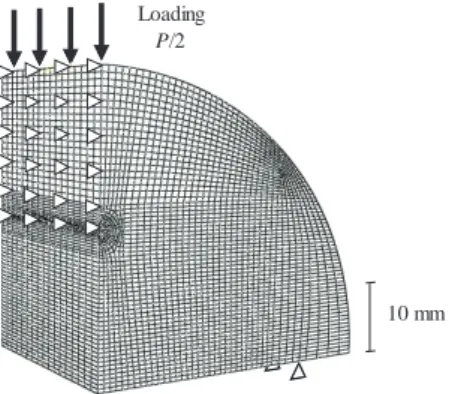
Using the maximum load Pmax obtained from the experiment, the corresponding stress intensity factor KI was calculated using a finite element code, Abaqus Unified FEA. Due to symmetry in shape and boundary conditions of the SCB specimen, only half of the structure was modeled and meshed as shown in Fig. 4. The load P was applied at the upper loading point. The dimensions of the model and the support span correspond to the specimen used in the experimental tests. KI around the notch tip was calculated using the J-integral method. The computation was almost the same as that described in Kuruppu et al. [9], which derived the function of normalized stress intensity factor YI. Young’s modulus and Poisson’s ratio of Kimachi sandstone as shown in Table 1 were used in the calculations.
The outer confining pressure σcpo was set to six conditions as the same as the experimental ones. For each condition except σcpo = 0 MPa, σcpi/σcpo was set to five conditions: 0, 1/3, 1/2, 2/3, and 1. In one series of simulations, P was applied to the model as the average value of Pmax obtained from the experiments using Specimen (I) as listed in Table 2. The stress intensity factor calculated under the condition, described as KIf in this paper, was assumed to be the fracture toughness KIc. In other series, P was not applied to the model. This KI value can be assumed to be the stress intensity factor induced due to confining pressure only, and is described as KI0.
4.2. Results and discussion
Fig. 5 shows a part of the simulation results. In this figure, the plots at P = 0 and P = Pmax are KI0 and KIf, respectively. KI0 is zero under the conditions of σcpo = σcpi = 0 and σcpi/σcpo = 1. On the other hand, under σcpi/σcpo < 1, KI0 appears as a negative value because the stress concentration at the notch tip occurs as a compression. It decreases in proportion with σcpi/σcpo. The plots of KI0 and KIf under the same σcpi/σcpo condition are connected to each other in this figure. It can be found that KI increases with increasing P. The slope of all these lines is almost the same ranging from 887 to 891 m-3/2.
The lines in Fig. 5 indicate the relation between KI and P, and KIc may be on or an extension of the line at the critical value of P. Based on Equation (1) and the simulation results, the estimation equation for KIc under confining pressure suggested in this paper is represented as;
I0 max I
Ic 2
π P K
tr Y a
K (2)
KI0 is zero under the condition of σcpo = σcpi. In this case, KIc can be estimated using Equation (1). On the other hand, when σcpi is smaller than σcpo, KI0 becomes a negative value due to the compressive stress concentration at the notch tip. Therefore, KIc under the condition of σcpi/σcpo < 1 can be estimated using Equation (2) instead of Equation (1).
YI is calculated as 6.67 at a/r = 0.5 and s/r = 0.8 [9]. On the other hand, using the slope of the lines shown in Fig. 5, YI values were estimated as from 6.90 to 6.95. The differences of YI values were under 5 %. YI calculated by Kuruppu et al. [9] can be used even though under confining pressure.
In the experimental SCB test using Specimen (O), σcpi was zero and KI0 was determined by the simulations; KI0 = -1.47 MN/m3/2 for σcpo = 2 MPa, and KI0 = -2.94 MN/m3/2 for σcpo = 4 MPa. KIc can be estimated using the KI0 value and the results are shown in Table 2 and Fig. 6. The apparent fracture toughness KIc* of Specimen (O) and Specimen (I) is also plotted as an open plot in Fig. 6. KIc (estimated by Equation (2)) of Specimen (O) is dependent on confining pressure σcp and increasing with increasing σcp. An approximation lines of this result and that of the study by Funatsu et al. [6], in which KIc was estimated under the confining pressure of up to 9 MPa using Kimachi sandstone, are drawn in this figure. These results are in agreement with each other.
As a future study, the results of Specimen (I) (under confining pressure of σcpi < σcpo) will require the estimation method. KI0 must be known not only the conditions of σcpo = σcpi but also σcpi/σcpo < 1. It was found from the simulations that KI0 can be estimated by the differential confining pressure (Δσcp = σcpo - σcpi) and a crack opening displacement (COD) [12]. The detail will be published in near future.
Fig. 4. Mesh design, boundary condition and loading configuration for simulating SCB specimen.
Fig. 5. Example results of SCB test simulation.
Fig. 6. Relation between fracture toughness and confining pressure.
Loading P/2
10 mm
-8 -6 -4 -2 0 2 4
0 0.5 1 1.5 2 2.5
Stress intensity factor KI, MN/m3/2
Load P, kN
-8 -6 -4 -2 0 2 4
0 0.5 1 1.5 2 2.5
Stress intensity factor KI, MN/m3/2
Load P, kN
-8 -6 -4 -2 0 2 4
0 0.5 1 1.5 2 2.5
Stress intensity factor KI, MN/m3/2
Load P, kN KI0
KIf c Vcpo= 10 MPa
KI0
KIf b Vcpo= 2 MPa
KI0 KIf
a Vcpo= Vcpi= 0 MPa
Vcpi/Vcpo= 1/3,
Vcpi/Vcpo= 2/3, Vcpi/Vcpo= 0 Vcpo= Vcpi= 0 or Vcpi/Vcpo= 1,
Vcpi/Vcpo= 1/2,
0 1 2 3 4 5 6
0 2 4 6 8 10
Fracture toughness K Ic, MN/m3/2
Confining pressure V
cp, MPa KIc* of Specimen (I) KIc* of Specimen (O)
Funatsu et al. [6]
KIcof Specimen (O)
5. Conclusions
In order to understand the influence of confining pressure on the mode I fracture toughness of rocks, the SCB tests under various confining pressures from 0 to 10 MPa were performed using Kimachi sandstone. Two types of specimen were prepared. In Specimen (O), the pressure applied to the notch surfaces (σcpi) is zero. In Specimen (I), there is not only the confining pressure applied except on the notch surfaces (σcpo) but also a certain value of σcpi. The numerical simulations of the SCB test considering several confining pressure conditions were also performed.
The experimental evaluation method for the fracture toughness under confining pressure was discussed based on the numerical simulation results.
The fracture toughness evaluated by the ordinary SCB testing method tends to increase with increasing σcpo. However, there is a possibility that the mode I fracture toughness was not estimated appropriately because this evaluation method does not consider the effect of confining pressure. Based on the results of the numerical simulation, the mode I fracture toughness KIc under confining pressure can be estimated using the following formula;
I0 max I
Ic 2
π P K
tr Y a
K (2)
where YI is the normalized stress intensity factor, a, r and t are the notch length, radius and thickness of the specimen, respectively, Pmax is a maximum load, and KI0 is the stress intensity factor under no applied load.
Using this equation, KIc of the rock was estimated from the experimental results. As a result, KIc is dependent on confining pressure σcp and increasing with increasing σcp.
Acknowledgements
This study was supported by Fukada Grant-Aid. This paper is one part of Ph.D. thesis in Kumamoto University [12].
References
[1] B.N. Whittaker, R.N. Singh, G. Sun, Rock fracture mechanics: principles, design, and applications (Developments in geotechnical engineering vol.71), Elsevier, Amsterdam, 1992.
[2] JSME (Japan Society of Mechanical Engineers) (Ed.), Rock mechanics and its application, Korona Publishing Co., Tokyo, 1989.
[3] K. Matsuki, T. Aoki, The effect of confining and pore pressure on fracture toughness of rocks, J. MMIJ 106 (1990) 713–718.
[4] K. Matsuki, T. Kaneko, T. Sato, Analysis of stress intensity factore of core-based fracture toughness the specimens or rock under confining pressure and evaluation of K-resistance curve, J. MMIJ 111 (1995) 749–754.
[5] N.A. Al-Shayea, K. Khan, S.N. Abduljauwad, Effects of confining pressure and temperature on mixed-mode (I-II) fracture toughness of a limestone rock, Int. J. Rock Mech. Min. Sci. 37 (2000) 629–643.
[6] T. Funatsu, M. Seto, H. Shimada, K. Matsui, M. Kuruppu, Combined effects of increasing temperature and confining pressure on the fracture toughness of clay bearing rocks, Int. J. Rock Mech. Min. Sci. 41 (2004) 927–938.
[7] ISRM, Suggested methods for determining the fracture toughness of rock, Int. J. Rock Mech. Min. Sci. Geomech. Abstr. 25 (1988) 71–96.
[8] ISRM, Suggested method for determining mode I fracture toughness using cracked chevron notched Brazilian disc (CCNBD) specimens, Int.
J. Rock Mech. Min. Sci. Geomech. Abstr. 32 (1995) 57–64.
[9] M.D. Kuruppu, Y. Obara, M.R. Ayatollahi, K.P. Chong, T. Funatsu, ISRM-suggested method for determining the mode I static fracture toughness using semi-circular bend specimen, Rock Mech. Rock Eng. 47 (2014) 267–274.
[10] M. Kataoka, Y. Obara, Estimation of fracture toughness of different kinds of rocks under water vapor pressure by SCB test, J. MMIJ 129 (2013) 425–432.
[11] M. Takahashi, Y. Fuji, C. Ahn, T. Takemura, N. Takahashi, H. Park, Microstructure in Kimachi sandstone obtained with mercury intrusion porosimetry and micro focus X ray CT structure analysis, J. Japan Society Eng. Geology 52 (2011) 184–191.
[12] M. Kataoka, Fundamental study on fracture toughness and fracture mechanism of rocks, PhD thesis, Kumamoto Univ., Kumamoto, 2015.