Utilization of Partial Reflection Spectrometry
for the Analysis of a Liquid-Liquid Interfacial Adsorbate
Yoshio Moriya*, Sumio Kato*, Munekazu Nakamura**, Nobuaki Ogawa* and Shinichi Nakata*
Abstract
The utility of partial reflection spectrometry was investigated by the use of protonated tetraphenylporphyrin adsorbed at the liquid-liquid interface and by home-made optical devices. External reflection (ER) spectrometry was effective to distinguish interfacial Gibbs adsorbates from lipophilic solute in the organic phase and to discriminate the adsorption-state change to multilayer from monolayer. Positive and negative bands have been observed in the p-polarized partial internal reflection (P-PIR) spectra, whose band location correspond to those in p-polarized external reflection (P-ER) spectra. Nevertheless, the bands in the p-PIR exhibited reversed sign to those ofp-ER spectra. These suggest that the surface selection rule of the p-PIR spectrometry has a reversal rule ofp-ER, and PIR can also be used for the analysis of molecular orientation.
1. Introduction
It is known that a liquid-liquid interface is a unique chemical reaction field, where molecular species are spontaneously trapped to generate transient intermediates or organized molecular aggregates with an orientation which is not available in a bulk solution. Such phenomena at the interface, therefore, have received a great deal of attention in various fields, including phase-transfer catalysis(l), separation chemistry(2) and biochemical sciences(3). There are not many research means against liquid-liquid interface compared with the solid surface or the air-liquid interface.
Interfacial adsorptivity of a solute is usually measured by the classic interfacial-tension lowering method when the solute is considerably soluble, though the method can offer no information about the interfacial chemical species itself.
The investigation of interfacial reaction mechanisms in solvent extraction system has progressed greatly, since the high-speed stirring method was developed in early the 1980s(4). However, this method is also an indirect method for identification of an interfacial adsorbate. It is only the past ten years that several direct methods began to be developed to investigate the interface-specific chemical
Received July 18, 2003
* Faculty of Engineering and Resource Science, Akita University.
** Faculty of Education and Regional Science, Tottori University
phenomena in a liquid-liquid contact system. These are two-phase transmission spectrometry represented by centri- fugal liquid membrane method(5), attenuated total-internal reflection (ATR) spectrometry(6),(7), total internal reflection (TIR) fluorometry(8), resonance Raman spectrometry(9),(IO), and second harmonic generation (SHG) spectrometry(ll).
Among these, the two-phase transmission UV-visible spectrometry and the ATR spectrometry are particularly useful for the easy measurement setup when the adsorbate has a strongly absorbing chromophore. Both techniques, however, have a common problem that it is difficult to distinguish interfacial Gibbs adsorbates from lipophilic solute in the organic phase, since the UV-visible light passes through the organic phase.
The present paper describes the utility of partial reflection (PR) spectrometry for the analysis of a highly color-sensitive adsorbate at a liquid-liquid interface. In other words, the purpose of the present work is to elucidate what kinds of useful information can be acquired when a geometric condition of reflection is expanded from ATR to ER or a partial internal reflection (PIR), using a protonated tetraphenylporphyrin produced at the inert organic solvent-acidic aqueous solution interface.
2. Experimental Section
Material: For the detection of trace adsorbates by
electron-transition spectroscopy within the visible wave-
length region, 5,10, 15,20-tetraphenyl-2 1 H,23H-porphine (H
2TPP, Dojindo Laboratories) was used as a highly- sensitive coloration reagent. This lipophilic porphyrin was dissolved in toluene or in dodecane to have each of stock solutions. The solutions were further diluted to yield a proper concentration of H
2TPP.
Fig. 1 Structure oftetraphenylporhyrin (H
2TPP).
Methods: A schematic illustration of a home-made optical device comprised of a quartz liquid-cell (light path length: 2 cm, cell width: 1 cm) and a pair of right-angle quartz prism is presented in Fig. 2. This device was previously designed for the analysis of saturated interfacial adsorbates. By changing the height of the adjuster, the measurement mode can be switched for the transmission absorption spectra of the organic and aqueous phases (A
org,A
aq)and the reflection spectra at the liquid-liquid interface (ER, ATR), which are dragged down with the corresponding blank spectra. In the toluene-4 M H
2S0
4system, the angle of incidence with right-angle prism is fixed to be
Br:R=73.0° for ER and B
ATR= 74.4° for ATR, which are greater than the critical angle (Be =
,c....-.:--"...-
ATR
----+t---::-r~~:...;;...-l+--_t!> A ao
o I Adjuster
Fig. 2 A schematic illustration of the fixed-angle device. RT: refracted transmission.
66.9°). In the dodecane-4 M H
2S0
4system, the angle of incidence is estimated to be
Br:R=79.4° and B
ATR=79.8° (>B
e=74.8°) when the pair of right-angle prism in Fig. 2 is replaced by that of 30°-30°-120°. The spectrophotometric measurements with the device were carried out on a Perkin Elmer (Wellesley, MA, USA) Model 11,40 double-beam UV-visible spectrometer.
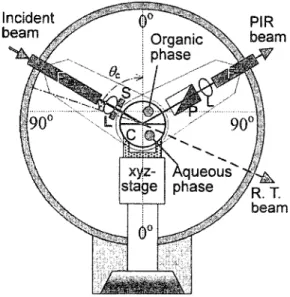
The prism-cell device is, however, inconvenient for variable-angle measurements, since the angle of the incidence is fixed. Therefore, we have improved the device, so that the ER or other optical geometries would readily be employed. A schematic illustration of the new device (variable angle) is presented in Fig. 3. This device was also designed to enable us to perform measurements with the transmission, ER, ATR (TIR) and PIR geometries. For this purpose, optical fibers (F, 600 /-lm in diameter) and terminal lens (L) were assembled on a goniometer. Screen (S) with an orifice (2-mm i.d.) was mounted after the focus lens in the incidental path, and a Glan-Thompson polarizing prism (P) was placed before the lens in the light-collection path. A cylindrical cell (C: capacity of 8 cm
3with 2-cm Ld. and 2.55 cm in length) was placed on a xyz-stage. When the aqueous phase of 4 cm
3contacts with the organic phase of 4 cm
3,the interfacial area is about 5.1 cm
2.The largest angle of incidence for both internal and external reflections was about 83° with an experimental error of ±1.5°, while the error of polarization adjustment was estimated to be about
±2°. Spectroscopic measurements of ER and PIR were
Fig. 3 A schematic illustration of the variable-angle
device. F: optical fiber, L: lens, S: screen with an orifice,
C: cylindrical cell, P: polarizer.
carried out by the use of an Ocean Optics Inc. (Dunedin, FL) Model USB2000 CCD array spectrometer. The inside the upper part of the cell, which was designed to contact the organic phase (Figs. 2 and 3), was surface-coated with the toluene solution of dimethyldichlorosilane (5%) for hydrophobic coating, to make the liquid-liquid interface flat.
3. Results and Discussion 3.1 Effective application of ER method
The ATR technique has a problem that it is difficult to distinguish interfacial Gibbs adsorbates from lipophilic solute in the organic phase, since the UV-visible light passes through the organic phase. In such a case, the external reflective (ER) method will serve as a very useful means. In this method, an incident light is projected obliquely toward the liquid-liquid interface from a lower-refractive index medium to a higher one, where the quantity of partial reflection light is detected depending on the interfacial concentration of adsorbate and on the angle of incidence.
The ER spectrometry for liquid-liquid interface was firstly applied to H2TPP in the toluene-4M H2S04 system(12).
After pouring the same volume (3 cm
3)of 4 M H2S04 and toluene into the prism-cell, blank spectra for the absorptions of organic and aqueous phase and those for the ATR and ER were measured, respectively. A slight portion of the stock toluene solution of H2TPP was added stepwise, and only the organic phase was· mildly stirred by a Teflon needle without disturbing the interface to yield homoge- neous solution of arbitrary total-concentration within 0.2 <
[H2TPP]t /JlM < 2.5. The spectral measurement at each of [H2TPP]t was carried out after spending 1 h, which was enough to attain the interfacial adsorption equilibration.
Several spectra related to H2TPP in the toluene-4 M H2S04 system ([H2TPP]t = 2.3 JlM) are shown in Fig. 4. It can be seen that the ER spectrum is observed with three negative bands at 720, 473 and 412 nm, and that the spectrum is not interfered with the solute in the organic phase. Therefore, the spectrum of interfacial adsorbate itself has three main bands in the visible wavelength region. This was confirmed also by the ATR spectrum of adsorbate (ATR ad ) estimated from equation,
AATRad(A) = AATR(A) - Aorg(A)/sinBATR (1) where AATRad(A), AATR(A) and Aorg(A) refer to the values of absorbance at the wavelength A of ATRad, ATR and of
8 c:
-e co o 0.5
~ en
o
-0.5
'--"-_...I-_..r..----I"'---..&._...I-_..r..----I_--'400 450 500 550 600 650 700 750 800 Wavelength I nm
Fig. 4 Several spectra relating to H2TPP in the toluene-4 M H2S04 system. [H2TPP]t = 2.3 IlM.
organic bulk phase, respectively. The band locations of ATRad (thin gray line) agreed well with that of ER with a symmetrical pattern. Thus, a nearly pure spectrum of interfacial adsorbate itself could easily be observed by the ER method, except for a slight interference with absorption band at 435 nm in Aaq, which is arisen from the Soret band of H4TPP 2
+
aq distributed in the aqueous phase.
It is interesting that the Soret bands (B-band) of
aggregate (H4TPPX2)n (X=HS04) appear at two wavelength
positions, 412 and 473 nm: the former band exhibits a
blue-shift, whereas the latter one shows a red-shift with
respect to the B-band at 435 nm of monomeric species in
the aqueous phase. According to the discussion on the
relationship between band-shift mode and aggregation
type(I3),(I4), such a spectrum may derive from a co-
adsorption of H- and J-type aggregates or from aT-type
(zigzag) aggregate. Regardless, it would be more
reasonable to assign it to the J- type aggregate in the
present case, since our reflection spectra resemble the
flow-induced dichroic spectrum for J-aggregate of
water-soluble porphyrin, 5,10, 15,20-tetra(4-sulfophenyl)
porphyrin (H2TPPS44-) in an acidic form, (H4TPPS/-)11
with a slipped face-to-face stacking(15). In the system, sharp
and intense absorption bands at 491 and 707 nm are
considered to arise from the dipole moment polarized along
the long axis with an aid of interporphyrin charge resonance
in the excited states, whereas a broad absorption band at
420 nm arises from the moment along the short axis, which
is exclusively ascribed to the exciton resonance excited state(l5). The bands correspond well to those at 473, 720 and 412 nm in our reflection spectra of (H4TPPX2 )n,i, respectively. The absorbance of ER band (MER\ in absolute quantity) at each of the minimum wavelengths was increased with the increment of [H2TPP]h and the spectral patterns were analogous each other. The protonation- adsorption reaction in this system could be represented stoichiometrically by:
(m+n) H2TPPo + 2(m+n) HXaq
~(H4TPPX2)n,i + m H4TPp 2
+aq + 2m X'aq (2) where nand X' refer to the association number and the anion (HS04'), respectively. When we neglect a small amount of H4TPP 2
+
aq, we can estimate the interfacial molecular density [H
4TPPX2 ]i (mol cm'z) from equation,
[H
4TPPX2 ]i = ([H2TPP]t- [H2TPP]eq,o) (V JSi) (3) where [H2TPP]eq,o refers to the concentration of HzTPP under the adsorption-equilibration condition with the organic bulk volume of V
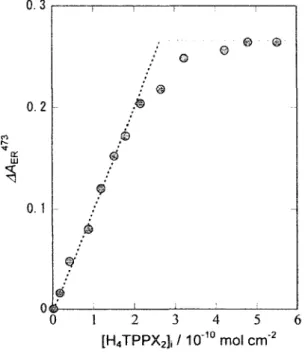
oand the interfacial area Si, and it is obtainable from the Aorg-spectrum. The relation between MER 473 and [H4TPPX2 ]i under the concentration condition within 0 < [HzTPPltIJlM < 2 is shown in Fig. 5. The value of ME 473 varies in proportion to [H4TPPX2 ]i (<2 X 10.
10mol cm,2), and then reaches gradually to a plateau. The saturated interfacial molecular density (DiS) in a monolayer-adsorption state was estimated to be 2.67 X 10.
10mol cm· 2
from the intersection of two dotted lines depicted in Fig. 5. The
value means the occupied area per molecule (A) to be 0.63nm 2 at the interfacial saturation. An interfacial molecular orientation could be estimated from the A and a cross sectional area (a) of H2TPP 2
+.
When we use a = 1.9 nm 2
obtained from the molecular mechanics (MM2) calculation(5), the orientation angle (¢) of the pyrrole ring plane against the surface normal is estimated to be 19.4°.
The value of ¢ as well as that of DiS may be varied by taking into account the amount of aqueous species precisely.
In any event, the pyrrole ring plane must be appreciably tilting at the interface.
3.2 Discrimination of interfacial adsorption states When the dodecane solution of H2TPP is kept in contact with the 4M H2S04 in a prism-cell device, the solute in the organic phase decreases gradually until it disappears completely one day after to produce the protonated species at the interface and in the aqueous phase.
In order to accelerate the interfacial adsorption reaction, a portion (3 cm 3
) of the initial dodecane solution and the same volume of 4 M H2S04 were mixed by shaking (250 strokes min,l for 30 min) in a stopper Teflon test tube, and it was centrifuged for phase separation. The aqueous and the organic phases were transferred entirely into the prism cell replaced by 30°-30°-1 20°-prism. The initial H2TPP concentration was determined by the absorbance of Soret band at 416 nm (Asoln416) with a I-em optical cell, by use of
O. 3
, . . - - - , 1 , . - - - " 1 - - . . . . , . 1 - - ' 1 - - . . , - 1 - - - ,A
sa10X 2
Fig. 5 Plots of MER 473
VS.[H4TPPX2 ]i
Inthe toluene-4M H2S04 system.
. : •
o b1
~ i i i io 1 2 3 4 5 6
[H
4TPPX
2]i /10.
10mol cm·
2800
500 600 700
Wavelength I nm 400
Fig. 6 Five spectra related to H2TPP in the dodecane-4 M H2S04 system. The initial solution spectrum (Aso1nx2) is shown for comparison. [H2TPP]t = 0.14 JlM.
-
...
. '
~
"
O. 1
1 2 3 [H 4 TPPXil I /10- 10 mol cm- 2 0.5 _ _...-_.__.,...,,...--.-__-.-- _
all bands are proportional to one another. This concentration region should correspond to a monolayer adsorption state.
When the concentration exceeds the limit, the proportionality nature cannot be maintained but a new linear-relation appears. In order to estimate the value of
DiSin this liquid-liquid system, however, the plots of reflection absorbance
VS.[H4TPPX
2]i are required. And it is necessary to ask for the value of [H4TPp 2 +]aq first for knowing the value of the [H4TPPX2 k The molar absorptivity of this water-soluble species was evaluated to be Caq435 = 3.81 x 10⁵ M-Icm- I in our previous work(17). When the interfacial area S (cm 2 ) is formed by the contact of two phases in the same volume V (cm 3 ), the interfacial molecular density, [H4TPPX2 ]i (mol cm- 2 ) under the present experimental conditions can be evaluated by
[H4TPPX2 ]i
= 10·3( VIS) { (A soln
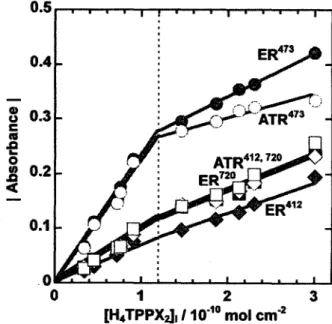
4161 &soln416/IHAaq435 I Caq435/2)} (4) where Aso1n416 and Aaq435 are referred to the observed absorbance of the initial dodecane solution with 1 cm cell (/1= 1 cm) and that of the aqueous phase with prism-cell (/2= 2 cm), respectively. The reflection absorbance of ATR and ER (in absolute quantity) at 720, 473 and 412 nm were plotted against the value of [H4TPPX2 ]i in Fig. 8. An inflection point is commonly appeared in every plot at [H4TPPX2 ]i = 1.20x10-
10mol cm- 2 . Within the molecular density region of 0 < [H4TPPX2 ]i Imol cm- 2 < 1.20x10-
10,the reflection absorbance at a fixed angle of incidence is proportional to [H4TPPX2 ]i. This result suggests that the
Fig. 8 Relations between the absorbance and the interfacial molecular density of diprotonated species.
I. 3
-
C."0 .c ..
Ii- .c 0
II).- <C 0.1
-
I
0.3
0.5
I I0.4 - •
Q)
.- 0
0
c: 0.3
-~oc§)
.0
ro
~
~
0.2- ~ ,
0(f)
•
.0
~~ -:
<{
0.1 ~ • • - ' • o . . .
I Io 0.1 0.2
[H
2TPP]t I JlM
Fig. 7 Absorbance plots (in absolute quantity) of several bands against [H2TPP]to Symbols are; +: ER412, . : ER 473
, . : ER
720,<>: ATR 412 , 0: ATR473, 0:
ATR
720•the molar absorptivity (Csoln416 = 4.33x10 5 M- l cm- I i 5 ). The absorbance of Aaq, ATR and ER spectra reached their mostly constant values within three hours, after the slight change. Typical spectra observed under the condition of a total concentration [H2TPP]t = 0.14 JlM are presented in Fig.
6. The Soret band at 416 nm in Asoln was not observed in Aorg after the shaking procedure. Therefore, the ATR spectrum in Fig. 6 is suggested to reflect the interfacial adsorbate itself. In the ER spectrum, a negative-absorbance band is observed mostly in the same way with that in the toluene-4M H2S04 system, though the spectrum is interfered with the 435nm-band of H4TPp 2 \q in the aqueous phase. So, in the case of dodecane-4 M H2S04 system, quantity of H4TPP 2 +aq cannot be disregarded.
Five kinds of spectra as shown in Fig. 6 were measured using dodecane solution of initial concentrations within 0.03 < [H2TPP]t fJlM < 0.32. In order to grasp an early stage of the interface after the two-phase mixing, the spectroscopic measurements were performed at about 25 minutes later. The reflection absorbance (in absolute quantity) of the three bands is plotted against [H2TPP]t in Fig. 7. It can be seen that the plots only give some curves increasing in drops with no plateaus, in spite of the sufficient supply of adsorbate for the interfacial saturation.
Such a tendency, which is not observed in the
toluene-aqueous sulfuric acid system, suggests a certain
change relating the interfacial adsorption states. It turns out
that the absorbance plots of ATR A (A= 412,473 and 720 nm)
and ERA (A=412 and 720 nm) against the ER 473 produce a
clear inflection point near the position corresponding to
[H2TPP]t . 0.15 JlM in each of the plots series(l6). Within
the limits of this concentration, the absorbance values for
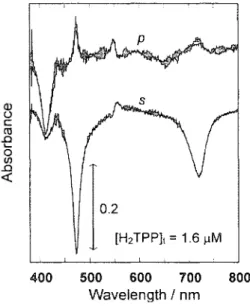
Fig. 9 The s- and p-polarized ER spectra of (H
4TPPX2 )n,i for the toluene-4M H2 S0
4system. The spectra were measured with the insert of dichroic sheet polarizer across the light beam in Fig. 2.
molecular orientation of diprotonated species (H
4TPp 2 +) in the adsorbates is fixed by the formation of an aggregate.
This linearity breaks beyond the concentration range, and another linearity with a different slope appears. This phenomenon also suggests that the interfacial adsorption state changes from a monolayer form to a multilayer one with different molecular aggregation, which would result in a different reflection coefficient. Therefore, the value of
Diswould correspond to the inflection point at [H
4TPPX2 ]i = 1.20x 10- 10 mol cm- 2 . Then, the value of ¢ is roughly evaluated to be 47°, on an assumption that the projectiohs of the planes onto the interface are not overlapped with those next to each other.
3.3 Measurements of polarized partial reflection spectra The molecular orientation of the H
4TPP 2
+
species at the interface was evaluated from the saturated interfacial molecular density in the monolayer in the former section. A spectrometric information on a semi-quantitative orientation would also be obtained from p-polarized ER spectra(
18),(19).
The s- and p-polarized ER spectra of (H
4TPPX2 )n,i for the toluene-4M H2 S0
4system are shown in Fig. 9, which are measured with the insert of dichroic sheet polarizer across the light beam in Fig. 2. A signal around 550 nm is not any band but a mechanical one. In the s-polarized spectrum, all bands appear with negative absorbance, and
the absolute quantity of absorbance for 720 and 473 nm bands increases while that for 420 nm band decreases as compared with the ER spectrum depicted in Fig 4. In the p-polarized spectrum, however, the two bands at 720 and 473 nm appeared with small positive absorbance while the 420 nm band appeared with large negative one. This observation of positive/negative bands in a p-polarized ER spectrum is the first example in the case of a liquid-liquid system(20), which can be related with the interface selection rule of ER method as mentioned later. If required, we can choose the reflective absorption band appeared in high sensitivity from such polarization spectra for a stoichiometric analysis.
In order to observe angle-dependent p-polarized spectra. of (H
4TPPX2 )n,i in the dodecane-4 M sulfuric acid system, we used the variable-angle device illustrated in Fig.
3. After preparing the dodecane-4 M sulfuric acid solution followed by centrifuging, an aliquot (4 cm
3)of aqueous phase and the same volume of dodecane phase were introduced into the cylindrical cell for the blank measurements at several angles of incidence. A slight portion (20 ilL) of dodecane phase in the cylindrical cell was replaced with a stock solution of H2TPP (18.2 IlM), and only the organic phase was mildly stirred by a Teflon needle without disturbing the interface to yield homogeneous solution of total concentration [H2TPP]t
=0.09 IlM. The spectral measurement of interfacial adsorbate in the monolayer was carried out after spending I day, since a long period of time over 12 hours was required till the solute (H2TPP) in the organic bulk phase was diminished entirely with the interfacial adsorption reaction. In the dodecane-4 M sulfuric acid system, the Brewster angle
(~)for external and internal reflection conditions are estimated to be 46° and 44°, respectively. The measurements of ER spectra were carried out at 80° and 75° (>~), while those of PIR spectra were performed at 70°, 65° and 60° «Be), with which a relatively higher signal-to-noise (SIN) ratio was maintained under our experimental conditions.
The p-polarized ER (P-ER) spectra are shown in Fig.
10. The spectra have two positive bands (at 720 and 473 nm) and one negative band (at 412 nm), which are similar to the p-ER spectrum in the toluene-4M H2 S0
4system as shown in Fig.ll. According to the surface selection rule of ER(19
H22), the positive bands can be attributed to the chromophore having an electron-transition moment parallel to the interface, while the negative band to that perpendicular 800
1 0.2 [H2TPP]t = 1.6 J.lM
500 600 700
Wavelength I nm 400
(1)
u c co
.0L-
o
(/)«
.00.2 r--...,.---r--~-- __- - - . Fig. 10 The p-polarized ER spectra of (H
4TPPXz)n,i at
Br:R: 80° and 75°. [HzTPPlt
=0.09 ~M.
in a liquid-liquid system to our knowledge(Z3). The intensity of all bands increased with decreasing the angle of incidence toward fk, which are similar to the p-ER spectra.
It is of note that another positive band appears at about 650 nm with a decrease of angle. These theoretical agreements between the observed PIR and ER spectra suggest that both ER and PIR measurements were performed properly, and PIR is useful as well as ER.
In general, PIR absorbance spectra mostly exhibit positive bands only, and the spectral characteristics are similar to ATR spectra, since the reflection measurements are generally performed at a large angle of incidence. When the angle of incidence becomes less than the critical angle, however, a characteristic of ER appears. This indicates that PIR spectrometry is an intermediate of ATR and ER spectrometries.
Judging from the appearance of the positive/negative bands in the p-polarized PIR spectra with reversed signs, we propose a selection rule for PIR method: positive bands correspond to the chromophores having a perpendicular electron-transition moment to the interface, while negative bands correspond to those having a parallel moment to the interface when the angle of incidence is within the region Be
>BpIR > fk. As for the region of 0° < (1,IR < ~, vise versa.
This selection rule suggests that the PIR method is useful as an alternative analytical technique to the ER method for semi-quantitative orientation analysis of adsorbed species at a liquid-liquid interface. Of note is that PIR spectrometry has the advantage over ER of a better SIN ratio at a low angle of incidence «Be) due to the high optical throughput, which is favorable for the liquid-liquid system containing a hydrophilic solute in the aqueous bulk phase. The ER spectrometry, on the other hand, has an advantage that a wide range of angle of incidence with no critical angle is available, which is favorable for the liquid-liquid system containing a lipophilic solute in the organic bulk phase. In this fashion, it has been suggested that the two partial-reflection techniques can be complementary each other.
4. Conclusion
The in situ measurements of partial reflection spectra in the visible wavelength region are found to be very useful to analyze the interfacial adsorbates in the liquid-liquid system as mentioned bellow.
ER spectrometry is effective to distinguish interfacial
800
- - - 7 0 °
••••••••• 65°
60°
500 600 700
Wavelength I nm 400
-0.2
-€f}: !./...
jjirr
[... ~~ I
-0.4 '----"-_ _---'-_ _
---1._ _--...1._ _- - - '-0.3
B -0.1 c as
.Q
o -0.2
.Q
o
« -0.3
·0.4
Cl>
(J
-0.1
c as
.Q
....
o o
.Q
![Fig. 4 Several spectra relating to H2TPP in the toluene-4 M H2S04 system. [H2TPP]t = 2.3 IlM.](https://thumb-ap.123doks.com/thumbv2/123deta/6673046.2197277/3.892.470.798.114.430/fig-spectra-relating-h-tpp-toluene-tpp-ilm.webp)
![Fig. 11 The p-polarized PIR spectra of (H 4 TPPXz)n,i at BpIR: 70° , 65° and 60°. [HzTPP]t = 0.09 IJM.](https://thumb-ap.123doks.com/thumbv2/123deta/6673046.2197277/7.902.85.428.122.394/fig-polarized-pir-spectra-tppxz-bpir-hztpp-ijm.webp)
