<報告書>
k-means法によるソフトテニスゲームのボール落下点の識別
工 藤 敏 巳
1山 本 裕 二
2 1. 目的対人競技において、対戦相手の特徴を把握することは極めて重要である。テニス競技におい て、対戦相手の打球コースを予測し、ボールの落下位置に素早く移動し打球することが求めら れている。このようなプレーを行なうために、プレー中、プレイヤーは打球コースの予測に 様々な手がかりを利用している。一つは、打球フォームなどの形態情報で、もう一つは配球パ ターンやプレイヤーのポジションなどの文脈情報が挙げられる。形態情報に関連する研究で は、視線計測や注視点デバイスから予測の手がかりとなる身体部位を特定したり、時間遮断パ ラダイムを用いて形態的な予測手がかりを見つけ出したりすることに力が注がれてきた
(Williams, A. M., Ward, P., Knowles, J. M., 2002)。
一方、予測手がかりとしての文脈情報に関する研究として、熟練されたプレイヤーの位置情 報がショット結果の予測に影響することを示したLoffing & Hagemann (2014) の研究などが ある。Kudo, T., Yamamoto, Y., Shinohara, H., & Kudo, R. (2017) は、プレイヤーは対戦相手 のプランニングされた配球パターンを基に予測しているとして、①あらかじめ設定されたコー ト区分に落下した打球数の離散的確率変数を算出し、②2打の打ち分けについて状態遷移確率 を求め、事前情報としての文脈情報を分析することの重要性について示唆した。ここで設定さ れたコート区分は、コート半面を単に縦横3分割し、9区画内に落下したボールの位置に対す る2打の状態遷移確率を求めるものであった。実際の試合状況において、プレイヤーは9区 画に打ち分けておらず、プレイヤーの個性に応じて、例えば得意なコースや対戦相手の弱点と なるコースに打球している。従って、状態遷移確率はコート区画数や形状に影響されるので、
より精密な打球コースの分類が必要とされることが課題として残されていた。
そこで、本研究ではプレイヤーが打球したボールの落下位置を機械学習のクラスタリング手 法を用いて分類することが可能であるか検討することを目的とした。クラスタリング手法には 距離が近いクラスタを段階的に結合する階層的手法と決められたクラスタ数でデータを分類し
1 宮城学院女子大学学芸学部心理行動科学科教授
2 名古屋大学総合保健体育科学センター教授
最適分割を探索する非階層的手法があるが、本研究では非階層的手法の一つでハードクラスタ リングに分類されるkmeans法(Arthur, D., Manthey, B., & Röglin, H., 2011)を用いて、
ボールの落下位置をクラスタに分類した。ソフトクラスタリング手法として混合ガウスモデル によるクラスタリングの手法もあるが、各落下点が一つのクラスタに所属することを前提とし ているので、kmeans法を採用した。
2. 方法
2.1. 分析対象と撮影方法
2018年9月1日に行なわれたアジア大会ソフトテニス競技男子団体戦決勝シングルスと 2019年10月28日に行なわれた世界ソフトテニス選手権大会男子個人戦シングルス準々決勝 の2試合を分析対象とした。いずれの試合の利用については日本ソフトテニス連盟医科学委 員会の承諾を得ている。
デジタルビデオカメラをコートの手前ベースラインの後方約15 m、コート面から約10 m の高さに設置し、手前側ベースラインが入るようにズームを調整し撮影した。
2.2. 実座標データの取得
まず、録画されたビデオ映像をPCに取り込み(画面解像度720×480)、2名の選手が打球 したボールの落下位置を30 Hzでデジタイズし、二次元DLT法を用いて実座標データを計測 した。その座標系はFigure 1に示している。
Figure 1 Coordinate system used in this study. Near side means closer to the video camera.
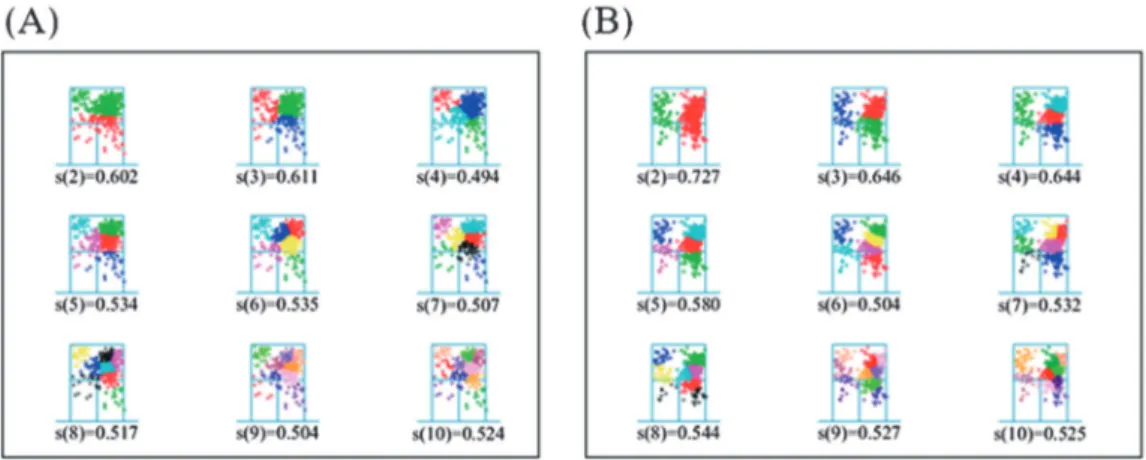
Figure 2 Results of cluster analysis using the k-means method at the 2018 Asian Games. s is the silhouette coefficient. The numbers in parentheses indicate the number of components.
Panel (A) shows Player A. Panel (B) shows Player B.
ソフトテニスの試合では、チェンジサイズは奇数ゲーム終了後に行われるため、コート奥側
(Far side)から打球した座標位置をコート手前側(Near side)から打球したものに座標変換 した。
2試合の全ポイントのうち、ラリーが3本以上継続したものを分析対象とし、2本以下のラ リーは除外した。また、打球の結果がエラーとなった最後のラリーも除外した。結果的に分析 対象となったのは、2018年アジア大会の試合については、A選手が327打、B選手が329打 で、2019年世界選手権大会においては、C選手は248打、D選手は242打であった。
3. 結果と考察
3.1. k-means法によるクラスタリング
kmeans法を適用するにあたり、あらかじめ成分数を2から10の範囲に設定した。Figure 2
は、2018年アジア大会における2名の選手の打球コースについて、成分数ごとにkmeans法 によってクラスタリングを行なった結果である。Figure 3は2019年世界選手権大会における クラスタリングの結果を示している。
3.2. 成分数の最適解
成分数の適合性はシルエット係数から評価した。シルエット係数を計算するには、分類され た同じクラスタ内にある1点とその他すべての落下点との平均距離からクラスタの凝集度a(i) を計算する。次に、最も近くにあるクラスタ内のすべてのサンプルとの平均距離を計算し、そ
の次に近いクラスタからの乖離度b(i)を計算する。求めた凝集度と乖離度から式(1)に従って シルエット係数s(i)(-1 ≤s(i)≤ 1)を計算する。シルエット係数の最大値を取る成分数が最適解と 評価される (Rousseeuw, 1987)。
S(i)= b(i)-a(i)
max{b(i), a(i)} (2≤i≤ 10)…(1)
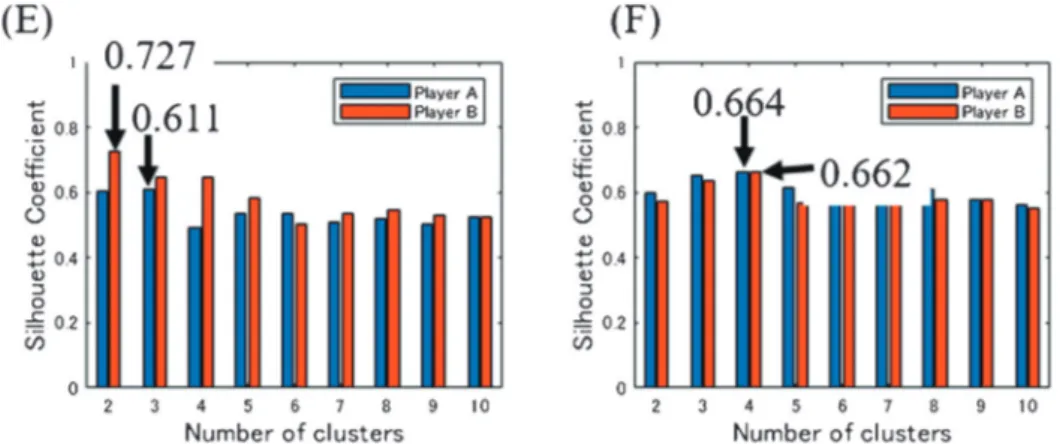
Figure 4は各成分数のシルエット係数を大会別・選手別に示している。(E)は2018年アジ
ア大会、(F)は2019年世界選手権大会のシルエット係数を表している。2018年アジア大会 におけるA選手の最適成分数は3で、B選手は2である。つまり、kmeans法によるクラス
Figure 4 Silhouette coefficient for each component number. Panel (E) shows it for the 2018 Asian Games. Panel (F) shows it for the 2019 World Championships.
Figure 3 Results of cluster analysis using the k-means method at the 2019 World Championships. s is the silhouette coefficient. The numbers in parentheses indicate the number of components. Panel (C) shows Player C. Panel (D) shows Player D.
タリング分析では、A選手の打球コースを3コースに、B選手について2コースに分類するの が最適であることを表している。同様に、2019年世界選手権大会では両選手とも成分数が4 の時にシルエット係数が最大値を示しており、両選手とも4コースに打ち分けて打球してい ると評価できる。
4. 今後の課題
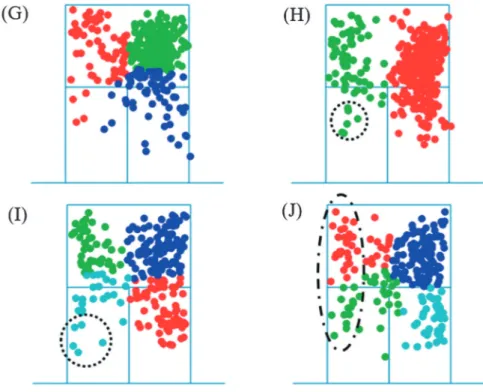
Figure 5は、Figure 2とFigure 3から最適な成分数を示す図を拡大したものである。Figure 5
(G)は、Figure 2(A)の成分数が3、Figure 5(H)はFigure 2(B)の成分数が2の図を示してい る。また、Figure 5(I)は、Figure 3(C)の成分数が4、Figure 5(J)はFigure 3(D)の成分数が4 の図を示している。
今回、解析の対象として国際大会でのトップレベルの2試合を扱った。こうした競技レベ ルの高い試合において、選手は左右の2コースに打ち分けて試合を進めることはなく(Figure 5
(H)点線部分)、ドロップショットなどを織り交ぜて試合を組み立てる。実際に映像を確認し
Figure 5 is an enlarged version of Figures 2 and 3 showing the optimal number of components. Panel (G) and Panel (H) shows the results of the cluster analysis of the 2018 Asian Games. Panel (I) and Panel (J) shows the results of the cluster analysis of the 2019 World Championships.
ても、ドロップショットを使いながら試合を進めていた。しかし、ドロップショットのように 打球の頻数が少ないコースは、今回のkmeans法によるコースの分類では打球数が多いクラ スタに取り込まれてしまい、クラスタとして分類されていない(Figure 5(H)および(I)点線部 分)。頻数が少ない打球コースの識別が今後の課題として残された。
また、kmeans法は円状や球状のクラスタを識別することが得意である。Figure 5(J)の一 点鎖線部分のように、ライン際の落下位置の識別ができていないと思われる。ライン際のウイ ニングショットをより詳細にクラスタリングするためには、ラリーの結果(エース、エラー、
継続)の属性を設定しクラスタ化を試みる必要があろう。本研究では、非階層的クラスタリン グ手法として、kmeans法を採用しボール落下位置のクラスタリング分析を行なったが、ソフ トクラスタリング手法である混合ガウス分布モデルの適用によって、ライン際のボール落下位 置に対する識別が可能であるか検討する必要があろう。
引用文献
Arthur, D., Manthey, B., & Röglin, H. (2011). Smoothed analysis of the κmeans method. Journal of the ACM, 58(5), 1–31. https://doi.org/10.1145/2027216.2027217
Kudo, T., Yamamoto, Y., Shinohara, H., & Kudo, R. (2017). State Transition Probability as the Antici
pation Clue of the Course of a Struck Ball. Advances in Physical Education, 07(03), 343–353. https://
doi.org/10.4236/ape.2017.73028
Loffing, F., & Hagemann, N. (2014). OnCourt Position Influences Skilled Tennis Players’ Anticipation of Shot Outcome. Journal of Sport & Exercise Psychology, 36(1), 14–26. https://doi.org/10.1123/
jsep.20130082
Rousseeuw, P. J. (1987). Silhouettes: A graphical aid to the interpretation and validation of cluster analysis. Journal of Computational and Applied Mathematics, 20(C), 53–65. https://doi.org/10.1016/
03770427(87)901257
Williams, A. M., Ward, P., Knowles, J. M., & Smeeton, N. J. (2002). Anticipation skill in a realworld task: Measurement, training, and transfer in tennis. Journal of Experimental Psychology: Applied, 8(4), 259–270. https://doi.org/10.1037/1076898X.8.4.259
(2020年4月13日受領、2020年5月13日受理)
(Received April 13, 2020; Accepted May 13, 2020)
Classifying the endpoint of the ball trajectory in soft-tennis matches using a k-means clustering algorithm
Toshimi KUDO Yuji YAMAMOTO
It is essential to understand the characteristics of one’s opponent in competitive sports. For example, in tennis, the player must predict the trajectory of the ball hit by the opponent and move quickly to where the ball is going to in order to hit it back. It is well known that to accom
plish this, the player must predict the trajectory based on contextual information such as the opponent’s position and placement. Kudo et al. (2017) suggested the importance of the player calculating (1) the discrete random variable of the number of balls falling in each of the prede
termined court sections, and (2) the state transition probability for two consecutive shots, and of analyzing contextual information as preliminary information. However, the sections used to classify the shot trajectories were obtained by simply dividing the court into ninths, and a more precise classification of shot trajectories was needed.
In this study, we attempted to classify the endpoint of the ball trajectory hit by players us
ing a kmeans clustering algorithm. Although the results were sound overall, some issues re
main unresolved, such as an inability to discriminate shots hit from less frequently used sec
tions.